D.E.Ü.İ.İ.B.F. Dergisi
Cilt:21 Sayı:1, Yıl:2006, ss:47-69
SOURCES OF GROWTH IN TURKISH PUBLIC AND PRIVATE MANUFACTURING SECTORS
Arzu ALVAN *
ABSTRACT
The aim of this study is to investigate the sources of growth in selected public and private sectors of Turkish Manufacturing Industry between the years 1990 and 2000. For this, a 2-Deflator Growth Accounting Approach (Harberger, 1997, 1998) has been used in the study. According to the results of the study, the sources of growth vary across the manufacturing sector. Since capital`s contribution to output growth is significantly negative, labour`s contribution explains most of the changes in output growth in Turkish Manufacturing Industry. Raw labour`s contribution (RLC) to growth is negative whereas human capital`s (HCC) contribution to growth is found to be positive, and this explains most of the contribution of labour. Half of the public sector and all of the private sector have positive rates of TFP growth until 1994, the year of economic and financial crisis. Since then, all the public and private sectors industries considered in our study show negative TFP growth rates. This study argues that measuring growth at the disaggregated level helps to understand growth at the aggregate level in a better way.
Keywords: Growth, TFP growth, manufacturing industry, public and private
1. Introduction
Scarcity of resources is one of the main reasons to produce under efficient and productive production processes in order to get the highest possible volume of output. Researchers often find that productive production process is the result of the growth of total factor productivity (TFP). And the two-way causality between TFP growth and output growth has been proved, among others, by Harberger (1997, 1998). Obtaining a stable and sustainable economic growth has been one of the main macroeconomic challenges of ruling agents in every typical economy. Therefore, the sources and the outcomes of economic growth has been researched and analyzed by economists. The empirical findings of their studies have shown that there is a variety of sources of economic growth such as productivity growth, increases in human capital, advances in information and communication technologies (ICT) (Notaro, 2003), economic policy, technological advances and so on.
*
Several contemporary authors who have studied sources of output growth have concluded that if output growth is different than the sum of labor and capital’s contributions to output growth, the difference is attributed to the residual or total factor productivity (TFP) ( Cho, 2000). TFP growth enables firms to create competitive capability which is a special advantage. As is mentioned in our survey of recent empirical studies, TFP growth and cost reduction in production process happen at the same time. Hence, reduced cost in production process leads to a strong competitive power (Kim, 2001).
The aim of this study is to investigate the sources of growth in Turkish Manufacturing Industry between the years 1990 and 2000. Labor, capital and TFP are regarded as the three main elements of the sources of growth in empirical studies. In our study, their contributions to growth are going to be examined separately for public and private manufacturing sectors. Thus, a comparison of production efficiencies in the public and private manufacturing sectors would be possible. With this aim, eight main subsidiary industries are selected within for our study. The study takes into consideration the effects of 1994 and 1999 financial crises on the growth process. Since the financial crises adversely affected all the economic activities, their effects can be seen in several ways such as decline in output growth, capacity usage and TFP growth. This study examine two five-year periods (1990-1994 and 1995-2000) to see the effects of these crises on Turkish manufacturing industry.
There are basely two sets of approaches to measure the sources of growth. The first one is “Parametric Approach”, which can be decomposed into deterministic and stochastic approaches. The second one is
“Non-Parametric Approach”, which covers four different methodologies: The first
method, Data Envelopment Analysis (DEA), was developed by Tim Coelli (1998) to measure efficiency in service sector (Gorton and Davidova, 2002). The second method, Traditional Growth Accounting Approach (Neo-Classical;
Tinbergen 1942; Kendrick, 1956; Solow, 1957) makes no distinction between
quantities and qualities of inputs. However, though many studies consider “residual” as a measure of TPF, one need to be cautious about the fact that it contains the traces of influence of capital and labor. Therefore, changes in the quality of inputs are included as a part of TFP. The main assumption of TPF method is constant returns to scale (CRTS) in the production process. Hence, the sum of shares of inputs in total output is 1 (Sarel, 1997). The third method,
Extended Traditional Approach (New Neo-Classical or Endogenous Growth Theory; Edward F. Denison, 1961; Gollop and Jorgenson, 1980), is based on
growth accounting approach; but it adds the inputs on the basis of their classes. National accounts data are disaggregated into several classes of labor and
Sources of Growth
capital, and aggregate index of productivity is constructed by using estimates of sectoral rates of productivity growth. This methodology requires different deflators for every kind of output and input. The contributions of inputs are obtained by weighting the input growth rates by the corresponding average cost shares of them in the value of output. In the growth accounting method, the shares of all input add-up to 1 (Robles, 1997; Akdede, 2001; Mukherjee and Kuroda, 2002; Gerdin, 2000; Gorton and Davidova, 2002; Bessen, 2001). This methodology is known as Jorgenson`s method, because he developed the index using Malmquist and Tornqvist- Theil productivity indices (Gorton and Davidova, 2002). These indices allow the consideration of detailed data on inputs and outputs. But their statistical consistency can not be properly ascertained. However, they are easy to apply generally to small samples of transitionary economies.
Except the ones which Jorgenson`s method is applied, growth accounting methodologies however, use highly aggregated data to examine the sources of growth. Of course measuring aggregate productivity is important, but one should never forget that measuring productivity across firms or and/or industries gives more reliable results compared with the measurement of productivity at the aggregate level. As Mansung Michael Cho (2000) explained in his dissertation clearly that “the act of aggregation itself introduces many biases and complications”.
Finally, the fourth method 2-Deflator Growth Accounting Approach
(Harberger, 1997, 1998) is applied to this study. This method works with value
added as final output. It has several advantages over the Growth Accounting approaches. It does not require an assumption of a production function or estimation through the method of regression. It is much less data intensive than the method used by Jorgenson. No assumptions are required about a production function. Growth accounting methods use aggregated values to explain economic growth. Therefore, they may fail to explain growth at the firm or industry level where all of the growth really takes place (Cepeda, 2000).
In the 2-Deflator method first deflator is taken as GDP deflator or CPI to express all nominal variables in real terms. The second deflator is standard (or basic) real wage (Wt*), which is the real wage of relatively unskilled worker (standard labor unit Lt*) calculated by taking 2/3 of real GDP per capita for each year covered by this study in order to identify a portion of the total wage bill in the industry as a payment to the human capital. Thus, human capital contribution in total labor contribution to growth can be measured separately (Kim, 2001). In 2-Deflator methodology, Harberger (1997, 1998) also proposed
a new method called “Sunrise-Sunset Productivity Diagram” to visualize the distribution of productivity growth across industries.
Following the 2-Deflator Growth accounting method, this study examines the sources of growth at disaggregated sectoral level for the selected public and private manufacturing sectors. Similarly, the empirical results of our study using 2-Deflator method have shown that productivity growth is not evenly distributed across industries. Our study finds that some sectors are more productive than others, and some other sectors may have negative TFP growth. Private sector has been found to be more productive than public sector.
This study is organized as follows: Section 2 presents the methodology (2-Deflator Growth Accounting Methodology), Section 3 provides information about the data, Section 4 reports empirical findings and a few concluding observations are given in Section 5.
2. Methodology
2.1 Two-Deflator Growth Accounting
2-Deflator Growth Accounting Method begins with the assumption of zero profit condition:
Y= wL+ (ρ+δ) K (2.1)
Where:
Y= Output (Value Added) L= Labor (Units)
K= Capital Stock w= Wages
ρ= Rate of return to capital δ= Rate of depreciation of capital
Taking the total differentiation of the equation 2.1:
∆Y= (w∆L+ L∆w) + {(ρ+δ) ∆K + K∆ (ρ+δ )} (2.2)
∆Y- w∆L- (ρ+δ) ∆K= L∆w+ K∆ (ρ+δ ) (2.3)
Equation (2.3) represents the duality between output maximization (primal) at the left-hand-side and cost minimization (dual) at the right-hand-side. If, ∆Y> w∆L+ (ρ+δ) ∆K, the difference (residual) becomes total factor productivity (TFP).
Sources of Growth
TFP= ∆Y- w∆L- (ρ+δ) ∆K (2.4)
Then, by dividing equation (2.4) by output Y, TFP growth rate (∂ TFP) can be calculated: as:
∂ TFP= TFP/Y= ∆Y/Y- w∆L/Y- (ρ+δ) ∆K/Y (2.5)
∂ TFP= ∂Y- w∂L- (ρ+δ) ∂K (Primal, Output Maximization) (2.6) ∂ TFP= L∂Y+ K∂ (ρ+δ) (Dual, Cost Minimization) (2.7) The difference between this method and the traditional methods is the use of two deflators: The GDP deflator Pt* (GDP deflator was calculated by using 1994 prices in this study) is a deflator for prices, and the real wages of a “standard labor” Wt* as a deflator for labor. (Wt* was taken as 2/3 of real GDP per capita in Harberger`s methodology (1997, 1998)). All data in nominal values are converted into real values by using the GDP deflator. Therefore, both the nominal values of output (Yt) and capital (Kt) are converted into real terms using the GDP deflator:
(Yi,t*)= (Yi,t/Pt*)*100 (2.8)
(Ki,k,t*)= ∑ (Ki,k,t/Pt*)*100 (2.9)
where “i” represents different industrial sectors and “k” for different types of capital.
Since all capital and output are measured in a single numeraire, aggregation to the entire economy becomes easy and this common numeraire between capital and output allows for a meaningful formulation of the rate of return to capital (Robles, 1997). Real annual wages of a “standard labor, Lt*” is used to quantify labor inputs in terms of standard (unskilled) labor units.
(Li,t*)= ∑l ((Wi,l,t) (Li,l,t))/Wt*= (wage bill)i,t/Wt* (2.10) where:
l= different types of workers i= different industrial sectors
When real depreciation of capital is known, economic rate of return for each industrial sector can be measured as:
(Pi,t*)={(Yi,t*)-∑l ((Wi,l,t*) (Li,l,t*))- ∑k (0.05*(Ki,k,t*))}/∑k (Ki,k,t*) (2.11)
Therefore, the TFP growth rate (∂ TFP) for each industrial sector can be calculated as:
(∂ TFPi,t*)= {(Yi,t*)- (Yi,t-1*)}/(Yi,t-1*) Output Growth (∂Yt*) (2.12)
-∑l(Wt-1*) ((Li,l,t*)-(Li,l,t-1*))/(Yi,t-1*) Labor Contribution to Growth(LC)
-∑k ((ρi,t-1*)+ δi,k) ((Ki,k,t*)- (Ki,k,t-1*))/(Yi,t-1*) Capital Cont.
to growth (KC)
The aggregate TFP growth rate for an economy consisting of N industries can be formulated as follows:
N
(∂ TFPt*)= ∑i=1 {((Yi,t*)/(Yt*) (∂ TFPi,t*)}
(2.13)
where:
(Yi,t*)/(Yt*)= weighted share of total output for each industrial sector {((Yi,t*)/(Yt*)) (∂ TFPi,t*)}= TFP contribution of each industry to total output.
N
∑i=1 {((Yi,t*)/(Yt*) (∂ TFPi,t*)}= Cumulative share of TFP contribution to output growth
N
∑i=1 ((Yi,t*)/(Yt*)) = Cumulative share of total output for each industrial sector
A common numeraire is used to deflate both output and capital. The level of aggregation can be for the entire economy or certain parts of the economy, and it does not per se create any problem. Aggregate trend of TFP growth has been shown by applying Sunrise-Sunset Diagram: First, the selected manufacturing industries are sorted in a descending order by their TFP growth rates. Then the results obtained by using the equation ∑i=1 ((Yi,t*)/(Yt*)) are put to the x-axis and the results obtained by using the equation ∑i=1 {((Yi,t*)/(Yt*)(∂ TFPi,t*)} are put to the y-axis.
2. 2. Distinction between the Raw Labor Contribution (RLC) and the Human Capital Contribution (HCC) to Growth
Another advantage of using 2-Deflator method is that it makes possible to decompose labor’s contribution to growth (LC) into raw labor (RLC) and human capital contribution to growth (HCC). Then, human capital’s
Sources of Growth
contribution to growth can be further decomposed into maintenance (MHC) and quality improvement of human capital (QIHC) components (Cho, 2000). Information on wage bill for each sector is enough to get these measurements. As discussed earlier, (Li,t*) represents the standard labor unit with least human capital (i.e. unskilled worker) and the marginal product from the human capital can be measured as (Wi,t-(Wt*)) (Pattnayak, 2001). Therefore, the value of the marginal product of the raw labor is decomposed into two components:
Wi,t= (Wt*)+ (Wi,t-(Wt*)) (2.14)
Where:
Wt*= value of the marginal product of raw labour
Wi,t-(Wt*)= value of the marginal product of the human capital For the industry:
(Wi,t) (Li,t)= Wt* (Li,t)+ (Wi,t-Wt*) (Li,t)= Wt*(Li,t)+ Wt*((Li,t*)- (Li,t)) (2.15)
The first component represents the total value of raw labor`s contribution to growth and the second component represents the total value of human capital’s contribution to growth. Taking the differential of the above equation,converts it into the growth accounting. Labor`s contribution to growth (LC) (Wt* ∆Li,t*) can be decomposed into the raw labor`s contribution to growth (RLC) (Wt*∆Li,t) and human capital`s contribution to growth (HCC) (Wt*( ∆Li,t*- ∆Li,t).
Wt* ∆Li,t*= Wt*∆Li,t + (Wt*( ∆Li,t*- ∆Li,t)) (2.16) As explained above, human capital`s contribution to growth (HCC) can also be decomposed into two components:
(Wt*(∆Li,t*-∆Li,t))= {(Wi,t-Wt*)∆Li,t}+ {Wt*∆Li,t*- (Wi,t)∆Li,t} (2.17)
where:
{(Wi,t-Wt*)∆Li,t}= the formula for maintenance component (MHC) {Wt*∆Li,t*- (Wi,t)∆Li,t}= the formula for quality improvement human capital component (QIHC)
In terms of growth accounting, labor contribution to growth (LC= RLC+HCC):
LC= (Wt-1*(∆Li,t*))/(Yi,t-1*)
RLC= ((Wt-1*(Li,t-1*)/(Yi,t-1*)) (∆Li,t/Li,t-1)
HCC= ((Wt-1*(Li,t-1*)/(Yi,t-1*)) ((Li,t*/Li,t-1*)- (∆Li,t/li,t-1))
Finally, human capital’s contribution to growth is decomposed into two (HCC= MHC+ QIHC):
Where:
MHC= ((Wi,t-Wi,t*)(∆Li,t/Li,t-1))/(Yi,t-1*)
QIHC= ((Wi,t-1*/Yi,t-1*) ((∆Li,t*/Li,t-1*)- (∆Li,t/Li,t-1))
In traditional methods, human capital’s contribution to growth is not separately estimated. The application of a 2-Deflator method gives an advantage to see the effects of raw labor and human capital’s contribution to growth separately (Robles, 2000).
3. Data
Main source of the data (3-digit manufacturing sectors) used in this study is “Statistical Year Book of Turkey” covering the years between 1990 and 2000. The book is issued by the State Institute of Statistics (SIS) of Turkey.
Following variables are used to calculate TFP growth in selected eight main sub-sectors in manufacturing industry in Turkey:
Capital stock: is available as the net change in stock of raw materials, fuel, intermediate inputs and furniture in the data source.
Gross Value Added: for aggregate economy and for
manufacturing industry.
Gross wage bill for manufacturing industry and for its sectors.
The basic wage (Wt*) =similar to Harberger`s method (1997,
1998) it is taken as 2/3 of real GDP per capita (1994 prices).
Labor = number of workers in total industry and in its sectors.
Depreciation rate of capital
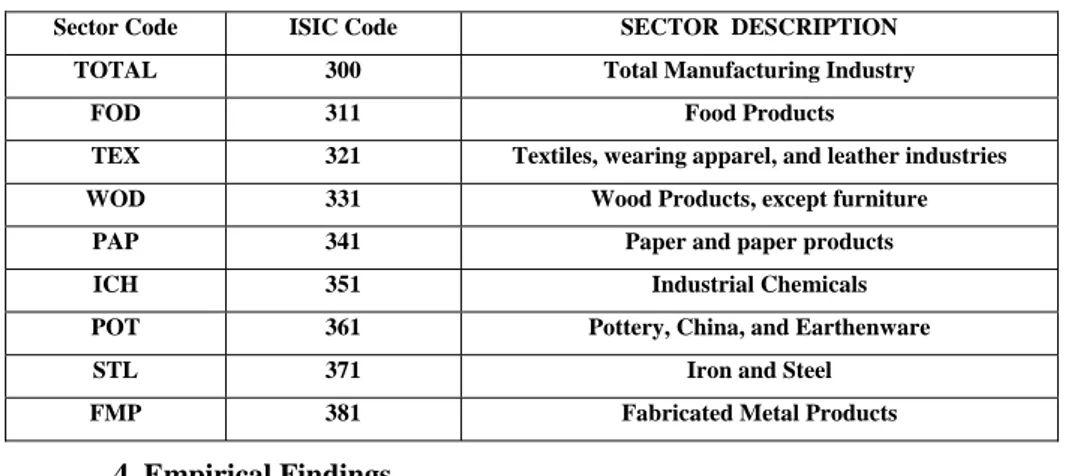
Selected eight three-digit manufacturing sectors for this study are given in Table 1.
Sources of Growth
Table 1: Selected Manufacturing Sectors used in this study
Sector Code ISIC Code SECTOR DESCRIPTION
TOTAL 300 Total Manufacturing Industry
FOD 311 Food Products
TEX 321 Textiles, wearing apparel, and leather industries
WOD 331 Wood Products, except furniture
PAP 341 Paper and paper products
ICH 351 Industrial Chemicals
POT 361 Pottery, China, and Earthenware
STL 371 Iron and Steel
FMP 381 Fabricated Metal Products
4. Empirical Findings 4. 1. General Findings
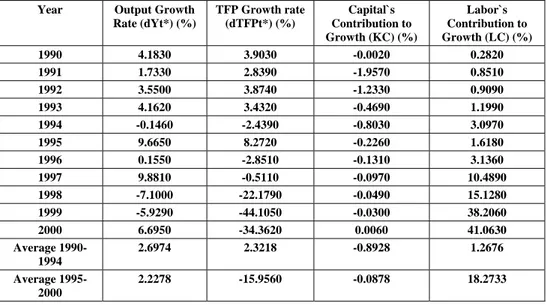
Contributions of capital and labor to growth and TFP growth rates for Turkish Manufacturing Industry from 1990 to 2000 are given in Table 2. During the 1990-1994 periods manufacturing industry output (real value added) grew at an average rate of about 2.7 per cent per year. The highest output growth occurred by 4.2 per cent and 4.17 per cent at the years 1990 and 1993 respectively. At the second five year period (1995-2000) the highest output growth is about 9.67 per cent at 1995 and 9.88 percent at 1997. The average output growth is 2.23 per cent during the same period.
Yakup Kepenek distinguished five sub-groups of manufacturing sectors, namely the resource intensive, labor intensive, scale intensive,
differentiated products, science based commodities. Therefore, in this study,
selected eight manufacturing sectors can be categorized as follows: food products (311), wood products except furniture (331), pottery, china, and earthenware (361), and textiles wearing apparel and leather industries (321) are resource and labor intensive; paper and paper products (341), industrial chemicals (351), iron and steel (371) are scale intensive products; finally fabricated metal products (381) are differentiated commodities.
With the light of above explanation this can be said that none of the selected eight manufacturing industries are capital intensive. Moreover, one of the bad effects of 1994 and 1999 economic and financial crises is decline in capital investments. Since, capital is taken as the net change in stock of raw materials, fuel, intermediate inputs and furniture representing the net investment
in this study, naturally its contribution to growth becomes negative. On the other hand, during the same period human capital has increased. Hence, its contribution to growth is significantly positive throughout the period.
Table 2: Aggregate Growth Rates for Manufacturing Industry at the 1990-2000 period
Year Output Growth
Rate (dYt*) (%) TFP Growth rate (dTFPt*) (%) Capital`s Contribution to Growth (KC) (%) Labor`s Contribution to Growth (LC) (%) 1990 4.1830 3.9030 -0.0020 0.2820 1991 1.7330 2.8390 -1.9570 0.8510 1992 3.5500 3.8740 -1.2330 0.9090 1993 4.1620 3.4320 -0.4690 1.1990 1994 -0.1460 -2.4390 -0.8030 3.0970 1995 9.6650 8.2720 -0.2260 1.6180 1996 0.1550 -2.8510 -0.1310 3.1360 1997 9.8810 -0.5110 -0.0970 10.4890 1998 -7.1000 -22.1790 -0.0490 15.1280 1999 -5.9290 -44.1050 -0.0300 38.2060 2000 6.6950 -34.3620 0.0060 41.0630 Average 1990-1994 2.6974 2.3218 -0.8928 1.2676 Average 1995-2000 2.2278 -15.9560 -0.0878 18.2733
Throughout the two five-year periods (1990-1994 and 1995-2000) capital contributed negatively to output growth by the average rates of -0.89 per cent and -0.088 per cent in the years between 1990-1994 and 1995-2000 respectively. On the other hand, labor contribution to output growth is all positive and most significant during the whole period (1990-2000). The average labor contribution to growth is occurred by 1.27 per cent in the first five year period and 18.27 per cent in the second five year period. The remaining 2.32 per cent and -15.96 per cent during the same sub-periods are attributed to TFP growth.
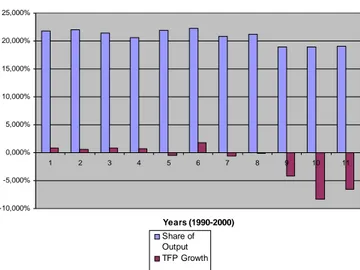
Figure 1 shows the relationship between the industry output shares (value added) in GDP and TFP growth rates during the 1990-2000 period. As it can be clearly seen in the figure, manufacturing industry output share starts declining when TFP growth rates are highly negative in the years 1998, 1999, and 2000.
Sources of Growth
Figure 1: Manufacturing Industry Output Share and TFP Growth (1990-2000)
4.2. Variations in Productivity across Eight Public and Private Manufacturing Sectors
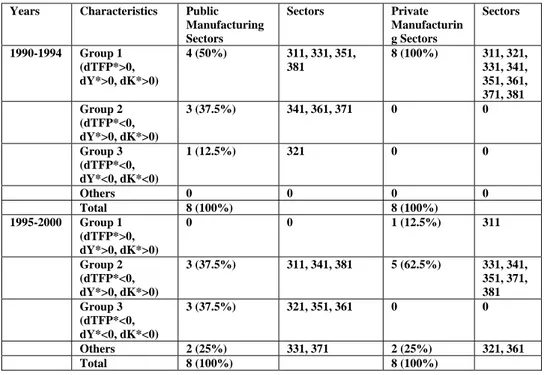
Table 3 shows the characteristics of growth components of selected public and private manufacturing sectors at two five-year periods. The annual growth components of selected eight public and private manufacturing sectors are classified according to the characteristics of three growth components ∂TFP*, ∂Y*, ∂K*. The sectors with positive growth rates are collected under
Group 1, which contains the cases in which TFP growth rates (∂TFP*), the growth rate of net investment (∂K*) and output growth rate (∂Y*) are positive.
Group 2 contains the cases of negative TFP growth (∂TFP*), and positive growth rates of net investment (∂K*) and output (∂Y*), and Group 3 includes negative growth rates for all components (∂Y*, ∂K*, ∂TFP*).
-10,000% -5,000% 0,000% 5,000% 10,000% 15,000% 20,000% 25,000% 1 2 3 4 5 6 7 8 9 10 11 Years (1990-2000) Share of Output TFP Growth
Table 3: Characteristics of Growth Components
Years Characteristics Public
Manufacturing Sectors Sectors Private Manufacturin g Sectors Sectors 1990-1994 Group 1 (dTFP*>0, dY*>0, dK*>0) 4 (50%) 311, 331, 351, 381 8 (100%) 311, 321, 331, 341, 351, 361, 371, 381 Group 2 (dTFP*<0, dY*>0, dK*>0) 3 (37.5%) 341, 361, 371 0 0 Group 3 (dTFP*<0, dY*<0, dK*<0) 1 (12.5%) 321 0 0 Others 0 0 0 0 Total 8 (100%) 8 (100%) 1995-2000 Group 1 (dTFP*>0, dY*>0, dK*>0) 0 0 1 (12.5%) 311 Group 2 (dTFP*<0, dY*>0, dK*>0) 3 (37.5%) 311, 341, 381 5 (62.5%) 331, 341, 351, 371, 381 Group 3 (dTFP*<0, dY*<0, dK*<0) 3 (37.5%) 321, 351, 361 0 0 Others 2 (25%) 331, 371 2 (25%) 321, 361 Total 8 (100%) 8 (100%)
Note: 1) Number in parenthesis is the percentage ratio to all the observations.
2) Figures are the number of observations with Specified Characteristics based on Annual Data.
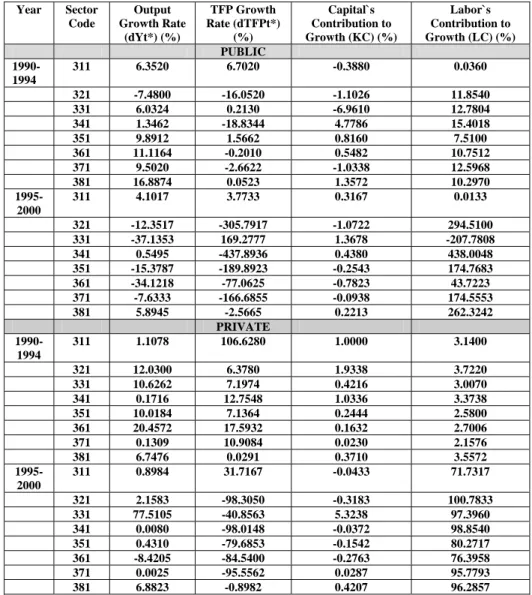
Table 4 summarizes average growth rates for selected public and private manufacturing sectors during the 1990-1994 and 1995-2000 periods. The major sources of economic growth differ for different sectors. For example, growth components are all positive at food products (311) sector for both public and private establishments. Labor’s contribution plays an important role in all public and private sectors while capital’s contribution is significantly negative. TFP growth is positive and plays the most significant role at all private sectors during first five year period. After 1994, TFP growth was negative at all private industries except the food products (311) sector. Food products (311), wood products, except furniture (331), industrial chemicals (351), and fabricated metal products (381) in the public sector have positive TFP growth in the first five-year period (1990-1994). But in the second five-year period, only public establishments, which are food products (311) and wood products, except furniture (331) showed positive TFP growth rate.
Sources of Growth
Table 4: Average Growth Rates for Selected Public and Private Manufacturing Sectors Year Sector Code Output Growth Rate (dYt*) (%) TFP Growth Rate (dTFPt*) (%) Capital`s Contribution to Growth (KC) (%) Labor`s Contribution to Growth (LC) (%) PUBLIC 1990-1994 311 6.3520 6.7020 -0.3880 0.0360 321 -7.4800 -16.0520 -1.1026 11.8540 331 6.0324 0.2130 -6.9610 12.7804 341 1.3462 -18.8344 4.7786 15.4018 351 9.8912 1.5662 0.8160 7.5100 361 11.1164 -0.2010 0.5482 10.7512 371 9.5020 -2.6622 -1.0338 12.5968 381 16.8874 0.0523 1.3572 10.2970 1995-2000 311 4.1017 3.7733 0.3167 0.0133 321 -12.3517 -305.7917 -1.0722 294.5100 331 -37.1353 169.2777 1.3678 -207.7808 341 0.5495 -437.8936 0.4380 438.0048 351 -15.3787 -189.8923 -0.2543 174.7683 361 -34.1218 -77.0625 -0.7823 43.7223 371 -7.6333 -166.6855 -0.0938 174.5553 381 5.8945 -2.5665 0.2213 262.3242 PRIVATE 1990-1994 311 1.1078 106.6280 1.0000 3.1400 321 12.0300 6.3780 1.9338 3.7220 331 10.6262 7.1974 0.4216 3.0070 341 0.1716 12.7548 1.0336 3.3738 351 10.0184 7.1364 0.2444 2.5800 361 20.4572 17.5932 0.1632 2.7006 371 0.1309 10.9084 0.0230 2.1576 381 6.7476 0.0291 0.3710 3.5572 1995-2000 311 0.8984 31.7167 -0.0433 71.7317 321 2.1583 -98.3050 -0.3183 100.7833 331 77.5105 -40.8563 5.3238 97.3960 341 0.0080 -98.0148 -0.0372 98.8540 351 0.4310 -79.6853 -0.1542 80.2717 361 -8.4205 -84.5400 -0.2763 76.3958 371 0.0025 -95.5562 0.0287 95.7793 381 6.8823 -0.8982 0.4207 96.2857
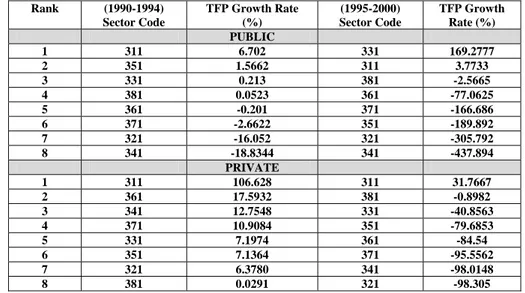
Table 5 presents the ranking from highest to lowest manufacturing sectors in terms of TFP growth rates at two five-year periods. Both public and private establishments of food products (311) sector is in the top of the first five-year period and private food product establishments are at the top in second-five year period. Moreover, Pottery, china, and earthenware (361); iron and steel (371); textiles, wearing apparel, and leather industries (321); and paper
and paper products (341) are the public establishments that have negative TFP growth when the same sectors of private establishments have positive TFP growths at the first five-year period.
Tables 4 and 5 imply that if economic growth is measured by using aggregate data, the growth components at firm, sector or industry level, where the actual growth process occurred may not be identified. Growth of firms, industries or sectors must be identified first before the growth of the entire economy is measured.
Table 5: Five Year Rankings of Selected Public and Private Manufacturing Sectors from Highest to Lowest TFP Growth Rates.
Rank (1990-1994) Sector Code TFP Growth Rate (%) (1995-2000) Sector Code TFP Growth Rate (%) PUBLIC 1 311 6.702 331 169.2777 2 351 1.5662 311 3.7733 3 331 0.213 381 -2.5665 4 381 0.0523 361 -77.0625 5 361 -0.201 371 -166.686 6 371 -2.6622 351 -189.892 7 321 -16.052 321 -305.792 8 341 -18.8344 341 -437.894 PRIVATE 1 311 106.628 311 31.7667 2 361 17.5932 381 -0.8982 3 341 12.7548 331 -40.8563 4 371 10.9084 351 -79.6853 5 331 7.1974 361 -84.54 6 351 7.1364 371 -95.5562 7 321 6.3780 341 -98.0148 8 381 0.0291 321 -98.305
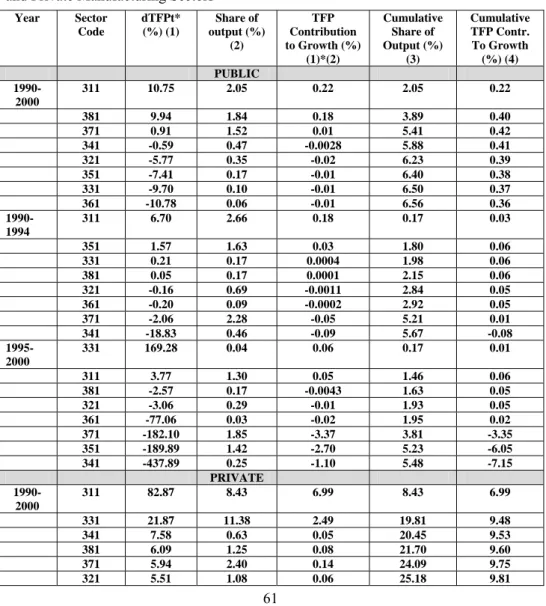
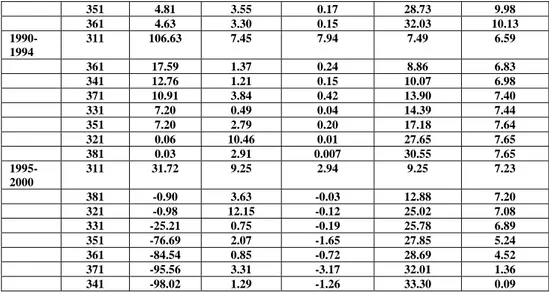
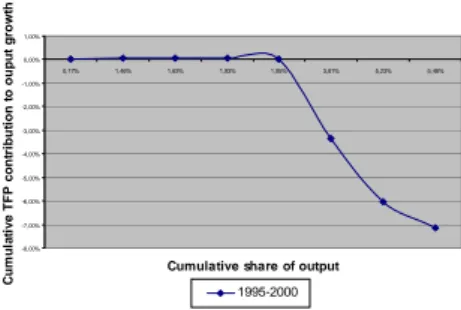
Table 6 summarizes the TFP contribution for the selected public and private sectors. This table is useful to construct the Sunrise-Sunset Diagrams presented in figures 2 and 3. First public and private manufacturing sectors are sorted by TFP growth rates, which are averaged for the periods 1990-2000; 1990-1994 and 1995-2000 in a descending order. For each industry, TFP`s contribution to growth is calculated by multiplying the TFP growth rate by the sector`s share of output. Then TFP`s contribution to growth across sectors is summed up and cumulative contribution to output growth is shown in the last column.
The Sunrise-Sunset Productivity Diagrams are drawn by using the last two columns of Table 6. The magnitudes and distribution of sector TFP growth rates determine the shape of the Sunrise-Sunset diagram. The rising slope of the curve shows the positive TFP contributions of sectors to output growth while
Sources of Growth
the decreasing slope of the diagram represents the negative TFP contributions of sectors. The highest TFP contribution to growth for public manufacturing sectors is 0.42 per cent and 10.13 per cent for private manufacturing sectors. These are the highest TFP growth rates if we remove the negatively contributed sectors from the economy. The Sunrise-Sunset diagram may be in different shapes as can be seen in Figures 2 and 3. The distribution of productivity across the economy gives us a good idea about the efficiency of the economy.
Table 6: TFP Contribution to Growth and Share of Output in Selected Public and Private Manufacturing Sectors
Year Sector Code dTFPt* (%) (1) Share of output (%) (2) TFP Contribution to Growth (%) (1)*(2) Cumulative Share of Output (%) (3) Cumulative TFP Contr. To Growth (%) (4) PUBLIC 1990-2000 311 10.75 2.05 0.22 2.05 0.22 381 9.94 1.84 0.18 3.89 0.40 371 0.91 1.52 0.01 5.41 0.42 341 -0.59 0.47 -0.0028 5.88 0.41 321 -5.77 0.35 -0.02 6.23 0.39 351 -7.41 0.17 -0.01 6.40 0.38 331 -9.70 0.10 -0.01 6.50 0.37 361 -10.78 0.06 -0.01 6.56 0.36 1990-1994 311 6.70 2.66 0.18 0.17 0.03 351 1.57 1.63 0.03 1.80 0.06 331 0.21 0.17 0.0004 1.98 0.06 381 0.05 0.17 0.0001 2.15 0.06 321 -0.16 0.69 -0.0011 2.84 0.05 361 -0.20 0.09 -0.0002 2.92 0.05 371 -2.06 2.28 -0.05 5.21 0.01 341 -18.83 0.46 -0.09 5.67 -0.08 1995-2000 331 169.28 0.04 0.06 0.17 0.01 311 3.77 1.30 0.05 1.46 0.06 381 -2.57 0.17 -0.0043 1.63 0.05 321 -3.06 0.29 -0.01 1.93 0.05 361 -77.06 0.03 -0.02 1.95 0.02 371 -182.10 1.85 -3.37 3.81 -3.35 351 -189.89 1.42 -2.70 5.23 -6.05 341 -437.89 0.25 -1.10 5.48 -7.15 PRIVATE 1990-2000 311 82.87 8.43 6.99 8.43 6.99 331 21.87 11.38 2.49 19.81 9.48 341 7.58 0.63 0.05 20.45 9.53 381 6.09 1.25 0.08 21.70 9.60 371 5.94 2.40 0.14 24.09 9.75
351 4.81 3.55 0.17 28.73 9.98 361 4.63 3.30 0.15 32.03 10.13 1990-1994 311 106.63 7.45 7.94 7.49 6.59 361 17.59 1.37 0.24 8.86 6.83 341 12.76 1.21 0.15 10.07 6.98 371 10.91 3.84 0.42 13.90 7.40 331 7.20 0.49 0.04 14.39 7.44 351 7.20 2.79 0.20 17.18 7.64 321 0.06 10.46 0.01 27.65 7.65 381 0.03 2.91 0.007 30.55 7.65 1995-2000 311 31.72 9.25 2.94 9.25 7.23 381 -0.90 3.63 -0.03 12.88 7.20 321 -0.98 12.15 -0.12 25.02 7.08 331 -25.21 0.75 -0.19 25.78 6.89 351 -76.69 2.07 -1.65 27.85 5.24 361 -84.54 0.85 -0.72 28.69 4.52 371 -95.56 3.31 -3.17 32.01 1.36 341 -98.02 1.29 -1.26 33.30 0.09
Figure 2: TFP Sunrise-Sunset Diagram for Selected Public Manufacturing Sectors (1990-2000; 1990-1994; 1995-2000)
0,00% 0,05% 0,10% 0,15% 0,20% 0,25% 0,30% 0,35% 0,40% 0,45% 0,00% 1,00% 2,00% 3,00% 4,00% 5,00% 6,00% 7,00%
Cumulativ e Share of Output
C um ul a ti v e TFP c o nt ri but ion t o gr ow th 1990-2000 -0,10% -0,08% -0,06% -0,04% -0,02% 0,00% 0,02% 0,04% 0,06% 0,08% 0,00% 1,00% 2,00% 3,00% 4,00% 5,00% 6,00%
Cum ulative share of output
C u m ul a ti v e T FP c ont ri but io n t o out p ut gr ow th 1990-1994
Sources of Growth
Figure 3: TFP Sunrise/Sunset Diagram for Selected Private Manufacturing Sectors (1990-2000; 1990-1994; 1995-2000)
-8,00% -7,00% -6,00% -5,00% -4,00% -3,00% -2,00% -1,00% 0,00% 1,00% 0,17% 1,46% 1,63% 1,93% 1,95% 3,81% 5,23% 5,48%
Cumulative share of output
C um u la ti v e T FP c o nt ri but ion to oup ut g row th 1995-2000 0,00% 2,00% 4,00% 6,00% 8,00% 10,00% 12,00% 0,00% 5,00% 10,00% 15,00% 20,00% 25,00% 30,00% 35,00%
Cumulative Share of Output
C um ul a ti v e TFP c ont ri but ion t o O ut put G row th 1990-2000 0,00% 1,00% 2,00% 3,00% 4,00% 5,00% 6,00% 7,00% 8,00% 0,00% 5,00% 10,00% 15,00% 20,00% 25,00% 30,00% 35,00% Cumulative share of output
C um ul ati v e TFP c ont ri but ion t o out put gr ow th 1995-2000 6,40% 6,60% 6,80% 7,00% 7,20% 7,40% 7,60% 7,80% 0,00% 5,00% 10,00% 15,00% 20,00% 25,00% 30,00% 35,00% Cumulativ e share of output
C um u la ti ve T FP c ont ri but io n t o ou tput gr ow th 1990-1994
4.3. Human Capital`s Contribution to Economic Growth
As was explained earlier, the 2-Deflator Method is useful to decompose labor`s contribution to economic growth.
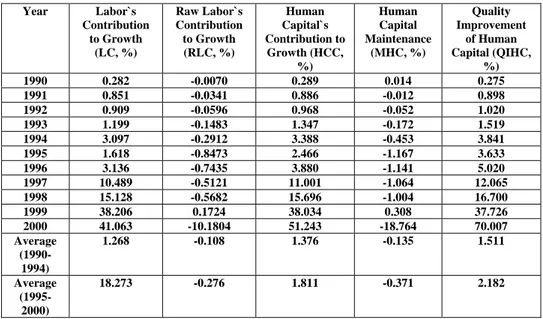
Table 7: The Components of Labor Contribution to Output Growth in Manufacturing Industry. Year Labor`s Contribution to Growth (LC, %) Raw Labor`s Contribution to Growth (RLC, %) Human Capital`s Contribution to Growth (HCC, %) Human Capital Maintenance (MHC, %) Quality Improvement of Human Capital (QIHC, %) 1990 0.282 -0.0070 0.289 0.014 0.275 1991 0.851 -0.0341 0.886 -0.012 0.898 1992 0.909 -0.0596 0.968 -0.052 1.020 1993 1.199 -0.1483 1.347 -0.172 1.519 1994 3.097 -0.2912 3.388 -0.453 3.841 1995 1.618 -0.8473 2.466 -1.167 3.633 1996 3.136 -0.7435 3.880 -1.141 5.020 1997 10.489 -0.5121 11.001 -1.064 12.065 1998 15.128 -0.5682 15.696 -1.004 16.700 1999 38.206 0.1724 38.034 0.308 37.726 2000 41.063 -10.1804 51.243 -18.764 70.007 Average (1990-1994) 1.268 -0.108 1.376 -0.135 1.511 Average (1995-2000) 18.273 -0.276 1.811 -0.371 2.182
Table 7 represents the decomposition of labor`s contribution to output growth. Throughout the period under study (1990-2000), raw labor`s contribution (RLC) to growth is negative and human capital`s contribution (HCC) to growth explains most of the contribution of labor. Furthermore, most of the human capital`s contribution to growth comes from the quality improvement of human capital (QIHC) component. As it is seen in Table 7, while the raw labor`s contribution remains negative, the quality of workers or human capital of workers has increased.
Table 8 summarizes the components of labor contributions to growth for public and private sectors at the two year periods. At the second five-year period, human capital`s contribution to growth increased in a big way. Throughout the periods quality improvement of human capital explains its contribution to growth. Figures 4 and 5 present the components of labor and human capital`s contributions to growth.
Sources of Growth
Table 8: The Components of Labor Contribution to Growth in Public and Private Manufacturing Sectors
Year Sector Code Labor`s Contribution to Growth (LC, %) Raw Labor`s Contribution to Growth (RLC, %) Human Capital`s Contribution to Growth (HCC, %) Human Capital Maintenance (MHC, %) Quality Improvement Human Capital (QIHC, %) PUBLIC 1990-1994 311 0.0360 -0.0165 0.0530 -0.2056 0.2200 321 11.8540 -1.7940 13.6560 -0.4840 14.1360 331 12.7804 -1.2332 14.0136 -0.3402 14.3536 341 15.4018 -0.8314 16.2332 -0.1748 16.4078 351 7.5100 -0.5440 8.0520 -0.3380 8.3900 361 10.7512 -1.1446 11.9140 0.0752 11.8388 371 12.5968 -0.9706 13.5712 -0.7040 14.2750 381 10.2970 0.5124 9.7844 0.5720 9.2124 1995-2000 311 0.0133 -0.0088 -0.0750 -7.1045 7.1333 321 294.5100 -93.4683 387.9800 -90.4033 478.3850 331 -207.7808 -520.9780 313.1970 -511.8740 830.0713 341 438.0048 -23.8668 461.8715 -22.6027 484.4743 351 174.7683 -13.1517 187.9183 -12.9417 200.8617 361 43.7223 -125.5465 169.2688 -121.2995 290.5685 371 174.5553 -18.6525 193.2080 -18.1578 211.3657 381 262.3242 7.5513 254.7727 7.1317 247.6410 PRIVATE 1990-1994 311 3.1400 0.1456 2.9940 0.0800 2.9000 321 3.7220 0.0936 3.6220 0.1600 3.4680 331 3.0070 -0.6312 3.6384 -0.0824 3.7750 341 3.3738 0.1766 3.1974 -0.0610 3.2584 351 2.5800 -0.2000 2.7780 -0.0080 2.7860 361 2.7006 0.2064 2.4944 -0.0302 2.5244 371 2.1576 -0.1382 2.2956 6.3556 7.2856 381 3.5572 0.0688 3.4882 -0.0474 3.5310 1995-2000 311 71.7317 0.1905 71.5405 0.00680 71.5337 321 100..7833 5.5817 95.1983 4.8217 90.3800 331 97.3960 34.6863 62.7095 30.4387 32.2708 341 98.8540 6.4223 92.4318 6.2268 86.2052 351 80.2717 0.9800 79.2900 0.9900 78.2983 361 76.3958 3.5087 72.8873 3.2785 69.6088 371 95.7793 1.8005 93.9788 1.5787 92.4003 381 96.2857 3.5867 92.5323 2.9962 89.7028
Figure 4: The Components of the Labor Contribution to Growth
Figure 5: Components of the Human Capital Contribution (HCC) to Growth
-20,000% -10,000% 0,000% 10,000% 20,000% 30,000% 40,000% 50,000% 60,000% 1 2 3 4 5 6 7 8 9 10 11 years (1990-2000) growth (%) LC RLC HCC -30,000% -20,000% -10,000% 0,000% 10,000% 20,000% 30,000% 40,000% 50,000% 60,000% 70,000% 80,000% 1 2 3 4 5 6 7 8 9 10 11 years (1990-2000) g ro w th (% ) HCC MHC QIHC
Sources of Growth 5. Conclusion
The sources of growth in Turkish Manufacturing Industry have been examined separately for eight selected public and private manufacturing sectors. The sources of growth vary across these manufacturing sectors. Labor’s contribution to output growth (LC) plays the most significant role both at the aggregate industry and sector levels. On the other hand, capital’s contribution to aggregate industry’s output growth (KC) is negative throughout the studied period, but it`s contribution to output growth in the private sector is positive during the first half of the period (1990-1994). During the same period, capital`s contribution to growth in public manufacturing sector was negative. One of the bad effects of 1994 crisis can be seen mostly in public manufacturing sector with respect to decline in output growth at the second half of the period (1995-2000).
One of the main differences between the previous empirical studies and the 2-Deflator method is that the latter method is able to decompose labor’s contribution to growth and analyze in detail by sectors. Throughout the studied period (1990-2000) raw labor’s contribution to manufacturing industry’s output growth (RLC) is negative; therefore, human capital’s contribution to output growth (HCC) explains most of the contribution of labor. Furthermore, main explanatory variable in human capital’s contribution to output growth (HCC) comes from the quality improvement of human capital (QIHC) component.
The present study has also shown that TFP growth rates across public and private sectors vary considerably. During the first half of the period (1990-1994), half of the public sector and all of the private sector had positive rates of TFP growth. TFP growth is mostly negative for both public and private sectors after 1994 economic crisis. The distributions of TFP growth rates across public and private sectors represented by the Sunrise-Sunset Diagrams vary across sectors and over time.
Previous empirical studies, which have applied the traditional growth accounting methods to find the sources of growth at the aggregate level, have often failed to explain growth at the firm, industry or sector level where the growth really takes place. Measuring growth at the disaggregated (firm, industry or sector) level help to measure and understand the growth at the aggregate level.
APPENDIX
Manufacturing Sectors in Statistical Year Book of Turkey
Sector Code ISIC Code SECTOR DESCRIPTION
FOD 311 Food Products
BEV 313 Beverages
TOB 314 Tobacco
TEX 321 Textiles, wearing apparel, and leather industries
APP 322 Wearing apparel, except foot wear
LEA 323 Leather Products
FOT 324 Footwear, except rubber or plastic
WOD 331 Wood Products, except furniture
FUR 332 Furniture, except metal
PAP 341 Paper and paper products
PRT 342 Printing and publishing
ICH 351 Industrial Chemicals
CHE 352 Other chemicals
PET 353 Petroleum Refineries
COL 354 Misc. Petroleum and Coal Products
RUB 355 Rubber Products
PLA 356 Plastic Products
POT 361 Pottery, China, and Earthenware
GLS 362 Glass and glass Products
NMM 369 Other Non-metallic Mineral Products
STL 371 Iron and Steel
NFM 372 Non-ferrous Metals
FMP 381 Fabricated Metal Products
MCH 382 Machinery, except electrical
EMC 383 Electrical Machinery
TRN 384 Transportation Equipment
SCI 385 Professional and Scientific Equipment
MOT 390 Other Manufactured Products
REFERENCES
AKDEDE, Sacit Hadi (2001), “Economic Liberalization, Markups and TFP Growth in Turkey`s Manufacturing Industries”, Adnan Menderes
University, Aydin, www.spo.gov.tr
CEPEDA, Leonardo Egidio Torre (2000), “Productivity, Profitability in the Mexican Manufacturing Sector: 1984-1994”, PhD. Dissertation, University of California, Los Angeles
Sources of Growth
CHO, Mansung Michael (2000), “Productivity, Profitability, and Economic Growth”, PhD. Dissertation, University of California, Los Angeles COELLI, T. J., PRASADA RAO, D. S., and BATTESE, G. E. (1998), “An
Introduction to Efficiency and Productivity Analysis”, Kluwer
Academic Publishers, Boston, pg. 271
GERDIN, Anders (2002), “Productivity and Economic Growth in Kenyan agriculture, 1964-1996”, Agricultural Economics, Vol.27, pg. 7-15 GORTON, Matthew, and DAVIDOVA, Sophia (2004), “Farm Productivity and
Efficiency in the CEE Applicant Countries: A Synthesis of Results”,
Agricultural Economics, Vol. 30, pg. 1-16
HARBERGER, Arnold C. (1997), (1998), “A Vision of the Growth Process”,
American Economic Review, 88 (1), pg. 1-32
KEPENEK, Yakup, “Some Technological Aspects of the Turkish Manufacturing Exports during the 1990s”,
www.intech.unu.edu/publications/conference-w
okshop-reports/seville/kepenek.pdf
KIM, Hyongwon (2001), “Growth Process based on the Behavior of Firms”,
PhD. Dissertation, University of California, Los Angeles
MUKHERJEE, Anit N., and KURODA, Yoshimi (2003), “Productivity Growth in Indian Agriculture: Is there Evidence of Convergence across States?” Agricultural Economics, Vol.29, 43-53
NOTARO, Giovanni (2003), “ICT, Output and Productivity Growth in the United Kingdom: A Sectoral Analysis”, International Productivity
Monotor, www.netaddress.com/tpl
PATTNAYAK, Sanja Samirana (2001), “Economic Liberalization and Productivity Growth: A Disaggregated Analysis of Indian
Manufacturing Industries”,
www.crnec.auckland.ac.nz/esam2001/prog/p78.html
ROBLES, Edgar (1997), “An Exploration into the Sources and Causes of Economic Growth in the United States and Fourteen Latin American Countries”, PhD. Dissertation, University of California, Los Angeles Statistical Year Book of Turkey, 1990-2000, State Institute of Statistics (SIS),