Strength and design of slotted and gusset plate welded tubular member connections in stainless steel
12
0
0
Tam metin
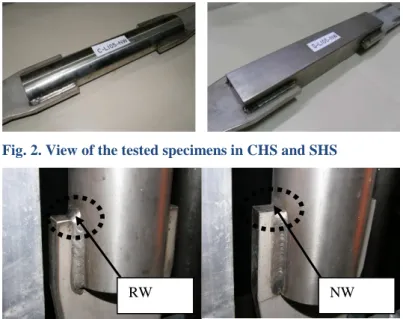
(2) w x. tp. B t. tp tsl. t Lw. H w x. tp. t. t. Lw. D. Fig. 1.. 2. tp tsl. Schematic view for the gusset plate welded slotted end connections for box and circular section members. Experimental Study. 2.1 Description of the tests and specimens The study focuses on the behaviour of slotted and gusset plate welded stainless steel tubular member connections subject to concentric axial loading. As stated earlier tests were carried out on 24 stainless steel CHS and SHS members with slotted gusset plate welded end connections. Fig. 2 shows photographs of two typical test specimens. Two parameters that were considered as variables in the test program were the fillet weld length Lw and the end condition of the welded gusset plate inside the slot being welded or non-welded around the end face of the gusset plate. These end conditions are shown in Fig. 3. The welded end is denoted as RW (return weld) and the non-welded end is denoted as NW (no return weld).. Fig. 2. View of the tested specimens in CHS and SHS. RW Fig. 3.. NW. View of the slot end conditions with / without a return weld. As shown in the photographs given in Figs. 2 and 3 rigid gusset plates with 15mm plate thickness were welded into the slots at both ends of the specimen. Tensile load was applied via these plates which were gripped inside the grip locations within the universal test machine with a total capacity of 50 tons. Loading was applied in the direction of the longitudinal axis of the member as concentric axial tensile load and specimen longitudinal elongation was monitored and recorded by using two displacement transducers attached to the sides of the specimen. Specimen dimensions are reported in Table 1. In the specimen reference, C stands for Circular and L defines the length of weld. x / Lw , Lw / w and Lw / D ratios are all called weld length ratios used in the design calculations as described above. Five different weld lengths were considered starting from 30mm up to 105 mm. For each cross-section type (CHS and SHS) 5 specimen were without a return weld (NW) and the other 5 with a return weld (RW) at the slotted end. For CHS sections a constant diameter of. Paper Presented by Dr. Güven Kiymaz - [email protected] © G. Kiymaz (Fatih University) & E. Seckin (Istanbul Kultur University). 2.
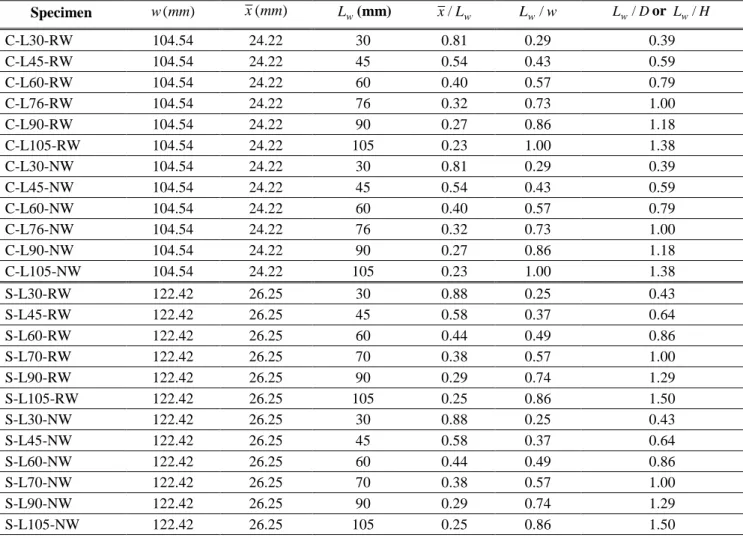
(3) D = 76.1mm and thickness of t = 2.0mm was used for all the specimens tested whereas the SHS sections were all 70mm x 70mm square sections with wall plate thickness of t = 2.0mm . Table 1 presents the dimensional properties for the 24 specimens tested in the test program. Note that the notations are described in Fig. 1. Within the specimen designation the C stands for Circular and S for Square. The following, e.g. L60RW corresponds to a longitudinal weld length of 60mm with a Return Weld at the end. A constant weld thickness of 6mm was considered in the production of the test specimens. Table 1. Dimensional properties of the test specimens. w (mm). x (mm). Lw (mm). x / Lw. Lw / w. Lw / D or Lw / H. C-L30-RW C-L45-RW C-L60-RW C-L76-RW C-L90-RW C-L105-RW C-L30-NW C-L45-NW C-L60-NW C-L76-NW C-L90-NW C-L105-NW. 104.54 104.54 104.54 104.54 104.54 104.54 104.54 104.54 104.54 104.54 104.54 104.54. 24.22 24.22 24.22 24.22 24.22 24.22 24.22 24.22 24.22 24.22 24.22 24.22. 30 45 60 76 90 105 30 45 60 76 90 105. 0.81 0.54 0.40 0.32 0.27 0.23 0.81 0.54 0.40 0.32 0.27 0.23. 0.29 0.43 0.57 0.73 0.86 1.00 0.29 0.43 0.57 0.73 0.86 1.00. 0.39 0.59 0.79 1.00 1.18 1.38 0.39 0.59 0.79 1.00 1.18 1.38. S-L30-RW S-L45-RW S-L60-RW S-L70-RW S-L90-RW S-L105-RW S-L30-NW S-L45-NW S-L60-NW S-L70-NW S-L90-NW S-L105-NW. 122.42 122.42 122.42 122.42 122.42 122.42 122.42 122.42 122.42 122.42 122.42 122.42. 26.25 26.25 26.25 26.25 26.25 26.25 26.25 26.25 26.25 26.25 26.25 26.25. 30 45 60 70 90 105 30 45 60 70 90 105. 0.88 0.58 0.44 0.38 0.29 0.25 0.88 0.58 0.44 0.38 0.29 0.25. 0.25 0.37 0.49 0.57 0.74 0.86 0.25 0.37 0.49 0.57 0.74 0.86. 0.43 0.64 0.86 1.00 1.29 1.50 0.43 0.64 0.86 1.00 1.29 1.50. Specimen. CHS diameter, D = 76.1mm , CHS thickness, t = 2.0mm SHS width, H = 70mm , SHS thickness, t = 2.0mm Gusset plate thickness, t p = 15mm constant 2.2 Material property tests Tensile tests were carried out on tensile test coupons cut out from randomly selected tube members to determine the material property of the stainless steel used. Properties determined from the recorded stress–strain relationship are R p0.01 , R p0.2 , R p1.0 , R m , E and n (stress values at various strain levels, initial modulus of elasticity and the non-linearity index). The first-two values, i.e. R p0.01 (proportional limit) and R p0.2 (proof stress) are used in calculating the index n in the Ramberg–Osgood material model as given below. As is well known, this index is a measure of the non-linearity of the stress–strain behavior, lower n values implying a greater degree of non-linearity.. The material properties from the tensile tests are presented in Table 2. A typical stress–strain curve obtained from the tensile coupon tests is shown in Fig. 4. Note that a rounded material behaviour is observed with no well-defined yield point. In calculating the design strength of the end connections of the specimens, the average values of 0.2% proof. Paper Presented by Dr. Güven Kiymaz - [email protected] © G. Kiymaz (Fatih University) & E. Seckin (Istanbul Kultur University). 3.
(4) stresses (R p0.2 ) and of the ultimate tensile stresses (R m ) in Table 2 were used. These average values for R p0.2 and R m are calculated as 380 MPa and 680 MPa, respectively. Table 2. Measured material properties from tensile coupon tests. Fig. 4.. Typical stress–strain curve from tensile coupon tests. 3. Test Results. 3.1 General behaviour under axial tensile loading Experiments were carried out as described above for the 24 different specimens with varying design strength values. The three possible failure modes that would be expected for the members with slotted end connections are yielding of the member gross cross-section (GY), block tear out of material close to the weld region (TO) and shear lag failure with fracture of the effective net cross section around the periphery of the member (PF). For the specimens in the test program no gross-section yielding was observed. On the other hand most of the specimens were observed to fail by peripheral fracture (PF) due to shear lag. Fig. 5 shows typical connection failures for a CHS and SHS section connection in a peripheral fracture mode. Specimens with longer weld lengths (particularly L w =90mm and L w =105mm) exhibited a nearly perfect peripheral fracture of the whole circular/square hollow cross section with crack propagating around the member periphery. For the specimens with shorter weld lengths (L w between 30mm and 70mm) peripheral fracture which initiated at the slotted end and gusset plate juncture seemed later to interact with a tear out type of behaviour. Compared with the long weld length specimens this behaviour was accompanied with a relatively higher distortion of the end cross section and also at post peak loads longitudinal weld or tube material tearing (Fig. 6).. Fig. 5.. Typical deformed shapes observed for CHS and SHS members with long weld lengths. Paper Presented by Dr. Güven Kiymaz - [email protected] © G. Kiymaz (Fatih University) & E. Seckin (Istanbul Kultur University). 4.
(5) Fig.. 6. Typical deformed shape for short and medium weld length connections. Fig. 7 shows close-up views of the failed specimens around the slotted end region both for “Return Weld (RW)” and “No Return Weld (NW)” cases. In both cases fracture initiated at the slotted end region due to high stress concentrations. For the NW cases, crack initiation was relatively easier in comparison to the RW (return weld) cases where the tensile load was at some point high enough to initiate a crack with the return weld material (photo on the left).. Fig. 7. Failure types for return weld (RW) and no-return weld (NW) cases. 3.2 Load-displacement response Figs. 8 and 9 present the load displacement response curves for the NW and RW cases for both SHS and CHS sections, respectively. In general the behaviour of the RW and the NW specimens are similar with close initial stiffness values and a rounded overall load-displacement response. However, for the RW cases for all the 6 specimens for both SHS and CHS members a sudden drop in strength is observed right after the maximum load is achieved whereas for the NW specimens a smooth transition is noted. For all the RW specimens the maximum load levels after which a sudden drop is observed correspond to load levels at which crack initiation was observed to occur during the tests within the return weld material. In other words, as soon as the return weld cracked a sudden drop in load occurred. On the other hand for the “No return weld” specimens, load was not as sensitive to the crack initiation which started directly on the CHS member material near the slotted end – gusset plate juncture where there is no return weld. With this respect, a more ductile behavior is observed for the specimens with their slotted ends un-welded to the gusset plate. In general the RW specimens reached higher ultimate loads than the NW specimens.. Fig. 8. Load-displacement curves for the ‘With return weld (RW) and No Return weld (NW)’ specimens for Circular Hollow Sections. Paper Presented by Dr. Güven Kiymaz - [email protected] © G. Kiymaz (Fatih University) & E. Seckin (Istanbul Kultur University). 5.
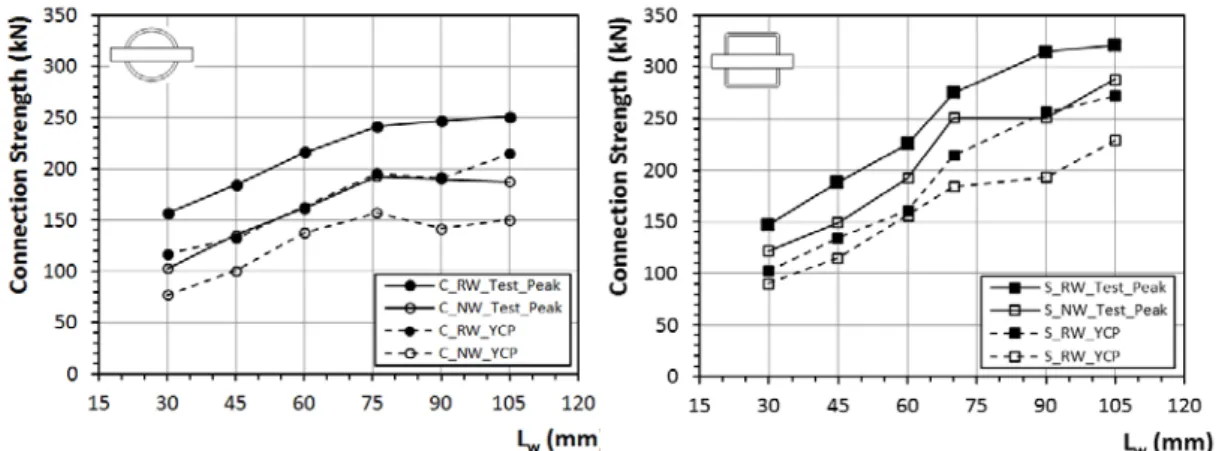
(6) Fig. 9. 3.3. Load-displacement curves for the ‘With return weld (RW) and No Return weld (NW)’ specimens for Square Hollow Sections Strength of slotted end connections. 3.3.1 Connection Yield Capacity Point (YCP) As evidenced by the load-displacement response curves and visual observations made on the specimens, all the slotted gusset plate connections achieved their maximum strength after high deformations which create excessive distortions in the geometry of the connection. In order to prevent this impractical behaviour a serviceability limit should be applied in design. Therefore for design purposes which would also take into account of such serviceability limitations a lower test strength value than the peak test strength value is suggested to be applied. For this purpose a first yield approach is adopted to calculate the design strength levels. For all the specimen tests a yield capacity point (YCP) is identified on the test load-displacement plots by using the equal area rule that is often used to estimate the yield point of a bilinear capacity curve that approximates a curvilinear one. As shown in Fig. 10 the connection yield capacity point calculated in this way is denoted by Q y .. Fig. 10. Determination of the connection yield capacity point Q y. 3.3.2 Variation of strength with weld length In Fig. 11 variation of the achieved test peak strength values (N test ) and the above explained yield capacity values (Q y ) is presented for the range of weld lengths studied both for circular and square hollow section specimens. In general for all the specimens connection strength increases with increasing weld length. The rate of increase in strength values with increasing weld lengths is greater for the SHS member connections. On the other hand for CHS connections, for weld lengths higher than L w =D=76.1 mm a nearly constant connection strength is achieved both for test peak and yield capacity levels.. Paper Presented by Dr. Güven Kiymaz - [email protected] © G. Kiymaz (Fatih University) & E. Seckin (Istanbul Kultur University). 6.
(7) Fig. 11. Variation of connection yield capacity point, Q y and test peak strengths, N test with weld length, L w. Tables 3 and 4 present peak (N Test ) and yield capacity strengths (Q y ) achieved for CHS and SHS connections with corresponding elongations (δ Test and δ Qy ) and failure modes. As explained earlier and shown in Fig.5 and Fig.6, test failure modes were either a PF (Peripheral Fracture) or a TO (Tear-out) mode where TO mode in fact corresponds to a combination of a PF mode and a tear-out failure for short and medium weld length connections. Considering all 24 specimens, the yield capacity strength levels (Q y ) correspond to around 75 percent of the test peak strengths (N Test ). On the other hand, elongation levels corresponding to the yield capacity strength levels (δ Qy ) is in average 8 percent of the levels corresponding to the peak strength levels (δ Test ). Among all the elongations achieved maximum value for δ Qy is 1.95mm whereas for δ Test a maximum elongation value of 46.3mm is obtained. From the viewpoint of serviceability considerations discussed earlier the elongation levels corresponding to the yield capacity strength levels appear to be more reasonable values compared with those corresponding to the peak strength levels. Table 3. Peak and yield capacity strengths achieved for the CHS connections with corresponding elongations and failure modes. Specimen C-L30-RW C-L45-RW C-L60-RW C-L76-RW C-L90-RW C-L105-RW C-L30-NW C-L45-NW C-L60-NW C-L76-NW C-L90-NW C-L105-NW. N Test (kN) 157,0 184,4 215,8 241,3 247,2 251,1 103,0 135,4 161,9 192,3 190,3 187,4. δ Test (mm) 12,2 10,2 11,8 25,5 46,3 13,6 5,7 7,2 10,6 10,7 10,3 24,5. Qy (mm) 117 132 163 195 191 215 77 101 138 157 142 150. δ Qy (mm) 1,17 0,53 0,75 1,95 1,43 0,72 1,15 0,50 0,92 0,63 1,42 1,20. Paper Presented by Dr. Güven Kiymaz - [email protected] © G. Kiymaz (Fatih University) & E. Seckin (Istanbul Kultur University). Test Failure Mode TO TO TO PF PF PF TO TO TO PF PF PF. 7.
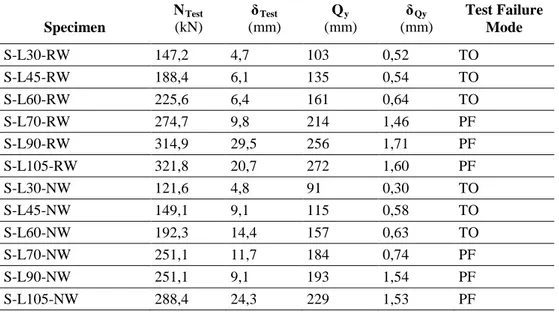
(8) Table 4. Peak and yield capacity strengths achieved for the SHS connections with corresponding elongations and failure modes. Specimen S-L30-RW S-L45-RW S-L60-RW S-L70-RW S-L90-RW S-L105-RW S-L30-NW S-L45-NW S-L60-NW S-L70-NW S-L90-NW S-L105-NW. 4. N Test (kN) 147,2 188,4 225,6 274,7 314,9 321,8 121,6 149,1 192,3 251,1 251,1 288,4. δ Test (mm) 4,7 6,1 6,4 9,8 29,5 20,7 4,8 9,1 14,4 11,7 9,1 24,3. δ Qy (mm). Qy (mm) 103 135 161 214 256 272 91 115 157 184 193 229. 0,52 0,54 0,64 1,46 1,71 1,60 0,30 0,58 0,63 0,74 1,54 1,53. Test Failure Mode TO TO TO PF PF PF TO TO TO PF PF PF. Design of slotted and gusset plate welded connections in stainless steel. The resistance of a steel tension member is given as the minimum of the resistance in yielding of the gross section area ( Pn = Fy . Ag ) and the resistance in fracture of an effective net section area ( Ae ) within the connection region. ( Pn = Fu . Ae ) . The effective area is used to determine the efficiency of the connection under the effects of shear lag and calculated by using a shear lag reduction coefficient, U . Design rules related to failure of slotted end tension connections with welded gusset plates can be found in three major international specifications on steel structures namely the American AISC 360 (2005), the Canadian CAN/CSA-S16 (2001) and the European EN1993-1-8 (2005). Design methods adopted in these specifications are shown in Table 5 and Table 6 for shear lag and block shear tensile fracture (tear-out) failures respectively. Note that in EC3 Part 1.8 there are no design provisions for shear lag effect for such connections in hollow sections. In this design guide, rules for shear lag effect is given only for bolted connections for angles connected by one leg and other unsymmetrically connected tension members. Comparing the approaches adopted in these codes it is noted that for block shear failure the three codes present similar resistance equations. Nominal resistances predicted by these codes are equal (a slightly different value predicted by EC3 in which shear yield coefficient is taken as the theoretical 1. 3 value) but the design resistance values differ due to different resistance factors adopted in each code.. However, it should be noted that in the block shear design equation of CSA (2001), the multiplication of two factors (0.85 and 0.90) equals 0.765 which is very close to the resistance factor used in the design equation of AISC (2005) which is 0.75. On the other hand, the resistance factor adopted in EN1993-1-8 (2005) is 1 1.25 which is again equal to a close value of 0.80. As for shear lag effect two general approaches are adopted. As presented in Table 5, shear lag coefficient, U , is calculated as a function of the ratio of the eccentricity of the connection ( x ) to the weld length ( Lw ) in the American specification whereas in the Canadian specification. U is a function of the ratio of the weld length ( Lw ) to. peripheral distance between the welds ( w ). In both specifications the adverse effect of shear lag decreases as weld length Lw increases. In the American specification shear lag factor U is taken as unity for Lw ≥ 1.3D and in the Canadian specification this limiting value is given as Lw ≥ 2.0 w or assuming w = π .(D 2) this value becomes. Lw ≥ 1.57 D . Therefore a more conservative limit is adopted in the Canadian specification. For weld lengths smaller than the smallest specified limits for shear lag i.e. Lw < 1.0 D in AISC (2005) and Lw < 1.0w in CSA (2001) specifications, the collapse behaviour tends to be governed by a block shear type of failure. In between these upper and lower limits design equations are given for the calculation of shear lag coefficient, U . The design of structural stainless steel members and connections are covered in Eurocode 3 - Design of steel structures Part 1-4: General rules - Supplementary rules for stainless steels (EN 1993-1-4: 2006) and the American ASCE Specification for the Design of Cold-Formed Stainless Steel Structural Members, SEI / ASCE (2002). In both specifications, no specific rules exist which cover the design of slotted end tension connections with welded gusset plate.. Paper Presented by Dr. Güven Kiymaz - [email protected] © G. Kiymaz (Fatih University) & E. Seckin (Istanbul Kultur University). 8.
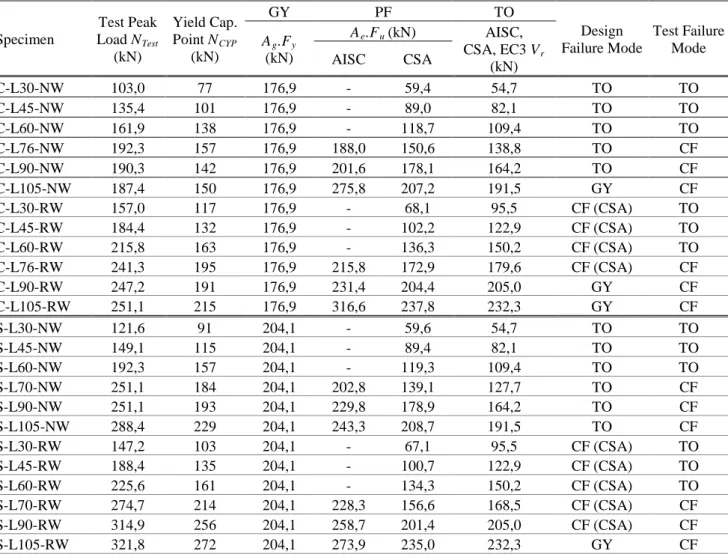
(9) Table 5. Design provisions for shear lag in hollow sections with slotted end connection with single welded concentric gusset plate. Specification CHS AISC (2005). SHS AISC (2005). Shear lag coefficient, U. Validity range. x for 1.3D > Lw ≥ D Lw U = 1 for Lw ≥ 1.3D (CHS only ). Lw ≥ D. U =1−. U =1−. x for L w ≥ H Lw. Lw ≥ H. B is the width of SHS section CHS & SHS CSA (2001). Table 6. CSA (2001). Eurocode (2005). Specimen. N.A. Design provisions for block shear (tear-out). AISC (2005). Table 7. U = 1 for Lw w ≥ 2.0 U = 0.5 + 0.25 Lw w for 2.0 > Lw w ≥ 1.0 U = 0.75 Lw w for Lw w < 1.0. Tr + Vr = φU bs Ant Fu + 0.6φAgv F y ≤ φU bs Ant Fu + 0.6φAnv Fu in which φ = 0.75 and U bs = 1.0. Tr + Vr = φAnt Fu + 0.6φAgv Fy ≤ φAnt Fu + 0.6φAnv Fu in. which. φ = 0.9 Tr + Vr =. 1. γM2. Ant Fu +. 1. 1. γ M0. 3. γ M 0 = 1.0, γ M 2 = 1.25. Anv Fy. Comparison of test strengths with code predicted nominal resistance values for carbon steel Test Peak Yield Cap. Load N Test Point N CYP (kN) (kN). GY A g .F y (kN). PF A e .F u (kN) AISC. CSA. C-L30-NW 103,0 77 176,9 C-L45-NW 135,4 101 176,9 C-L60-NW 161,9 138 176,9 C-L76-NW 192,3 157 176,9 188,0 C-L90-NW 190,3 142 176,9 201,6 C-L105-NW 187,4 150 176,9 275,8 C-L30-RW 157,0 117 176,9 C-L45-RW 184,4 132 176,9 C-L60-RW 215,8 163 176,9 C-L76-RW 241,3 195 176,9 215,8 C-L90-RW 247,2 191 176,9 231,4 C-L105-RW 251,1 215 176,9 316,6 S-L30-NW 121,6 91 204,1 S-L45-NW 149,1 115 204,1 S-L60-NW 192,3 157 204,1 S-L70-NW 251,1 184 204,1 202,8 S-L90-NW 251,1 193 204,1 229,8 S-L105-NW 288,4 229 204,1 243,3 S-L30-RW 147,2 103 204,1 S-L45-RW 188,4 135 204,1 S-L60-RW 225,6 161 204,1 S-L70-RW 274,7 214 204,1 228,3 S-L90-RW 314,9 256 204,1 258,7 S-L105-RW 321,8 272 204,1 273,9 F y = 380 MPa, F u = 680 MPa GY: Gross Yield, PF: Peripheral Fracture, TO : Tear-Out. 59,4 89,0 118,7 150,6 178,1 207,2 68,1 102,2 136,3 172,9 204,4 237,8 59,6 89,4 119,3 139,1 178,9 208,7 67,1 100,7 134,3 156,6 201,4 235,0. Paper Presented by Dr. Güven Kiymaz - [email protected] © G. Kiymaz (Fatih University) & E. Seckin (Istanbul Kultur University). TO AISC, CSA, EC3 V r (kN) 54,7 82,1 109,4 138,8 164,2 191,5 95,5 122,9 150,2 179,6 205,0 232,3 54,7 82,1 109,4 127,7 164,2 191,5 95,5 122,9 150,2 168,5 205,0 232,3. Design Test Failure Mode Failure Mode TO TO TO TO TO GY CF (CSA) CF (CSA) CF (CSA) CF (CSA) GY GY TO TO TO TO TO TO CF (CSA) CF (CSA) CF (CSA) CF (CSA) CF (CSA) GY. TO TO TO CF CF CF TO TO TO CF CF CF TO TO TO CF CF CF TO TO TO CF CF CF. 9.
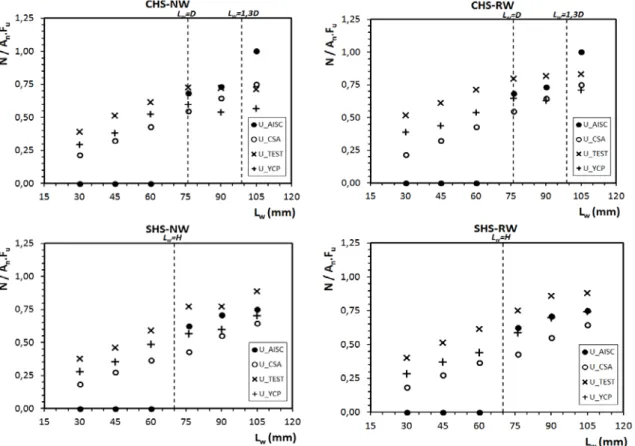
(10) Table 7 presents code estimations for the test specimens using the expressions given in Tables 5 and 6 for shear lag and tear-out failure modes. In this table test peak loads and yield capacity strengths are also given for comparison with the code strengths. Note that the code values are all nominal values i.e. partial safety factors were set to unity. Also note that these values were calculated using the material property values given earlier in the paper for yield stress and ultimate tensile stress. In this table code estimations for failure modes (i.e. the governing mode of failure) are compared with the experimentally achieved modes. As mentioned earlier depending on the weld length, L w , all the tested connections failed in either a perfect peripheral fracture or a combination of peripheral fracture and a tear-out type of failure mode. Therefore comparing the code failure modes with the test modes in Table 7, in general a close agreement seems to be achieved for short and medium weld lengths. In the test program no specimen failed in a gross-section yielding mode. For the long weld lengths (L w =90mm and 105mm) the codes estimate gross-section yielding which is not in line with the test findings. Comparing both the test peak and YCP strength levels with nominal code predicted strength values it is observed that the code values are conservative particularly for short and medium weld lengths. As stated earlier the resistance in fracture of an effective section area ( Ae ) within the connection region is given by. Pn = Fu . Ae . In codified design the effective area is used to determine the efficiency of the connection under the effects of shear lag and calculated by using a shear lag reduction coefficient, U . As explained above, in the test program for all the specimens the behaviour was mostly controlled by fracture of an effective section resulting in a peripheral fracture or a combination of peripheral and a tear-out type of fracture. Hence it seems reasonable to calculate experimentally obtained shear lag reduction factors and compare them with the code estimated factors. For this purpose, Fig. 12 presents, for all the tested connections, reduction factors given by codes and obtained from tests. In the plots shear lag factors estimated by AISC and CSA codes are given and compared with test reduction factors which are calculated by dividing the test strength by the analytical fracture strength of a net section with full section efficiency, i.e. U=1 (A n .F u ). This ratio is given on the vertical axis of the plots as N/A n .F u . Two test strength levels were used for the calculation of the test reduction factors denoted on the plots by U_TEST and U_YCP which correspond to the test peak strength and the yield capacity strength levels, respectively. Note again that the Canadian CSA code covers all the test geometries (i.e. weld length ratios) studied in the test program whereas the validity range for the weld length ratio in the American AISC code is limited. In Fig. 12, it is observed in general that strength reduction factors based on the test strengths follow similar trends with particularly the Canadian CSA code factors. Reductions factors based on the test peak strengths (U_TEST) are higher than those based on the yield capacity strengths (U_YCP). The results indicate that using the Canadian CSA reduction factors for the design of slotted end connections in stainless steel might be reasonable and safe. It should be noted that since the deformation levels at the test peak loads are very high using the reduction factors which correspond to the yield capacity load and deformation levels could be recommended for a better design.. Fig. 12. Comparison between the test and code predicted efficiency factors for all the test specimens. Paper Presented by Dr. Güven Kiymaz - [email protected] © G. Kiymaz (Fatih University) & E. Seckin (Istanbul Kultur University). 10.
(11) 5. Conclusions. In this paper, shear lag induced failure of slotted end tension connections is investigated for circular and square hollow section members in stainless steel. An experimental program was carried out on 24 slotted gusset plate welded stainless steel circular and square member end connections under axial tension. Two parameters that were considered as variables in the test program were the fillet weld length L w and the end condition of the welded gusset plate inside the slot being welded or non-welded. For the specimens in the test program having a range of weld lengths between 30mm and 105mm no gross-section yielding was observed. On the other hand most of the specimens were observed to fail by peripheral fracture (PF) due to shear lag. Specimens with longer weld lengths (particularly L w =90mm and L w =105mm) exhibited a nearly perfect peripheral fracture of the whole circular/square hollow cross section with crack propagating around the member periphery. For the specimens with short and medium weld lengths (L w between 30mm and 70mm) peripheral fracture which initiated at the slotted end and gusset plate juncture seemed later to interact with a tear out type of behaviour. Load-displacement response curves for the specimens were plotted and comparisons were made mainly between the RW and NW cases. For all RW specimens a sudden drop in strength is observed right after the maximum load is achieved whereas for the NW specimens a smooth transition is noted. With this respect, a more ductile behavior is observed for the specimens with their slotted ends un-welded to the gusset plate. In general the RW specimens reached higher ultimate loads than the NW specimens but at higher elongation levels. The maximum strength and yield capacity strength results obtained from the test program were compared with currently available design guidance for slotted gusset plate welded tubular end connections. It is noted that no specific rules exist in international specifications on structural stainless steel which cover the design of such connections. Therefore, the results of this study were compared with the design rules for carbon steel. Based on the observation that the connections exhibited large deformations at test peak strengths a reduced level of strength corresponding to a first yield point on the load-displacement curves was used for comparison with design. First yield points namely the yield capacity points (YCPs) were achieved for more practical and serviceable deformation levels. Comparing both the test peak and YCP strength levels with nominal code predicted strength values it was observed that the code values are conservative particularly for short and medium weld lengths. Reduction in strength due to shear lag is taken into account in design codes by using a so called shear lag reduction factor, U. Reduction factors obtained by using the test strength values were also compared with the factors given by codes for the range of weld lengths considered in the test program. Particularly the test reduction factors based on the yield capacity strengths were in closer agreement with the factors proposed by the Canadian CSA code. This agreement was achieved for all the specimens in the test program. The results indicate that using the Canadian CSA reduction factors for the design of slotted end tubular connections in stainless steel might be reasonable and safe. Therefore, this research has provided evidence for the possible recommendation for use of the current Canadian design formulations for carbon steel to be applied to the design of slotted gusset plate welded CHS and SHS tension connections in stainless steel.. References [1] Di Sarno L., Elnashai A.S. and Nethercot D.A. (2003) Seismic performance assessment of stainless steel frames. Journal of Constructional Steel Research, 59 1289–1319 [2] Aoki H. (2000) Establishment of design standards and current practice for stainless steel structural design in Japan. Journal of Constructional Steel Research 54(1):191–210. [3] Burgan BA, Baddoo NR, Gilsenan KA. (2000) Structural design of stainless steel members: comparison between Eurocode 3, Part 1.4 and tests results. Journal of Constructional Steel Research 54(1):51–73. [4] Johansson B, Olsson A. (2000) Current design practice and research on stainless steel structures in Sweden. Journal of Constructional Steel Research 54(1):3–29. [5] Kouhi J., Talja A., Salmi P., Ala-Outinen T. (2000) Current R&D work on the use of stainless steel in construction in Finland. Journal of Constructional Steel Research 54(1):31–50. [6] Martinez-Saucedo G., Packer J.A., Willibald S. (2006) Parametric finite element study of slotted end connections to circular hollow sections. Engineering Structures, 28, Pages 1956-1971 [7] Korol RM. (1996) Shear lag in slotted HSS tension members. Canadian Journal of Civil Engineering 23:1350-4 [8] Willibald S. and Martinez-Saucedo G. (2006). Behaviour of gusset plate connections to ends of round and elliptical hollow structural section members. Canadian Journal of Civil Engineering 33 (4), 373-383. Paper Presented by Dr. Güven Kiymaz - [email protected] © G. Kiymaz (Fatih University) & E. Seckin (Istanbul Kultur University). 11.
(12) [9] Cheng Roger, J.J., Kulak, G.L and Khoo, H.A. (1998). Strength of slotted tubular tension members. Canadian Journal of Civil Engineering 25:982-991 [10] Ling, T.W., Zhao, X.L., Al-Mahaidi, R. and Packer, J.A. (2007) Investigation of shear lag failure in gusset plate welded structural steel hollow section connections. Journal of Constructional Steel Research 63, 293–304 [11] Martinez-Saucedo G., Packer J.A and Christopoulos, C. (2008) Gusset plate connections to circular hollow section braces under inelastic cyclic loading. Journal of Structural Engineering, ASCE, 134:7, 1252-1258. [12] Martinez-Saucedo G. and Packer J.A. (2009). Static design recommendations for slotted end HSS connections in tension. Journal of Structural Engineering, ASCE, 135:7, 797-805. [13] ANSI/AISC 360 (2005) Specification for structural steel buildings, Chicago: American Institute of Steel Construction (AISC) [14] CAN/CSA-S16 (2001). Limit states design of steel structures, Toronto Canadian Standards Association (CSA). [15] EN1993-1-8 (2005) Eurocode 3 Design of steel structures- general rules—part 1–8: Design of Joints, Brussels: European Committee for Standardisation. [16] EN1993-1-4 (2006) Eurocode 3 Design of steel structures - Part 1-4: General rules – Supplementary rules for stainless steels, Brussels: European Committee for Standardisation. [17] SEI / ASCE (2002) 8-02. Specification for the design of cold-formed stainless steel structural members. American Society of Civil Engineers. Paper Presented by Dr. Güven Kiymaz - [email protected] © G. Kiymaz (Fatih University) & E. Seckin (Istanbul Kultur University). 12.
(13)
Şekil


+6

Benzer Belgeler
Comparing with western world, the dread of anthrax seems less in Taiwan, the ability of diagnosis or confirmed diagnostic tests were uncertain due to lacking real clinical
Leylâ Erbil, yeterince değerlendiril mediğine inandığı, haklı da olduğu ya zarlığını ve edebiyatımızı yalnız bir tar tışmanın olanak verdiği yanıt
Psikotik semptomlarýn patogenezinde biyolojik bozukluklar ile sonuçta ortaya çýktýðý varsayýlan zihinsel deðiþikliklerin iliþkisini taným- layan bir çerçeve olarak
Genellikle yavaş büyüyen Dünya Sağlık Örgütü (DSÖ) grade I tümörler olmalarına karşın, şeffaf hücreli, kordoid, papiller ve rabdoid nadir histolojik varyantları
(7) They investigated the effects of parasymphatomimetic drugs on lacrimation, saliva and nasal secretions by objective tests and used modified schirmer test for evaluating
The steel grade of plate and bolts and the thickness of the plate were changed to investigate the behaviour of the connection. The
In the present study, 20 boreholes in Basra city in Iraq were considered and the seismicity and the liquefaction susceptibility of the fine grained soils in these
The maximum strength results obtained from the test program were compared with currently available design guidance for slotted gusset plate welded tubular end connections..
