ISSN 1993-8233 ©2012 Academic Journals
Full Length Research Paper
Performance comparison of artificial neural network
(ANN) and support vector machines (SVM) models for
the stock selection problem: An application on the
Istanbul Stock Exchange (ISE) - 30 index in Turkey
Mehpare T
İ
MOR
1, Hasan D
İ
NÇER
2* and
Ş
enol EM
İ
R
31Department of Quantitative Methods, Istanbul University, Istanbul, 34320, Turkey. 2Department of Banking and Finance, Beykent University, Istanbul, 34500,Turkey. 3
Department of Computer Programming, Beykent University, İstanbul, 34500, Turkey. Accepted 12 December, 2011
Support vector machines (SVM) and artificial neural networks (ANN) are machine learning methods that find a wide range of applications both in the field of engineering and social sciences. Recently, studies especially in the field of finance for the classification and estimation make it necessary to use these methods often in this area. In this study, different SVM and ANN models for the problem of stocks selection which provide maximum returns have been applied on different combinations of data sets which obtained from the balance sheets, stocks prices and the results of a comparative analysis has been presented. The findings show that SVM and ANN models including financial ratios give meaningful performance results for the stock selection.
Key words: Support vector machines, artificial neural networks, stock selection, financial ratios, feature
selection.
INTRODUCTION
Since 1990s, investment opportunities in terms of market diversity with the globalization have been increased by the new economy which is also called knowledge based economy. Through the efficient market hypothesis, the ground to operate in a competitive structure has been prepared for national and international investors. As a result of increasing the competitive structure, the require-ment of novel models regarding the optimal returns especially in the stock market has become important.
Machine learning methods such as artificial neural networks, genetic algorithms and fuzzy logic based stock selection have also been used in the literature. In particular, the artificial neural network, which is a type of methods as well as time series approaches related to the the nonparametric methods used in many problems as
*Corresponding author. E-mail: [email protected]. Tel: +90212 4441997. Fax: +90212 8675566.
classification and estimation for a long time, has proven its success. In this respect, comparisons of current approaches with artificial neural networks for classification and selection problems stand out in scientific terms. Support vector machine with very successful results in natural sciences such as medicine, engineering, which has recently started to find its field of application in social sciences and especially finance, is a novel method.
In this study, support vector machines and multi-layer artificial neural network models were applied on stocks in Istanbul stock exchange (ISE) 30 index between 2002 to 2010 periods to achieve maximum returns on equitiesfor investors in an increasingly competitive environment.
LITERATURE REVIEW
Support vector machines (SVMs) have been extensively researched in machine learning community for the last
decade and actively applied in different areas. SVMs are basically used for regression and classification functions, which are called “classifying SVM”, support vector regression (SVR), respectively. Support vector machines have been applied successfully in many problems such as speech recognition (Changxue et al., 2001), signal recognition (Gexiang et al., 2004), text categorization (Pan et al., 2009), gene selection (Zhang Q, 2007), intrusion detection (Zhenguo and Guanghua, 2009), spam filtering (Amayri and Bouguila, 2009), forecasting (Shen et al., 2006; Guo-Rui et al., 2007; Liu et al., 2009; Shu-xi and Wang, 2006; Tian et al., 2009), medical image classification (Bai and Tian, 2009; Zaim et al., 2007), classification (Changsheng et al., 2003; Jing et al., 2009; Zai-Wen et al., 2009; Reljin and Pokrajac, 2008).
Several papers have been published assessing perfor-mance of SVM against some statistical and machine learning algorithms in financial applications.
Tay and Lijuan (2001) examined the feasibility of SVM in financial time series forecasting by comparing it with a multi-layer back-propagation (BP) neural networks. Analysis of the experimental results proved that it is advantageous to apply SVMs to forecast financial time series.
Huang et al. (2004) used SVM for credit rating analysis and back propagation neural network (BNN) as a benchmark. They obtained prediction accuracy around 80% from both BNN and SVM methods for the United States and Taiwan markets. However, only slight improvement of SVM was observed.
Shin et al. (2005) demonstrated that SVMs perform better than back-propagation neural networks when applied to corporate bankruptcy prediction and the accuracy and generalization performance of SVM that is better than that of BPN as the training set size is getting smaller.
Huang et al. (2005) investigated the predictability of financial movement direction with SVM by forecasting the weekly movement direction of NIKKEI 225 index. To evaluate the forecasting ability of SVM, we compare its performance with those of linear discriminant analysis, quadratic discriminant analysis and Elman back-propagation neural networks. The experiment results show that SVM outperforms the other classification methods.
Yang et al. (2002) tried varying the margins in SVM regression in order to reflect the change in volatility of financial data and also analyzed the effect of asymmetrical margins so as to allow for the reduction of the downside risk. The former approach produced the lowest total error when predicting the daily closing price of Hong Kong's Hang Seng Index (HSI).
Sansom et al. (2003) evaluated utilizing neural networks (NNs) and support vector machines (SVM) for wholesale (spot) electricity price forecasting. The SVM required less time to optimally train than the NN, whilst the SVM and NN forecasting accuracies were found to be
very similar.
Gavrishchaka and Ganguli, (2003) used SVMs for forecasting the volatility of foreign-exchange data. Their preliminary benchmark tests indicated that SVMs can perform significantly better than or comparable to both naive and GARCH models. Zhou et al. (2004) applied an accurate online support vector regression (AOSVR) to forecast the prices of the electric-power markets. Results showed that it was effective in forecasting the prices of the electric – power market.
Calvo et al. (2002) compared the performance of NN, Naive Bayes and SVM algorithms for the automatic categorization of corporate announcements in the Australian Stock Exchange (ASX). They performed tests on two categorization tasks: “market sensitivity” which indicates whether an announcement will have an impact on the market, and “report type” which classifies each announcement into one of the report categories defined by the ASX.
Chen et al. (2006) compared SVMs and back propagation (BP) neural networks when forecasting the six major Asian stock markets. Both models perform better than the benchmark AR (1) model in the deviation measurement criteria, whilst SVMs performed better than the BP model in four out of six markets.
Kamruzzaman et al. (2003) investigated the effect of different kernel functions and the regularization parameter while using SVMs to predict six different foreign currency exchange rates against the Australian dollar.
Ongsritrakul et al. (2003) demonstrated the use of SVR techniques for predicting the cost of gold by using factors that have an effect on gold to estimate its price. They applied decision tree algorithm on the feature selection task and then performed the regression using the fore-casted indexes. The results show that the combination of the decision tree and SVR leads to a better performance. Fan and Palaniswami, (2001) used SVMs for classification for stock selection on the Australian Stock Exchange and significantly outperformed the benchmark. Quah (2008) presented methodologies to select equities based on soft-computing models which focus on applying fundamental analysis for equities screening and compared the performance of three soft-computing models, namely multi-layer perceptions (MLP), adaptive neuro-fuzzy inference systems (ANFIS) and general growing and pruning radial basis function (GGAP-RBF).
Tirkayi and Ahlatcioglu (2005) proposed a new method for group decision making in fuzzy environment and demonstrates the usefulness of fuzzy methodology in financial problems. They accomplished it by making some modification of Chen’s method and it is shown how their method can be used for stocks selection on ISE (Istanbul Stock Exchange).
Wong and Wang (1991) described an artificial neural network (ANN) approach to a stock selection strategy from a general system-design perspective. They showed
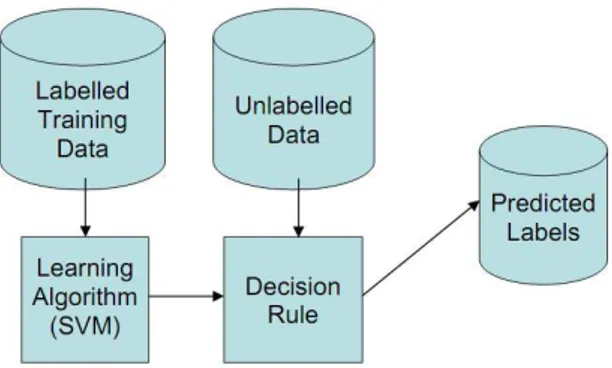
Figure 1. SVM classification process.
the forecast of stock market returns, assessing of country risk and rating of stocks based on fuzzy rules, probabilistic and Boolean data which can be done using the proposed neural gates.
Hart et al. (2003) examined profitability of a broad range of stock selection strategies in 32 emerging markets over the period 1985 to 1999. They showed that strategies can be implemented successfully in practice by a large institutional investor, facing a lack of liquidity and substantial transaction costs.
Xidonas et al. (2009) presented an expert system methodology for supporting decisions that concern the selection of equities, on the basis of financial analysis. They proposed a methodology that is employed for selecting the attractive equities through the evaluation of the overall corporate performance of the corresponding firms and validity of the proposed methodology that is tested through a large scale application on the Athens Stock Exchange.
Albadvi et al. (2007) proposed a model which is structured around two pillars: industry evaluation and company evaluation. The preference ranking organization method for enrichment evaluation (PROMETHEE) has been used to solve the problem. The model has been applied at Tehran Stock Exchange (TSE) as a real case and a survey from the experts in order to determine the effective criteria for industry evaluation and company evaluation which has been conducted.
Horton (2009) examined Japanese Candlestick methods of technical analysis for 349 stocks. Using more data and alternative tests, the study contradicts an earlier article in the literature, finding little value in the use of candlesticks and providing more support for the weak form of the efficient markets hypothesis.
Eakins and Stansell (2003) examined whether superior investment returns can be earned by using neural network modeling procedures to perform forecasts based on a set of financial ratios reflecting traditional value based investment strategies. They reported that risk-adjusted returns for the portfolios selected by the neural network are greater than those achieved using other forecasting methods.
As seen in the literature review, the usage of support vector machines has been recently observed in the field of social sciences, and especially finance as well as applications in engineering and medical fields. In the stock selection, support vector machines have been limitedly studied by the model based on financial ratios related to the estimation of stock return. In this issue, it has not been seen any publication containing a comparative analysis of artificial neural networks and support vector machines.
THEORETICAL FRAMEWORK Support vector machines (SVM)
The SVM (Figure 1) is a supervised learning algorithm that infers from a set of labeled examples of a function that takes new examples as input, and produces predicted labels as output. Since the output of the algorithm is a mathematical function that is defined on the space from which our examples are taken, and takes on one of two values at all points in the space, corresponding to the two class labels that are considered in binary classification (Lovell et al., 2006).
Support vector machine (SVM) is based on statistical learning theory, which has yielded excellent generalization performance on a wide range of problems. SVM were first suggested by Vladimir Naumovich Vapnik (Vapnik, 1998). Established on the unique theory of the structural risk minimization principle to estimate a function by minimizing an upper bound of the generalization error, SVM is shown to be very resistant to the overfitting problem (Tay and Cao, 2001).
The inductive principle behind SVM is structural risk minimization (SRM). According to this principle the risk of a learning machine (R) is bounded by the sum of the empirical risk estimated from training samples (Remp) and a confidence interval ( ): R Remp. The strategy of SRM is to keep the empirical risk (Remp)fixed and to minimize the confidence interval ( ), or to maximize the margin between a separating hyperplane and closest data points. A separating hyperplane refers to a plane in a multi-dimensional space that separates the data samples of twoclasses. The optimal separating hyperplane is the separating hyperplane that maximizes the margin from closest data points to the plane.
The basic procedure for applying SVMs to a classification model can be explained briefly as in the following. First, map the input vectors into a feature space, which is possible with feature spaces of higher dimensions. The mapping is either linear or nonlinear, depending on the function selected. Then, within the feature space, seek an optimized division, that is, construct a hyperplane that separates two or more classes. Using the structural risk minimization rule, the training of SVMs always seeks a globally optimal solution and avoids overfitting. Therefore, it has the ability to deal with a large number of features (Wun-Hwa and Jen-Ying, 2006).
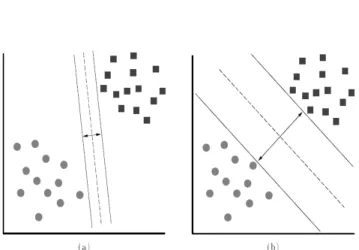
A better generalization capability is expected from Figure 2b (Osuna et al., 1997).
Another key property of SVM is that training SVM which is equivalent to solving a linearly constrained quadratic programming problem so that the solution of SVM is always unique and globally optimal, unlike other networks’ training which requires nonlinear optimization with the danger of getting stuck into local minima (Bin et al., 2006).
For conventional statistical classification techniques, an underlying probability model must be assumed in order to calculate the posterior probability upon which the classification decision is
Figure 2. Seperating hyperplanes with different margins*. *(a) separating hyperplane with small margin, (b) separating hyperplane with larger
Figure 3. Mapping from low dimensions to higher dimensions.
made. Neural networks and support vector machines can perform the classification task without this limitation. Additionally, these artificial intelligence methods also achieved better performance than traditional statistical methods (Cheng-Lung et al., 2007).
SVM are remarkably intolerant of the relative sizes of the number of training examples of the two classes. In most learning algorithms, if there are many more examples of one class than another, the algorithm will tend to correctly classify the class with the larger number of examples, thereby driving down the error rate. Since SVM’s are not directly trying to minimize the error rate, but trying to separate the patterns in high dimensional space, the result is that SVM’s are relatively insensitive to the relative numbers of each class. For instance, new examples that are far behind the hyperplanes do not change the support vectors (Drucker et al., 1999).
If the two classes are not linearly separable, the SVM tries to find the hyperplane that maximizes the margin while, at the same time, minimizing a quantity proportional to the number of misclassification errors. The trade-off between margin and misclassification error is controlled by a user-defined constant (Cortes and Vapnik, 1995).
SVM can also be extended to handle nonlinear decision surfaces propose a method of projecting the input data onto a high dimensional feature space using kernel functions and formulating linear classification problem in that feature space (Pal and Mather,
Figure 4. Supporting hyperplanes and margin.
Figure 5. Neural network architecture.
2005) (Figure 3).
A (linear) decision surface for a binary classification problem is optimal if it is equidistant to two supporting hyperplanes and maximize the margin between the two supporting hyperplane (Figure 4).
Artificial neural networks (ANN)
The term ‘neural network’ has its origins in attempts to find mathematical representations of information processing in biological systems (Bishop, 1995).
An artificial neuron (AN) is a model of a biological neuron (BN). Each AN receives signals from the environment, or other ANs, gathers these signals, and when fired, transmits a signal to all connected ANs. Figure 5 is a representation of an artificial neuron. Input signals are inhibited or excited through negative and positive numerical weights associated with each connection to the AN. The fire of an AN, and the strength of the exiting signal are controlled via a function, referred to as the activation function. The AN collects all incoming signals, and computes a net input signal as a function of the respective weights. The net input signal serves as input to the activation function which calculates the output signal of the AN (Engelbrecht, 2007).
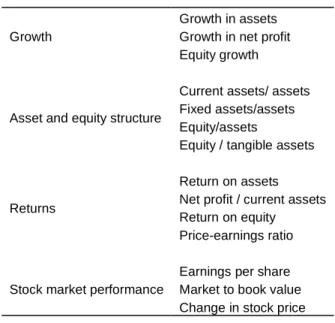
Table 1. Basic financial indicators for the estimation model.
Growth
Growth in assets Growth in net profit Equity growth
Asset and equity structure
Current assets/ assets Fixed assets/assets Equity/assets
Equity / tangible assets
Returns
Return on assets Net profit / current assets Return on equity
Price-earnings ratio
Stock market performance
Earnings per share Market to book value Change in stock price
Financial indicators
The two main methods are generally used for the performance evaluation of companies. These methods can be divided into two classes including fundamental and technical analysis. While fundamental analysis is carried out for financial ratios obtained from companies' financial statements, technical analysis involves the evaluation of the historical price movements in the stock market (Dinçer and Hacıoğlu, 2009). As a way of the financial prediction, fundamental analysis through the lots of financial items and ratios can be used for the forecasting the model. Basic ratios concerning the fundamental analysis are seen in Table 1.
In this study, because of the different sectors including in the ISE-30, it has been paid attention to the selection of the most appropriate ratios. Determining the growth rates, returns, stock performance and the structure of the balance sheet is very critical to be able to do financial analysis healthier. In this scope, these rates can be divided into four key groups as growth, asset and equity structure, returns and stock market performance.
Especially, assets, net profit and equity are the main items in the balance sheet for all sectors. That is why; focusing on the change related to the assets or liabilities, net profit and equity stays one step ahead of the analysis whilst the all sectors in the ISE 30 are compared together from the financial aspect. On the basis of the study, growth rates, asset and equity structure, returns and stock market performance have been calculated for each year between 2002 and 2010. The success of models has been revealed depending on the results of the support vector machines and artificial neural networks based on the financial ratios.
EMPIRICAL RESULTS
In this study, the stocks belonging to 2002-2010 periods in the ISE-30 index were used. 14 independent variables from the financial statements and stock prices have been identified, as the dependent variable, class variable have been labeled according to the stock returns as “1” or “0”.
Table 2. Performance results of SVM models on entire data set.
Kernel types Training perf. Test perf. Overall perf.
Linear 78.22 67.65 75.56
Radial 78.22 67.65 75.56
Sigmoid 74.75 63.24 71.85
Polynomial 69.80 57.35 66.67
perf., performance
Class label “1” shows the top 10 returns and class label “0” identifies the other situation.
Based on the mentioned data, the results of the SVM and ANN models have been determined by the 3 different dataset through the STATISTICA software package. Primarily, the best performance results of the linear, polynomial, radial, sigmodial types of kernel SVM models and ANN models with different architectures were found by the using all data set covering the years 2002 to 2010 in the analysis. In SVM models, 75% of all data were reserved for training and 25% for testing purposes. For ANN models, the data were separated as a training (25%), testing (20%), and validation (10%) sets.
In the second phase of analysis, to be able to see the time effect on the performance results of training and testing more robustly, all data was divided into 2 separate consecutive periods as training (2002 to 2007) and testing (2008 to 2010) set.
In the last stage, to be able to determine the variables which would represent the model in a highest level, feature selections were used for dimension reduction. For the entire data set, linear and radial kernel SVM models show that training performance is 78.22%, test performance is 67.65% and overall performance is 75.56% which means that the best SVM models are linear and radial type kernels (Table 2). The third best model (sigmoid kernel type) has higher degree of performance than polynomial kernel type SVM model.
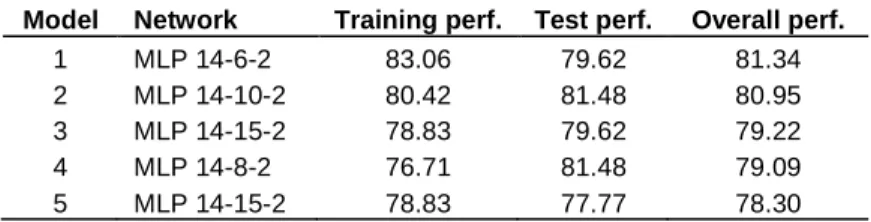
Among the ANN models, the best one is MLP 14-6-2 model which shows 81.34% overall performance. The remaining 4 models give close results between each others. When compared, SVM and ANN models according to the entire data set, the best overall performance are given by the MLP 14-6-2 ANN architecture (Table 3).
In the SVM models which were trained in the period of 2002 to 2007 and tested in the period of 2008 to 2010, the best result was undermined by polynomial kernel type. Models which show two best overall ranks also have 100% training performance. For both entire and splitted data sets, radial kernel SVM models possess successful results (Table 4).
All of the ANN models have high training and low testing performances among each other (Table 5). MLP 14-13-2 model holds the best overall performance which is slightly lower than polynomial kernel type SVM model.
Table 3. Performance results of ANN models on entire data set.
Model Network Training perf. Test perf. Overall perf.
1 MLP 14-6-2 83.06 79.62 81.34 2 MLP 14-10-2 80.42 81.48 80.95 3 MLP 14-15-2 78.83 79.62 79.22 4 MLP 14-8-2 76.71 81.48 79.09 5 MLP 14-15-2 78.83 77.77 78.30 perf., performance
Table 4. Performance results of SVM models on 2002 to 2007 training and 2008 to 2010 test set.
Kernel types Training perf. Test perf. Overall perf.
Polynomial 100 68.88 84.44
Radial 100 66.66 83.33
Linear 83.89 71.11 77.50
Sigmoid 57.22 62.22 59.72
perf., performance
Table 5. Performance results of ANN models on 2002 to 2007 training and 2008 to 2010 test set.
Model Network name Training perf. Test perf. Overall perf.
1 MLP 14-13-2 98.89 69.00 83.94 2 MLP 14-10-2 98.89 66.00 82.44 3 MLP 14-12-2 100 64.00 82.00 4 MLP 14-5-2 97.22 66.50 81.86 5 MLP 14-8-2 97.78 64.50 81.14 perf., performance
to select variables which effect the dependent variable at most. For this purpose variables’ p-values ordered and variables which have p-values equal or less than 0.1 were selected and further analysis were studied on this subset (Table 6). Chosen variables are complied with the domain experts’ opinions mostly. The results are shown for SVM and ANN models in Table 7 and 8.
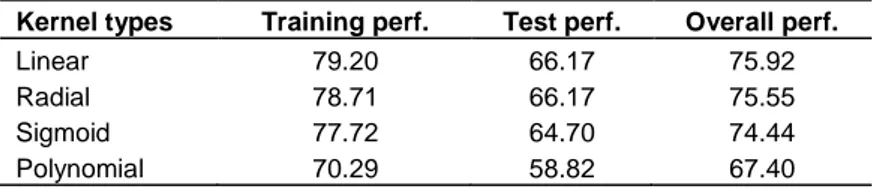
The overall performance results on the data set which contains variables chosen by feature selection process are very close to the results of entire data set. In the light of entire data set solution, linear and radial type kernel SVM models hold the best performance results (Table 7). All of the ANN models have very similar training and testing results as seen on entire data set. Among the models which were implemented on subset containing best 5 variables, MLP 5-10-2 model has the highest rate (Table 8).
CONCLUSION
The results of entire and feature selection data set are
Table 6. Results of feature selection process.
Selected variables Chi-square p-value
Change in stock price 85.25909 0.000000 Market to book value 24.56219 0.000411 Return on equity 10.65341 0.030748 Equity growth 14.84536 0.062223 Earnings per share 11.98957 0.100902
very close to each other. This concludes that a model constructed by using smaller number of variables also gives similar results. In this way, dependent variable can be represented by a less complex model.
When 2002 to 2007 periods are used for training, SVM and ANN methods give very high training performances. The training set contains consecutive data. Due to this time effect, models learn training data quite well and this provides a high training performance compared to training set performance which selected randomly from entire data set.
Table 7. Performance results of SVM models on feature selected data set.
Kernel types Training perf. Test perf. Overall perf.
Linear 79.20 66.17 75.92
Radial 78.71 66.17 75.55
Sigmoid 77.72 64.70 74.44
Polynomial 70.29 58.82 67.40
perf., performance
Table 8. Performance results of ANN models on feature selected data set.
Model Network Training perf. Test perf. Overall perf.
1 MLP 5-10-2 79.89 87.03 83.46 2 MLP 5-3-2 81.48 85.18 83.33 3 MLP 5-5-2 80.95 85.18 83.06 4 MLP 5-7-2 78.83 85.18 82.01 5 MLP 5-5-2 78.83 85.18 82.01 perf., performance
However, SVM and ANN methods give reasonable results for the stock selection problem by adding technical indicators, but more robust models can be obtained for further research.
REFERENCES
Albadvi A. Haharsooghi SK, Esfahanipour A (2007). Decision making in stock trading: An application of PROMETHE. Eur. J. Oper. Res., 177(2): 673-683.
Amayri O, Bouguila N (2009). Online spam filtering using support vector machines. IEEE Symposium on Computers and Communications ISCC, 2009: 337 – 340.
Bai X, Tian Z (2009). Medical Images Classification Based on Least Square Support Vector Machines. International Conference on Computational Intelligence and Software Engineering CISE. 1 – 4. Bin Y, Zhongzhen Y, Baozhen Y (2006). Bus Arrival Time Prediction
Using Support Vector Machines. J. Intell. Transp. Syst., 10(4): 151– 158.
Bishop C (1995). Neural Networks for Pattern Recognition. Oxford University Press.
Calvo RA, Williams K (2002). Automatic Categorization of Announcements on the Australian Stock Exchange. Proceedings of the 7th Australasian Document Computing Symposium. Sydney, pp. 89–92.
Changsheng X, Maddage NC, Xi S, Fang C, Qi T (2003). Musical genre classification using support vector machines. IEEE Int. Conf. Acousti. Speech Signal Process. Proc., 5: 429-432.
Changxue M, Randolph MA, Drish J (2001). A support vector machines-based rejection technique for speech recognition. IEEE Int. Conf. Acoust. Speech Signal Process. Proc., 1: 381 – 384.
Chen WH, Jen-Ying S, Soushan WU (2006). Comparison of support-vector machines and back propagation neural networks in forecasting the six major Asian stock markets. Int. J. Electron. Finan., 1: 49-67. Chen WH, Shih JY (2006). A study of Taiwan’s issuer credit rating
systems using support vector machines. Expert Systems with Applications. 30: 427–443.
Cortes C, Vapnik V (1995). Support Vector Networks, Machine Learning. Kluwer Academic Publishers. Boston. 273-297.
Dincer H, Hacioglu U (2009). Finansa Giriş. Beta Yayinevi. İstanbul.
Drucker H, Donghui W, Vapnik V (1999). Support Vector Machines for Spam Categorization. IEEE Trans. Neural Netw., 10(5).
Eakins SG, Stansell SR (2003). Can value-based stock selection criteria yield superior risk-adjusted returns: an application of neural networks, Int. Rev. Financ. Anal., 12(1): 83-97.
Engelbrecht AP (2007). Computational Intelligence An Introduction. Second Edition. John Wiley & Sons Ltd.
Fan A, Palaniswami M (2001). Stock selection using support vector machines. IJCNN'01: Int. Joint Conf. Neural Netw., 3: 1793-1798. Gavrishchaka VV, Supriya BG (2003). Volatility forecasting from
multiscale and high-dimensional market data. Neurocomputing, 55(1-2): 285-305.
Gexiang Z, Weidong J, Laizhao H (2004). Radar emitter signal recognition based on support vector machines, Control, Automation. Robot. Vision Conf., 2: 826 – 831.
Guo-Rui J, Pu H, Yong-Jie Z, Wind Speed Forecasting Based on Support Vector Machine with Forecasting Error Estimation. International Conference on Machine Learning and Cybernetics, pp. 2735 – 2739.
Haiqin Y, Chan L, King I (2002). Support Vector Machine Regression for Volatile Stock Market Prediction. In: Intelligent Data Engineering and Automated Learning: IDEAL, pp. 391-396.
Hart J, Slagter E, Dijk D (2003). Stock selection strategies in emerging markets. J. Empirical Finan., 10(1-2): 105-132.
Huang Z et al ( 2004). Credit rating analysis with support vector machines and neural networks: a market comparative study. Decis. Support Syst., 37(4): 543-558.
Huang CL, Chen MC, Wang CJ (2007). Credit scoring with a data mining approach based on support vector machines. Expert Syst. Appl., 33: 847–856.
Huang W, Nakamori Y, Wang SY (2005). Forecasting stock market movement direction with support vector machine. Comput. Oper. Res., 32(10): 2513-2522.
Jing S, DeSheng W, GuangRui L (2009). An Efficient Guide Stars Classification Algorithm via Support Vector Machines. Second Int. Conf. Intell. Comput. Technol. Autom., 1: 148–152.
Kamruzzaman J, Ruhul AS, Iftekhar A (2003). SVM Based Models for Predicting Foreign Currency Exchange Rates. Proc. Third IEEE Int. Conf. Data Mining, 557-560.
Liu Taian; Xue X, Liu X, Zhao H (2009). Application Research of Support Vector Regression in Coal Mine Ground-Water-Level Forecasting. Int. Forum Inform. Technol. Appl., 2: 507 – 509.
Lovell BC, Walder CJ (2006). Support Vector Machines for Business Applications, Business Applications and Computational Intelligence. Hershey, PA., U.S.A.: Idea Group, pp. 267-290.
Ongsritrakul P, Soonthornphisaj N (2003). Apply decision tree and support vector regression to predict the gold price. Proceedings of the International Joint Conference on Neural Networks. 4: 2488-2492. Osuna EE, Freund R, Girosi F (1997). Support Vector Machines Training and Applications, A.I Memo No:1602 March 1997 C.B.C.L Paper No 144.
Pal M, Mather PM (2005). Support vector machines for classification in remote sensing. International Journal of Remote Sensing. 26(5): 1007-1011.
Pan H, Duan Y, Tan L (2009). Application for Web Text Categorization Based on Support Vector Machine. Int. Forum Comput. Sci. Technol. Appl., 2: 42 – 45.
Quah T-S (2008). DJIA stock selection assisted by neural network. Expert Syst. Appl., 35(1-2): 50-58.
Reljin N, Pokrajac D (2008). Classification of performers using support vector machines. 9th Symposium on Neural Network Applications in Electrical Engineering NEUREL, pp. 165–169.
Sansom DC, Downs T, Saha TK ( 2003). Evaluation of support vector machine based forecasting tool in electricity price forecasting for Australian national electricity market participants. J. Electric Electron. Eng., 22(3): 227-234.
Sheng X, Hui-Fang Z, Jie Liu, Xiang S. Modeling and Forecasting of High-Technology Manufacturing Labor Productivity Based on Grey Support Vector Machines with Genetic Algorithms. Int. Conf. Machine Learn. Cybern., pp. 2419 – 2424.
Shin KS, Taik SL, Hyun-jung K ( 2005). An application of support vector machines in bankruptcy prediction model. Expert Syst. Appl., 28(1): 127-135.
Shu-xia Y, Yi W (2006). Applying Support Vector Machine Method to Forecast Electricity Consumption. Int. Conf. Comput. Intell. Secur., 1: 929–932.
Tay FEH, Lijuan C (2001). Application of support vector machines in financial time series forecasting. Omega, 29: 309–317.
Tian J, Ga M, Zhou S (2009). The Research of Building Logistics Cost Forecast Based on Regression Support Vector Machine. International Conference on Computational Intelligence and Security CIS '09. 1: 648 – 652.
Tirkayi F, Ahlatcioglu M (2005). Fuzzy stock selection using a new fuzzy ranking and weighting algorithm. Appl. Math. Comput., 170(1): 144-157.
Vapnik V (1998). Statistical Learning Theory. Wiley. New York. Wong FS, Wang PZ (1991). A stock selection strategy using fuzzy
neural Networks. Neurocomputing, 2(5-6): 233-242.
Xidonas P, Ergazakis E, Ergazakis K, Metaxiotis K, Askounis D, Mavrotas G, Psarras J (2009). On the selection of equity securities: An expert systems methodology and an application on the Athens Stock Exchange. Expert Syst. Appl., 36(9): 11966-11980.
Zaim A, Taeil Y, Keck R (2007). Feature-Based Classification of Prostate Ultrasound Images using Multiwavelet and Kernel Support Vector Machines. International Joint Conference on Neural Networks. IJCNN, pp. 278–281.
Zai-Wen W, Chao-Lin Z, Chen S, Cong-Lan C (2009). On Modeling of Atmospheric Visibility Classification Forecast with Nonlinear Support Vector Machine. Fifth International Conference on Natural Computation ICNC '09, 2: 240-244.
Zhang Q (2007). Gene Selection and Classification Using Non-linear Kernel Support Vector Machines Based on Gene Expression Data. EEE/ICME Int. Conf. Complex Med. Eng., pp. 1606–1611.
Zhenguo C, Guanghua Z (2009). Support Vector Machines Improved by Artificial Immunisation Algorithm for Intrusion Detection. International Conference on Information Engineering and Computer Science ICIECS, pp. 1–4.
Zhou D, Feng G, Xiaohong G (2004). Application of accurate online support vector regression in energy price forecast. Fifth World Congress on Intelligent Control and Automation WCICA, 2: 1838-1842.