Investigation of magnetic resonances for different
split-ring resonator parameters and designs
To cite this article: Koray Aydin et al 2005 New J. Phys. 7 168
View the article online for updates and enhancements.
Metamaterials with negative permeability and negative refractive index: experiments andsimulations
Ekmel Ozbay, Kaan Guven and Koray Aydin
-Left-handed metamaterials
M Kafesaki, Th Koschny, R S Penciu et al.
-Transmission characteristics of bianisotropic metamaterials based on omega shaped metallic inclusions Koray Aydin, Zhaofeng Li, M Hudlika et al.
-Recent citations
USING HOMOGENEOUS EQUIVALENT PARAMETERS IN FINITE ELEMENT MODELS OF CURVED METAMATERIAL STRUCTURES
Richard Mattish et al
-Plasmonic Resonances in Sub-Terahertz Fishnet Metamaterial Based on Complementary Hexagonal Resonator Yahya Yüksek et al
-Chiral Assemblies of Achiral Dielectric Nanoparticles: Semianalytical Approach Haobijam Johnson Singh and Ambarish Ghosh
-Investigation of magnetic resonances for different
split-ring resonator parameters and designs
Koray Aydin1,5, Irfan Bulu1, Kaan Guven1, Maria Kafesaki2, Costas M Soukoulis2,3 and Ekmel Ozbay1,4
1Department of Physics, Bilkent University, Bilkent, 06800 Ankara, Turkey 2Institute of Electronic Structure and Laser (IESL), Foundation for Research and Technology-Hellas (FORTH), Heraklion, Crete, Greece
3Ames Laboratory-USDOE and Department of Physics and Astronomy, Iowa State University, Ames, IA 50011, USA
4Nanotechnology Research Center, Bilkent University, Bilkent, 06800 Ankara, Turkey
E-mail:[email protected] New Journal of Physics 7 (2005) 168
Received 31 March 2005 Published 8 August 2005 Online athttp://www.njp.org/
doi:10.1088/1367-2630/7/1/168
Abstract. We investigate the magnetic resonance of split-ring resonators (SRR) experimentally and numerically. The dependence of the geometrical parameters on the magnetic resonance frequency of SRR is studied. We further investigate the effect of lumped capacitors integrated to the SRR on the magnetic resonance frequency for tunable SRR designs. Different resonator structures are shown to exhibit magnetic resonances at various frequencies depending on the number of rings and splits used in the resonators.
5 Author to whom any correspondence should be addressed.
1. Introduction 2 2. Identifying the magnetic resonance of SRRs 3 3. Changing the magnetic resonance frequency of conventional SRRs 5
3.1. Effect of split width . . . 6
3.2. Effect of gap distance . . . 7
3.3. Effect of metal width . . . 8
3.4. Effect of additional capacitance . . . 9
4. Different resonator structures 10 4.1. Single ring resonator with splits . . . 10
4.2. SRRs with two and four splits . . . 12
4.3. Comparison . . . 13
5. Conclusions 14
Acknowledgments 14
References 14
1. Introduction
Left-handed metamaterials (LHM) have received considerable interest due to their unique physical properties. Two important parameters, dielectric permittivity (ε) and magnetic permeability (µ) together determine the response of any material to the electromagnetic (EM) wave. Usually, ε and µ are both positive in ordinary materials. For certain artificial structures, however, both the effective permittivity (εeff) and effective permeability (µeff) can have negative values. In such media, the electric, magnetic and wavevector components form a left-handed (LH) coordinate system, hence the name LH material is used for their description. The index of refraction is less than zero for LHMs, therefore the phase and group velocities are orientated in opposite directions such that the direction of propagation is reversed with respect to the direction of energy flow [1]. This phenomenon was first proposed by Veselago in 1968, who had also investigated various optical properties of the negative refractive index structures [1]. An array of split-ring resonators (SRRs) is shown to exhibit a negative µeff for frequencies close to the magnetic resonance frequency (ωm) of the SRR structures [2]. Periodically arranged thin metallic wires are used as negative εeff media, since dielectric permittivity is less than zero below the plasma frequency [3]. Experimental investigation of LHMs is done by constructing a composite metamaterial (CMM) consisting of two components which have ε(ω) < 0 and µ(ω) < 0 simultaneously over a certain frequency range [4]–[9].
SRRs, being essential components of LHMs, are studied extensively in the literature. Transmission characteristics of periodic [4]–[11] and disordered SRRs [12] are reported. There are also numerical simulations to study the properties of transmission spectra [13]–[16], effective parameters [17]–[19], and magnetic resonances of SRRs [20]–[22]. Several analytical models are reported for a better understanding of SRRs’ resonance behaviours [23]–[27]. The studies on SRRs and metamaterials are mainly performed in the gigahertz (GHz) frequency regime, but recently magnetic resonances of SRRs at terahertz (THz) frequencies have been obtained both experimentally and theoretically [28,29].
(a) (b)
t w t w
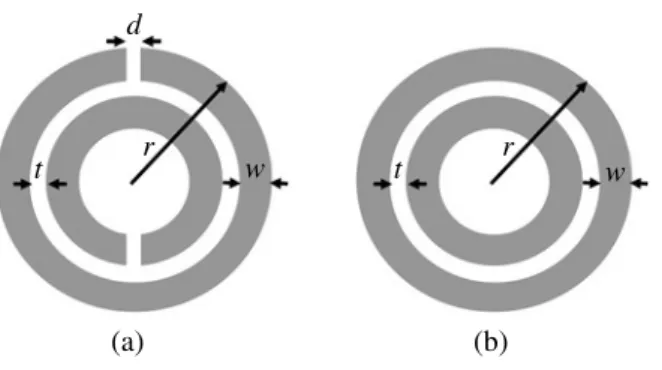
Figure 1. Schematic drawings of (a) single unit cell of SRR and (b) single unit cell of CRR.
The LH pass band frequency (i.e. the negative refractive index regime) is essentially determined by the ωmof periodic SRR structures. Tuning the ωmof SRRs will give an opportunity to have negative refractive media available at the desired range of frequencies. In this paper, we investigate the effect of SRRs’ geometrical parameters and different resonator designs on the magnetic resonance frequency. Our study covers the change of ωm with the split width, gap between inner and outer rings, metal width, and additional capacitances. We also investigated different resonator structures with different number of splits on the rings. Experimental and numerical results are provided throughout the paper and the agreement between simulations and measurements is quite good.
2. Identifying the magnetic resonance of SRRs
The band gaps observed in the transmission spectrum of SRR media were attributed to strong magnetic response of SRRs [4]–[7]. Similar to the dielectric response of periodic wire structures, a periodic SRR structure exhibits an electric resonance by the dipole-like charge distribution along the incident electric field [8,19]. Therefore, a band gap in the transmission spectrum of periodic SRR medium may be due to negative ε or negative µ or due to the periodicity.
The SRR structure proposed by Pendry et al [3] is commonly used in LHM studies [4]–[11]. This structure (see figure1(a)) consists of two concentric rings separated by a gap, both having splits at opposite sides. Magnetic resonance is induced by the splits at the rings and by the gap between the inner and outer rings [3]. The effect of these parameters will be studied in detail later, but to come up with a better understanding of magnetic resonances one has to be sure about the reason for the band gap observed in the transmission spectra. The ambiguity in the reasoning for band gaps of periodic SRR media can be lifted by using a closed-ring resonator (CRR) structure in which the splits in the ring resonators are removed (figure 1(b)). The CRR structure will destroy the magnetic resonance but still keep the electric resonance. A frequency gap present in the transmission spectrum of SRR medium, but not in that of the CRR medium, will then correspond to µ < 0.
The SRR (figure1(a)) and CRR (figure1(b)) units are fabricated on FR4 circuit boards with a copper layer of thickness 30 µm deposited on the board. The geometrical parameters of the SRR are d= t = 0.2 mm, w = 0.9 mm and r = 3.6 mm as shown in figure1(a). The circuit board has a thickness 1.6 mm and dielectric constant of ε= 3.85. SRR units are arranged periodically with 10,
–10 –20 –30 –40 Transmission (dB) –50 3 4 5 6 (b) (a) x y z 7 8 Frequency (GHz) 9 10 11 12 13 SRR CRR 14 15
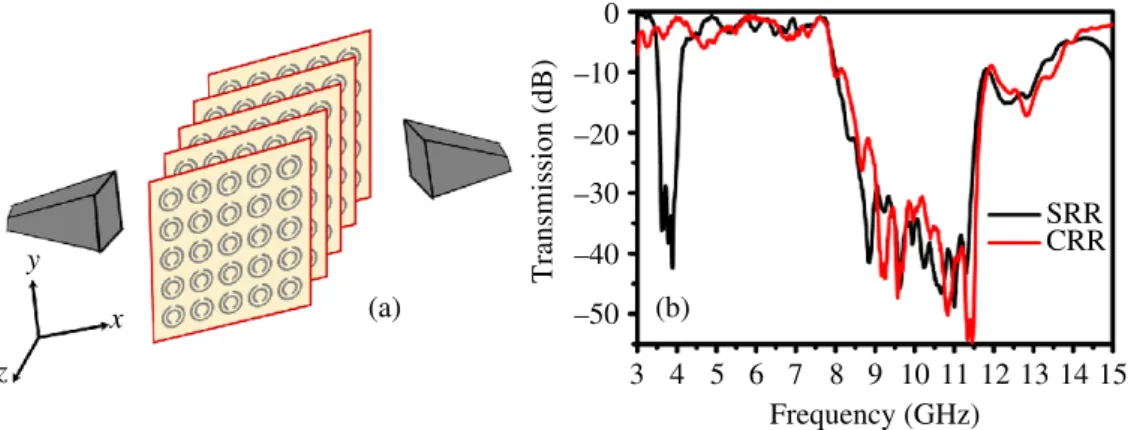
Figure 2. (a) Schematic drawing of experimental setup for measuring transmission through periodic arrays of SRRs. (b) Measured transmission spectra of periodic arrays of SRR (black) and CRR (red) structures.
15 and 18 unit cells in the x-, y- and z-direction (figure2(a)), respectively. The dimensions of a unit cell containing a single SRR are ax= ay= 8.8 mm and az= 6.5 mm. Transmission measurements are performed in free space using HP 8510-C network analyser. A set of horn antennas are used as transmitter and receiver and transmission through the sample is then measured (figure 2(a)). Figure2(b) displays the measured transmission spectra of periodic SRRs and CRRs between 3 and 15 GHz. The first bandgap (3.55–4.05 GHz) of the SRR medium is not present in the CRR medium, indicating µ < 0 at that frequency region, whereas the second bandgap (8–12 GHz) is present for both the SRR medium and CRR medium. This measurement clearly shows that not all of the stop bands of an SRR medium can be assumed as ‘negative µ’ behaviour.
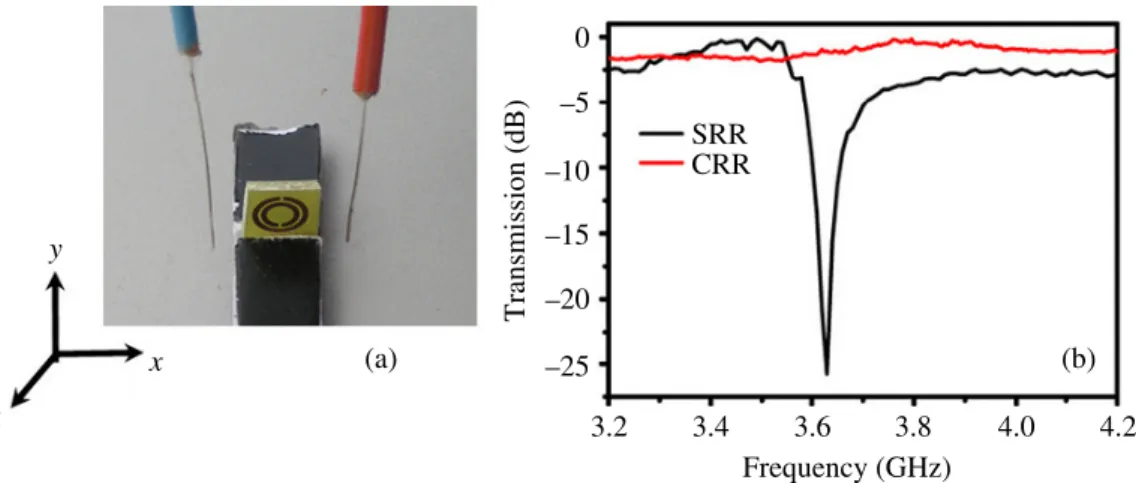
By using the approach explained above, it is also possible to identify the magnetic resonance of a single unit cell of SRR structure. Even a single SRR unit cell has a strong response to EM wave due to magnetic resonance [20]. A dip in the transmission spectrum of SRR structure can be attributed to the resonant nature of SRRs. In order to determine the frequency of magnetic resonance, we measured the transmission through a single unit cell of SRR and CRR. Two monopole antennas are used to transmit and detect the EM waves through the single SRR unit cell. SRRs are displaced between the monopole antennas as shown in figure 3(a). The distance between the monopole and SRR unit cell is 0.5 cm. Throughout this work, we investigated resonators operating at three different frequency ranges (1.2–6, 7–9.5 and 12–15 GHz), and therefore we used three different sizes of monopole antennas. The length of the monopole antennas are λ/2, arranged to work at the frequency range covering the ωmof the SRR structures. The incident field propagates along the x-direction, with E and H along the y- and z-direction, respectively. Monopole antennas are then connected to the HP-8510 C network analyser to measure the transmission coefficients. Firstly, we measured the transmission spectra in free space (i.e. without the SRR unit cell). These data was used as the calibration data for the network analyser. Then we inserted the SRR unit cell between the monopole antennas, and we performed the transmission measurements by maintaining the distance between the transmitter and receiver monopole antennas fixed.
Figure 3(b) shows the measured transmission spectra for single SRR and single CRR structures. An SRR structure has a dip at 3.63 GHz, whereas for a CRR structure the wave is completely transmitted. Therefore, ωmof an individual SRR is found to be 3.63 GHz. Notice
CRR –10 –15 Transmission (dB) –20 –25 (a) y x z 3.2 3.4 3.6 Frequency (GHz) 3.8 (b) 4.0 4.2
Figure 3. (a) Experimental setup for measuring transmission through a single unit cell of the SRR structure. The structure is placed between two monopole antennas. (b) Measured transmission spectra of single unit cells of SRR (black) and CRR (red) structures.
that the wavelength is 8.26 cm, whereas the diameter of the SRR structure is 7.2 mm. Therefore, by using an SRR structure with sizes corresponding to 1/11 of free space wavelength, magnetic resonance can be obtained. The wavelength in the material (4.2 cm) is even 1/6 of the structure size.
SRR structures having exactly the same design and parameters reported in this section are previously shown to exhibit true LH behaviour for one-dimensionally (1D) and 2D constructed LHMs, when combined with a proper negative permittivity medium of periodic wires [8, 9]. Also negative refraction and negative phase velocity of LHMs [9] and disorder in these SRR and LHM structures are studied [12]. LH transmission band and negative refraction are observed at the frequencies where both εeff and µeff are both simultaneously negative. Since the frequency ranges where SRR structures possess negative values of permeability are not broad, one may need to tune the magnetic resonance frequency of SRRs in order to obtain LHMs working at desired frequencies. The next section is devoted to the effects of the geometrical parameters and lumped capacitors on the ωmof conventional SRRs.
3. Changing the magnetic resonance frequency of conventional SRRs
The SRR structure has capacitive elements that increase the response of the material to the incident EM radiation. Capacitance due to the splits prevents current from flowing around the rings but the mutual capacitance between the two rings enables the flow of the current through the structure [3]. There are several analytical models in the literature studying the magnetic and electrical resonances of SRRs. It is possible to model an individual SRR as an L–C circuit system [24]–[26]. Total capacitance of the SRR system has mainly two contributions, one arising from the splits and the other from the gap between the concentric rings. Inductances arise from the conducting rings and gap between inner and outer rings [25]. In this section, we will investigate certain geometrical parameters like split width, gap between the rings, metal width and additional capacitors and their effect on ωm.
–5 –10 –15 Transmission (dB)–20 –25 –5 –10 –15 Transmission (dB) –20 –25 3.4 3.5 (b) (a) d = 0.2 mm d = 0.3 mm d = 0.4 mm d = 0.5 mm d = 0.2 mm d = 0.3 mm d = 0.4 mm d = 0.5 mm 3.6 3.7 Frequency (GHz) 3.8 3.9 4.0 4.1 4.2 3.4 3.5 3.6 3.7 Frequency (GHz) 3.8 3.9 4.0 4.1 4.2
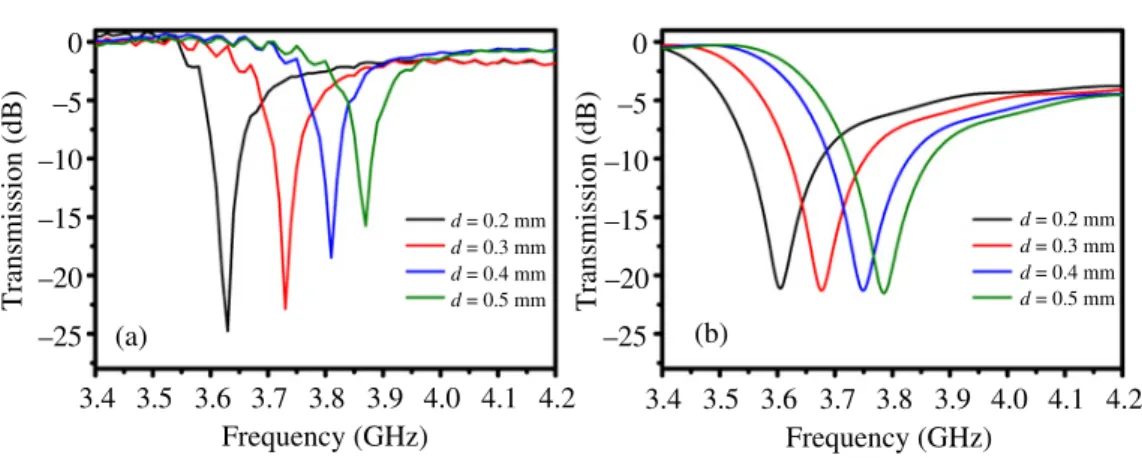
Figure 4. Transmission spectra of individual SRRs with different split widths obtained via (a) experiment and (b) simulation.
3.1. Effect of split width
Schematic drawing of an individual SRR is given in figure1(a), with the parameters split width (d), gap distance (t), metal width (w) and radius of the outer ring (r). Initially the parameters are taken to be d= t = 0.2 mm, w = 0.9 mm and r = 3.6 mm. By keeping other parameters constant, we only changed the split width (d) of SRRs.
Figure4(a) displays the measured transmission spectra of four SRR structures with different split widths (d= 0.2, 0.3, 0.4 and 0.5 mm). A dip in the transmission spectra was observed for all SRR structures. As seen in figure4(a) values >0 dB were obtained from measurements. This is essentially related to two effects. One is related to the presence of dielectric board which, due to higher index of refraction, causes local confinement of the emitted signal by refraction through the board, and by the diffraction at the edges of the board. The other reason is that the presence of resonant structure (namely SRR) enhances the field locally compared to free space propagation. We also performed simulations to check the experimental results. Simulations are done by using CST Microwave studio. CST Microwave Studio is a 3D fullwave solver and employs finite integration method [30]. In order to determine the resonance frequencies of the structures under consideration, we have included one layer of the considered structures along the propagation direction. In the simulation setup, the structures are subjected to an incident plane wave. Open boundary conditions are employed along the propagation direction. Periodic boundary conditions are used along the directions other than the propagation direction. Hence, the structure is assumed to be periodic and infinite along the directions that are perpendicular to the propagation direction. The transmission amplitudes are obtained by using the fields at a distant point from the structures. This point was chosen such that beyond this point the transmission coefficients do not change with increasing distance. Such a choice was made to exclude the near-field effects due to the highly resonant nature of the structures under consideration. Figure4(b) shows the simulated transmission spectra and there is a good agreement between experimental results and numerical simulations.
Measurements and simulations were performed on 14 different SRR samples with split widths changing with 0.05 mm steps between 0.15 and 0.80 mm. Variation of magnetic resonance frequency of SRR with different split widths of SRRs are given in figure 5. Experiments (black) and simulations (red) show that increasing the split widths increases the ωmof the SRR structure.
Experiment Simulation 0.8 0.1 3.5 3.6 Frequenc y (GHz) 3.7 3.8 0.2 0.3 0.4 0.5 Split width (mm) 0.6 0.7
Figure 5. Variation of magnetic resonance frequencies of individual SRRs with split widths obtained by experiments (black) and simulations (red).
0 –5 –10 –15 Transmission (dB) –20 –25 0 –5 –10 –15 Transmission (dB) –20 –25 3.4 3.6 (b) (a) 3.8 4.0 Frequency (GHz) 4.2 4.4 t = 0.2 mm t = 0.3 mm t = 0.4 mm t = 0.5 mm t = 0.2 mm t = 0.3 mm t = 0.4 mm t = 0.5 mm 4.6 4.8 3.4 3.6 3.8 4.0 Frequency (GHz) 4.2 4.4 4.6 4.8
Figure 6. Transmission spectra of individual SRRs with different gap distances obtained via (a) experiment and (b) simulation.
The splits behave like a parallel plate capacitor. We can think of two metal plates of thickness 30 µm and width 0.9 mm are placed with a distance d between them. As we increase the split width, the capacitance due to splits will decrease, which in turn will decrease the total capacitance of the system. Previously developed analytical models of SRRs [25,26] predict the same behaviour: decreasing the capacitance of the system will increase the resonance frequency. Therefore, experimental results and simulations provied in this section agree well with the analytical models in the literature [25,26].
3.2. Effect of gap distance
In this section, we studied the effect of gap between inner and outer rings on ωmof SRR structures. The other parameters are kept constant (d= 0.2 mm, w = 0.9 mm and r = 3.6 mm), and only the gap distance (t) is varied from 0.2 to 0.6 with 0.05 mm steps. Since we fixed the radius of the outer ring, increasing the gap distance will also decrease the size of the inner ring.
Figure6displays the measured and simulated transmission spectra of SRRs with different gap distances. Resonant behaviour is observed both experimentally and numerically at similar frequencies. Variation of magnetic resonance frequency of SRR with different gap distances of
4.0 3.9 3.8 Frequency (GHz) 3.7 3.6 3.5 0.2 0.3 0.4 Gap Distance (mm) 0.5 Experiment Simulation 0.6
Figure 7. Variance of magnetic resonance frequencies of individual SRRs with gap distances obtained by experiments (black) and simulations (red).
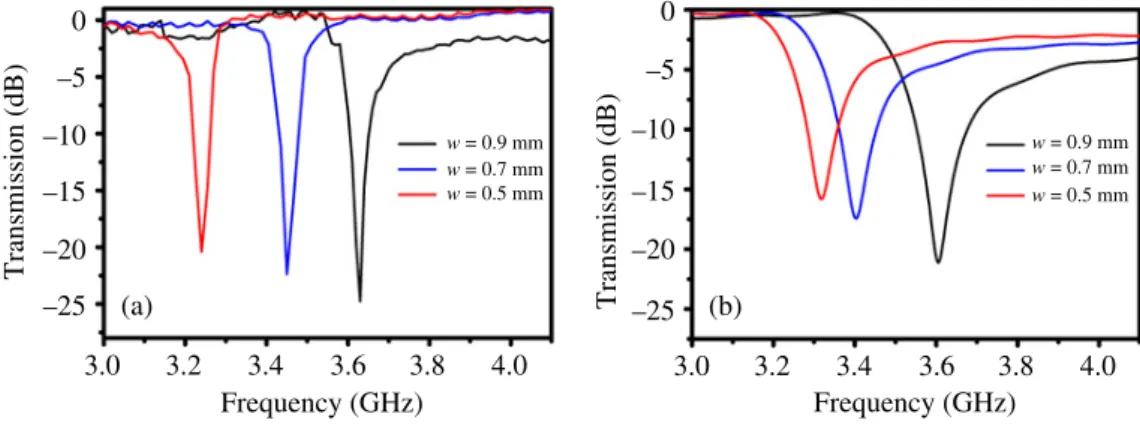
0 –5 –10 –15 –20 Transmission (dB) –25 0 –5 –10 –15 –20 Transmission (dB) –25 3.0 (b) 3.2 3.4 w = 0.9 mm w = 0.7 mm w = 0.5 mm w = 0.9 mm w = 0.7 mm w = 0.5 mm 3.6 Frequency (GHz) 3.8 4.0 3.0 (a) 3.2 3.4 3.6 Frequency (GHz) 3.8 4.0
Figure 8. Transmission spectra of individual SRRs with different metal widths obtained via (a) experiment and (b) simulation.
SRR structures are provided in figure 7. Results of experiments (black) and simulations (red) show that increasing the distance between the inner and outer rings, results in an increase of the magnetic resonance frequency of SRR structure.
Changing the distance between the inner and outer rings will change the mutual capacitance and mutual inductance between the rings. An analytical model by Sauivac et al [25] proposes that increasing the gap distance, decreases both mutual capacitance and mutual inductance of the equivalent L–C circuit of SRR system. By following the formulation of the model given in [25],
ωmis found to increase with increasing gap distances, that agrees with the results of experiments and simulations (figure7).
3.3. Effect of metal width
In this section, we changed the metal width of both inner and outer rings. The other parameters are kept constant (d= t = 0.2 mm and r = 3.6 mm). Keep in mind that by fixing the radius of the outer ring, the size of the inner ring is larger for narrower ring configurations.
Figure8displays the measured and simulated transmission spectra of SRR structures with different metal widths (w= 0.5, 0.7 and 0.9 mm). Both experiments and simulations predict
1.2 –25 –20 –15 Transmission (dB) –10 –25 –20 –15 Transmission (dB) –10 1.4 1.6 C=0.1 pF C=0.2 pF C=0.3 pF C=0.5 pF C=0.8 pF C=0.1 pF C=0.2 pF C=0.3 pF C=0.5 pF C=0.8 pF 1.8 2.0 Frequency (GHz) 2.2 2.4 2.6 2.8 3.0 (b) (a) 3.2 1.2 1.4 1.6 1.8 2.0 Frequency (GHz) 2.2 2.4 2.6 2.8 3.0 3.2
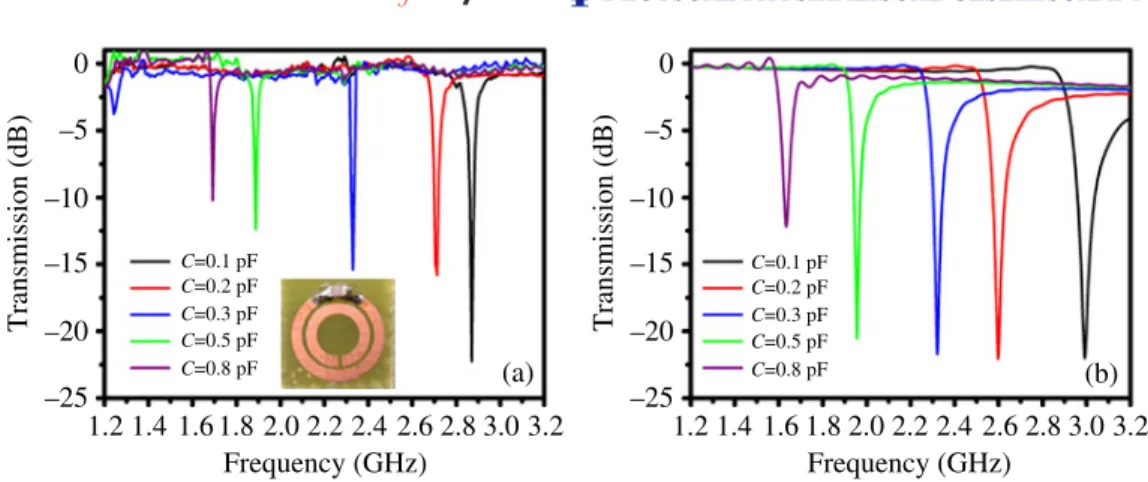
Figure 9. Transmission spectra of individual SRRs with different additional capacitances obtained via (a) experiment and (b) simulation.
that ωm increases with increasing metal width. Metal width affects all capacitances and inductances due to the analytical model of Sauivac et al [25]. Increasing the metal width will decrease the mutual inductance and mutual capacitance. Therefore, SRRs made of thinner rings will have smaller resonant frequencies. This result agrees with both experiment and simulations reported in this section.
3.4. Effect of additional capacitance
Up to this point, we only investigated the effect of geometrical parameters of individual SRRs. In this section, we changed the capacitance of the system by integrating additional capacitors to SRR structures. Surface-mount capacitors varying from 0.1 to 1.0 pF are mounted on the outer ring of SRRs in parallel.
Figure 9 gives the measured and simulated transmission spectra of five different SRRs with different additional surface-mount capacitors. Without any additional capacitor, ωm of the SRR structure was measured to be 3.63 GHz (figure 3(b)). Magnetic resonance frequency significantly shifts to 2.87 GHz when a capacitor of C= 0.1 pF is mounted on the outer ring (figure9(a)). The magnetic frequency can be tuned to as low as 1.63 GHz by using a C= 0.8 pF capacitor. As seen in figure 9, experimental and theoretical results agree quite well with each other.
It was discussed in section 3.1 that when the capacitance of an SRR system increases,
ωm decreases. By mounting additional capacitors to the system, the total capacitance was significantly increased. Experimental and numerical simulation results (figure 10) verify the theory and analytical models. The agreement between measurements and simulations is quite good.
By using surface mount varactors, it is possible to tune the capacitance on the splits by changing the applied voltage to the varactor. Therefore, tuning by varactor will give rise to higher capacitances which in turn will reduce the magnetic resonance frequency further. It becomes possible to obtain smaller resonance frequencies without using larger structures.
Experiment Simulation 0.0 1.5 2.0 Frequency (GHz) 2.5 3.0 0.2 0.4 0.6 Additional Capacitance (pF) 0.8 1.0
Figure 10. Variance of magnetic resonance frequencies of individual SRRs with additional surface mount capacitors obtained by experiment (black) and simulations (red).
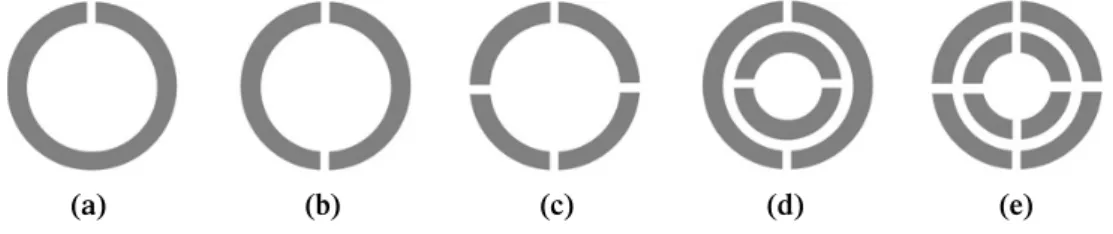
(a) (b) (c) (d) (e)
Figure 11. Schematic drawings of different resonator structures: (a) single ring with one cut, (b) single ring with two cuts, (c) single ring with four cuts, (d) SRR with two cuts and (e) SRR with four cuts.
4. Different resonator structures
In this section, we studied different resonator structures, such as single rings and SRRs with more splits (figure11). There is a need for new resoantor designs for the following reasons: first of all, a conventional SRR structure is not easy to fabricate for operation at higher frequencies. As the structure is scaled down, the dimensions of the narrow split and gap regions will be very small, which may eventually lead to contact problems between the metallic regions. Conventional SRR structures have been fabricated for operation at a few THz [28] but for the resonator structure working at 100 THz [29] a single ring with a single split is chosen for its ease of fabrication. The second reason is that SRR structures are electrically resonant for different polarizations and propagation directions [17]. This effect will suppress the LH behaviour for 3D constructed LHMs, where EM waves will be incident on the structure from all directions. Therefore, additional splits should be added to destroy the electrical coupling effect to the magnetic resonance.
4.1. Single ring resonator with splits
Besides the conventional SRR design [3], where two concentric rings with splits oriented at opposite sides are employed, it is also possible to obtain magnetic resonance for single ring with a split [26, 29]. In this section, we investigated the resonance frequencies of single rings with
−15 −20 −25 −30 −35 −15 −20 −25 −30 −35 3 4 5 6 7 8 Frequency (GHz) Transmission (dB) Transmission (dB) Frequency (GHz) 9 10 11 12 13 1 cut Ring 2 cut Ring 4 cut Ring 1 cut Ring 2 cut Ring 4 cut Ring 14 15 (a) (b) 3 4 5 6 7 8 9 10 11 12 13 14 15
Figure 12. Transmission spectra of single-ring resonator with different number of cuts obtained via (a) experiment and (b) simulation.
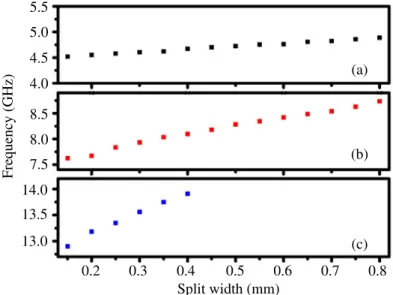
5.5 5.0 4.5 4.0 8.5 8.0 Frequency (GHz) 7.5 14.0 13.5 13.0 0.2 0.3 0.4 Split width (mm) 0.5 0.6 0.7 0.8 (c) (b) (a)
Figure 13. Variation of magnetic resonance frequency with the split width of (a) the one-cut ring resonator, (b) two-cut ring resonator and (c) four-cut ring resonator.
one, two or four cuts (splits), and change of ωmwith the split width. The structures studied in this section are one-cut ring (figure11(a)), two-cut ring (figure11(b)) and four-cut ring (figure11(c)) resonators. The radius of all the rings are same with the SRR structure investigated in section
3. The split width is initially taken to be d= 0.2 mm. For two- and four-cut rings, the width of all splits are equal. Measured transmission spectra of these structures are provided in figure
12(a). As seen from the figure, all structures show resonant behaviour at certain frequencies. Simulation results are provided in figure12(b) and experimental results are compared with the simulations. The resonance frequency of one-cut ring is measured to be 4.58 GHz, whereas numerical simulations predict it to be 4.67 GHz. For two-cut and four-cut ring resonators, measured and simulated resonance frequencies are 7.82 and 7.5 GHz; and 12.9 and 13.1 GHz, respectively.
We then varied the split width of these single-ring resonators. Figure13shows the measured resonance frequencies as a function of split width. In all cases, the magnetic resonance frequency
3 –35 –30 Transmission (dB) –25 –20 –15 –10 –30 Transmission (dB) –25 –20 –15 –10 4 (b) (a) 5 6 7 8 9 10 Frequency (GHz) 1 cut SRR 2 cut SRR 4 cut SRR 1 cut SRR 2 cut SRR 4 cut SRR 11 12 13 14 15 3 –35 4 5 6 7 8 9 10 Frequency (GHz) 11 12 13 14 15
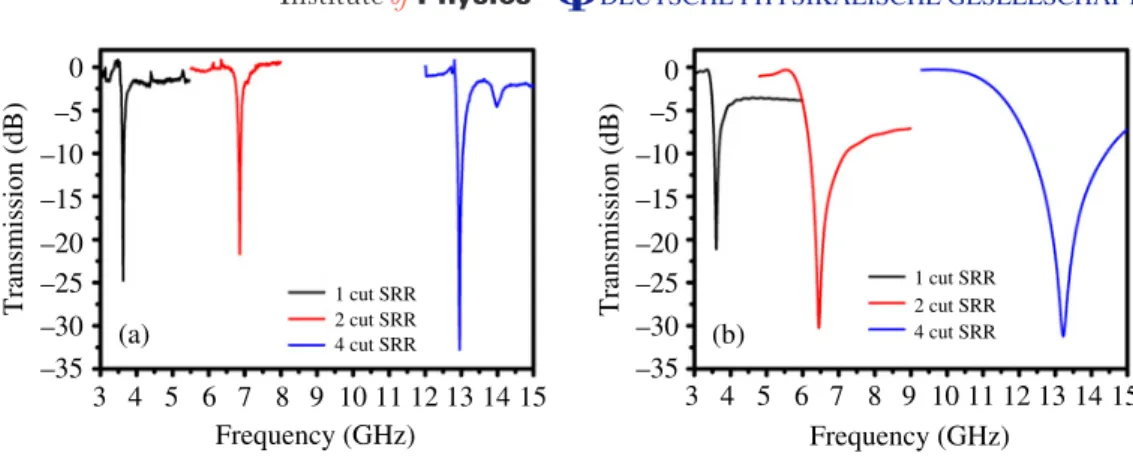
Figure 14. Transmission spectra of SRRs with different number of cuts obtained via (a) experiment and (b) simulation.
increases with increasing split width, which is an expected result due to the reasons explained in section 3. But the rate of change of ωm for the one-cut ring resonator (figure 13(a)), two-cut ring resonator (figure 13(b)), and four-cut ring resonator (figure 13(c)) are different. The rate of increase is larger for structures with more splits. Since the capacitance due to all splits will change, the change in total capacitance will be larger for structures having more splits.
Note that the magnetic resonance frequencies increase drastically when additional cuts are introduced into the system. When the second split is placed on the ring (figure 11(b)), the capacitances will be connected in series. Therefore, the total capacitance will decrease approximately by a factor of 2. Because of this great amount of decrease in capacitance of individual ring resonators, the change in ωm is very large compared to the changes due to split widths, gap distances and metal widths provided in section3.
4.2. SRRs with two and four splits
In this section, we studied the resonance frequencies of double rings with two and four cuts (splits) in each ring. As a convention, these resonator structures will be called two-cut SRR (figure11(d)) and four-cut SRR (figure11(e)), where the number of cuts present the number of splits in each ring. The radius of outer rings are kept the same with the SRR structure investigated in section 3. The split width is initially taken to be d= 0.2 mm. Measured and simulated transmission spectra of these structures are depicted in figure 14(a) and 14(b), respectively. The resonance frequency of one-cut SRR were given in the previous section but here, we will repeat it once for comparison. The resonance frequency of the one-cut SRR is found to be 3.63 and 3.60 GHz, via measurements and simulations. For two-cut SRR and four-cut SRR structures, measured and simulated resonance frequencies are 6.86 and 6.45 GHz, and 12.96 and 13.2 GHz, respectively.
We then varied the split width of all splits in both inner and outer rings. Figure15 shows the measured resonance frequencies as a function of split width. In all cases the magnetic resonance frequency increases with increasing split width. Similar to the behaviour observed in section 4.1, the rate of increase in resonance frequency is larger for structures having more splits.
8.0 7.5 7.0 6.5 Frequency (GHz) 14.0 13.5 13.0 12.5 0.2 0.3 0.4 Split width (mm) 0.5 0.6 0.7 (c) (b) 0.8
Figure 15. Variation of magnetic resonance frequency with the split width of (a) the one-cut SRR, (b) two-cut SRR and (c) four-cut SRR.
Table 1. Measured magnetic resonance frequencies (GHz) for six different resonator structures.
Single-ring resonator Double-ring resonator
One cut 4.58 GHz 3.63 GHz
Two cut 7.82 GHz 6.86 GHz
Four cut 12.9 GHz 12.96 GHz
4.3. Comparison
In this section, we will compare and analyse the results obtained in sections4.1and4.2. Table1
gives the measured resonant frequencies obtained for six different resonator structures. Columns represent the number of rings in the resonator structures, whereas the rows correspond to the number of cuts in each ring.
Increasing the number of splits increases the magnetic resonance frequency drastically, since the amount of decrease in the capacitance of the system is very large. On the other hand, inserting a ring inside the SRR results in a decrease of ωm. For one-cut and two-cut resonator structures, the amount of decrease of ωmis around 1 GHz. But in the case of the four-cut structure, such a behaviour is not observed. The resonant frequency did not change for single-ring and double-ring configurations. The orientation of the splits is important in this case. Unlike the anti-symmetric orientations of splits in the one-cut and two-cut SRRs, the four-cut SRRs have symmetric orientations. Due to the symmetric orientation of the rings, the mutual capacitance between the inner and outer rings is very small. This is due to the fact that the induced charges along both the rings have the same sign and similar magnitude. As a result, addition of a second ring does not affect the overall capacitance of four-cut single-ring resonator. In turn, the resonance frequency did not change appreciably.
We investigated the magnetic resonances in individual SRRs. By using a CRR structure where the splits of the SRR structures are removed, magnetic resonance is identified for both periodic and individual SRRs. The effects of split width, gap between inner and outer rings and metal width are investigated. Increasing the split width, gap distance and metal width causes magnetic resonance frequency to increase to higher frequencies. Also additional capacitances mounted on the SRR structures and magnetic resonance frequencies are shown to shift to lower frequencies for higher capacitances. We have been able to reduce the magnetic resonance of SRRs by a factor of 2. It is possible to tune the magnetic resonance frequency by using surface-mount varactors loaded SRRs. Different resonator designs are studied in terms of the number of rings and splits, and a detailed study of the change in magnetic resonance frequency is provided. We show that it is possible to change the magnetic resonance frequency of SRR structures, and therefore the LH or negative refractive index region of LHMs.
Acknowledgments
This work was supported by EU-DALHM, EU METAMORPHOSE, EU NOE-PHOREMOST, TUBITAK, MSB-KOBRA-002 and DARPA Contract No. MDA 972-01-2-0016. Ames Laboratory is operated for the US Department of Energy by Iowa State University under Contract No. W-7405-ENG-82. One of the authors (EO) acknowledges partial support from Turkish Academy of Sciences.
References
[1] Veseago V G 1968 Sov. Phys.—Usp. 10 504
[2] Pendry J B, Holden A J, Robbins D J and Stewart W J 1999 IEEE Trans. Microwave Theory Tech. 47 2075 [3] Pendry J B, Holden A J, Robbins D J and Stewart W J 1998 J. Phys.: Condens. Matter 10 4785
[4] Smith D R, Padilla W J, Vier D C, Nemat-Nasser S C and Schultz S 2000 Phys. Rev. Lett. 84 4184 [5] Shelby R A, Smith D R, Nemat-Nasser S C and Schultz S 2001 Appl. Phys. Lett. 78 480
[6] Bayindir M, Aydin K, Markos P, Soukoulis C M and Ozbay E 2002 Appl. Phys. Lett. 81 120 [7] Li K, McLean S J, Greegor R B, Parazzoli C G and Tanielian M H 2003 Appl. Phys. Lett. 82 2535 [8] Aydin K, Guven K, Kafesaki M, Zhang L, Soukoulis C M and Ozbay E 2004 Opt. Lett. 29 2623 [9] Aydin K, Guven K, Soukoulis C M and Ozbay E 2005 Appl. Phys. Lett. 86 124102
[10] Martin F, Falcone F, Bonache J, Marques R and Sorolla M 2003 IEEE Microwave Wireless Comp. 13 511 [11] Martel J, Marques R, Falcone F, Baena J D, Medina F, Martin F and Sorolla M 2004 IEEE Microwave Wireless
Comp. 14 210
[12] Aydin K, Guven K, Katsarakis N, Soukoulis C M and Ozbay E 2004 Opt. Exp. 12 5896
[13] Weiland T, Schuhmann R, Greegor R B, Parazzoli C G, Vetter A M, Smith D R, Vier D C and Schultz S 2001
J. Appl. Phys. 90 5419
[14] Markos P and Soukoulis C M 2002 Phys. Rev. E 65 036622 [15] Markos P and Soukoulis C M 2003 Opt. Exp. 11 649
[16] Ziolkowski R W 2003 IEEE Trans. Antennas Propag. 51 1516
[17] Katsarakis N, Koschny T, Kafesaki M, Economou E N and Soukoulis C M 2004 Appl. Phys. Lett. 84 2943 [18] Koschny T, Markos P, Smith D R and Soukoulis C M, 2003 Phys. Rev. E 68 065602
[19] Koschny T, Kafesaki M, Economou E N and Soukoulis C M 2004 Phys. Rev. Lett. 93 107402 [20] Gay-Balmaz P and Martin O J F 2002 J. Appl. Phys. 92 2929
[24] Baena J D, Marques R, Medina F and Martel J 2004 Phys. Rev. B 69 014402 [25] Sauivac B, Simovski C R and Tretyakov S 2004 Electromagnetics 24 317
[26] Shamonin M, Shamonina E, Kalinin V and Solymar L 2004 J. Appl. Phys. 95 3778 [27] Movchan A B and Guenneau S 2004 Phys. Rev. B 70 125116
[28] Yen T J, Padilla W J, Fang N, Vier D C, Smith D R, Pendry J B, Basov D N and Zhang X 2004 Science 303 1494
[29] Linden S, Enkrich C, Wegener M, Zhou J, Koschny T and Soukoulis C M 2004 Science 306 1351 [30] User Manual Version 5.0, CST GmbH, Darmstadt, Germany, 2005,http://www.cst.de