ANALYSIS OF THE ATAD2 GENE EFFECT ON THE GENES
INVOLVED IN EPITHELIAL MESENCHYMAL TRANSITION
IN ESTROGEN POSITIVE AND NEGATIVE BREAST
CANCERS
A THESIS SUBMITTED TO
THE GRADUATE SCHOOL OF ENGINEERING AND SCIENCE
OF BILKENT UNIVERSITY
IN PARTIAL FULFILLMENT OF THE REQUIREMENTS FOR
THE DEGREE OF
MASTER OF SCIENCE
IN
MOLECULAR BIOLOGY AND GENETICS
By
Zeynep Ilgım Özerk
February, 2021
Analysis of the AT AD2 Gene Effect on the Genes Involved in EMT in Estrogen Positive and Negative Breast Cancers
By Zeynep Ilg1m Ozerk February, 2021
We certify that we have read this thesis and that in our opinion it is fully adequate, in scope and in quality, as a thesis for the degree of Master of Science.
l.~1k Yulug (Advisor)
Ozlen Konu Karakayal1
Approved for the Graduate School of Engineering and Science:
~zhan Kara~an
Director of the Graduate School
l
ii
ABSTRACT
ANALYSIS OF THE ATAD2 GENE EFFECT ON THE GENES INVOLVED IN EPITHELIAL MESENCHYMAL TRANSITION IN ESTROGEN POSITIVE AND
NEGATIVE BREAST CANCERS
Zeynep Ilgım Özerk
M.S. in Molecular Biology and Genetics Advisor: Işık Yuluğ
February 2021
ATAD2 is overexpressed in many distinct cancer types including breast cancer. Its elevated expression is an indicator of poor prognosis. High ATAD2 expression correlates with short overall survival, disease-free survival as well as shorter recurrence-free survival. Moreover, ATAD2 is associated with migration and invasion in some cancer types such as hepatocellular carcinoma and cervical cancer. In breast cancer, ATAD2 expression is higher in invasive tumors.
ATAD2 is coactivator of steroid hormone receptor ERα. It directly interacts with ERα and enhances its target genes expressions. ERα is also a regulator of EMT in breast carcinomas. Based on our current knowledge it is proposed that ATAD2 may have a role in EMT and migration capacity of breast cancer cells and this role may be ER dependent as both ATAD2 and EMT are associated with ERα.
Bioinformatics analysis revealed that siATAD2 silencing decreased mesenchymal gene expressions significantly in MCF7 and T47D cells. To investigate the possible mesenchymal inducing role of ATAD2, ATAD2 was silenced with shRNA transfection in ER+ MCF7 and T47D cells and ER- mda-mb-231 and sk-br-3 cells. ATAD2 silencing decreased mesenchymal markers expression at both the mRNA and protein level in ER- cells. In ER+ cells, no change in EMT marker proteins and mRNAs were observed with ATAD2 silencing. ER was silenced in ER+ cells and ER silencing introduced a mesenchymal phenotype to them. In this case, ATAD2 silencing reduced this mesenchymal phenotype introduced with ER loss. The EMT
iii
effect of the ATAD2 silencing on migration capacity of breast cancer cells was assessed with a scratch assay. Consistent with changes in the epithelial and mesenchymal markers, ATAD2 silencing reduced the migration capacity of mda-mb-231 cells. On the other hand, sk-br-3 migration did not change significantly. In ER+ cells ATAD2 silencing alone had no influence on migratory capacity. ER silencing increased their migration significantly while ATAD2 downregulation in ER-silenced cells suppressed this migration.
Over all, this study suggests a possible involvement of ATAD2 in EMT and migration regulation in ER- cells. Targeting ATAD2 in ER- mesenchymal breast cancer cells could be a strategy to reduce their migration capacity.
iv
ÖZET
ÖSTROJEN POZİTİF VE NEGATİF MEME KANSERİNDE ATAD2 GENİNİN EPİTEL MEZENKİMAL DÖNÜŞÜM GENLERİ ÜZERİNE ETKİSİNİN ANALİZİ
Zeynep Ilgım Özerk
Moleküler Biyoloji ve Genetik, Yüksek Lisans Tez Danışmanı: Işık Yuluğ
Şubat 2021
ATAD2’nin, meme kanseri dâhil birçok farklı kanser türünde ifadesi fazladır. Artmış ifadesi bir kötü prognoz göstergesidir. Yüksek ATAD2 ifadesi genel sağkalım, hastalıksız sağkalım ve nüksüz sağkalım sürelerini kısaltır. Ayrıca ATAD2, hepatoselüler karsinom ve rahim ağzı kanseri gibi bazı kanser türlerinde göç ve istila ile ilişkilidir. Meme kanserinde, metastatik tümörlerde ATAD2 ekspresyonu daha yüksektir.
ATAD2, steroid hormon reseptörü ERα'nın koaktivatörüdür. Doğrudan ERα ile bağlanır ve ERα hedef gen ifadelerini arttırır. ERα ayrıca meme karsinomlarında epitel mezenkimal dönüşüm (EMD)’nin bir düzenleyicisidir. Bu bilgilere dayanarak, ATAD2'nin EMD ve meme kanseri hücrelerinin göçünde bir rolü olabileceği ve hem ATAD2’nin hem de EMD'nin ERα ile ilişkili olması nedeniyle bu rolün ERα ifadesinden etkilenebileceği öne sürülmüştür.
Biyoinformatik analizleri, siATAD2 ile ATAD2 ifadesini susturmanın, MCF7 ve T47D hücrelerinde mezenkimal gen ifadelerini önemli ölçüde azalttığını ortaya koymuştur. ATAD2'nin olası mezenkimal indükleyici rolünü araştırmak için ATAD2, ER + MCF7 ve T47D hücrelerinde ve ER- mda-mb-231 ve sk-br-3 hücrelerinde shRNA transfeksiyonu ile susturuldu. ATAD2 susturma, ER hücrelerinde hem mRNA düzeyinde hem de protein düzeyinde mezenkimal belirteç ekspresyonunu azalttı. ER + hücrelerde, ATAD2’nin susturulması ile EMD belirteçlerinde ne proteinleri düzeyinde ne de mRNA düzeyinde bir değişiklik gözlenmedi. ER+ hücrelerde ERα’nın susturulması bu hücrelere mezenkimal fenotip kazandırdı. Bu durumda, ATAD2’nin susturulması ile ER kaybıyla ortaya çıkan bu mezenkimal fenotipin azaldığı gözlemlendi. ATAD2 susturmanın EMD proteinlerindeki değişimin meme
v
kanseri hücrelerinin göç kapasitesi üzerindeki bir etkisi olup olmadığını anlamak için, çizik deneyi yapıldı. Epitel ve mezenkimal belirteçlerdeki değişimlerle tutarlı olarak, ATAD2’nin susturulması, mda-mb-231 hücrelerinin göç kapasitesini azaltmıştır. Öte yandan sk-br-3 göçü ATAD2 susturulmasıyla önemli ölçüde değişmedi. ER + hücrelerinde ATAD2’nin tek başına susturması göç kapasitesinde bir değişiklik yaratmadı. ERα’nın susturulması, hücre göçünü önemli ölçüde artırırken, ER susturulmuş hücrelerde ATAD2’nin de susturulması bu göçü bastırdı.
Kısaca, bu çalışma ATAD2'nin, ER- hücrelerde EMD'ye ve göç kapasitesine olası bir etkisini önermektedir. ER- mezenkimal meme kanseri hücrelerinde ATAD2'yi hedef almak, göç kapasitesini azaltmak için bir strateji olabilir.
vi
ACKNOWLEDGEMENTS
First and foremost, I would like to thank Assoc. Prof. Dr. Işık Yuluğ for giving me the opportunity. It was a privilege to work in her lab under her supervision. I am grateful to her for always being supportive and understanding. She always believes in me and encourages me to do my best. She was very helpful in and out of lab. I appreciate her valuable mentoring and her trust in me.
I also would like to thank members of my jury Assoc. Prof. Dr. Özlen Konu and Prof. Dr. Hilal Özdağ for accepting to be my jury member and sharing their valuable ideas.
I would also like to thank previous members of the Yuluğ lab, Nazlı Değer and Ayşe Sedef Köseer. They were very helpful when I was a newbie in the lab. They were always willing to help and taught what they knew. I would like to thank another member of Yuluğ lab and my dear friend, Gizem Sunar. We have been through good and bad together with her. She was always supportive and uplifting. It would be much more painful without her. I also thank Buse Nurten Özel for the bioinformatics analysis. She answered my every question despite her busy schedule and helped me whenever I asked. I thank our previous post-doc Dr. Eda Süer for her invaluable help. She never hesitated to answer my questions. She was always there whenever I needed help. She was always very helpful and supportive.
I am very luck to meet incredible people during my studies in Bilkent MBG: Melike Demir, Sena Atıcı, Damla Güneş, Büşra Korkmaz and Kübra Çelikbaş Yılmaz. They were great friends to me. I have so many great memories with them that I will appreciate all my life.
Last but not least, I would like to thank my parents and my sister Doğa. They always had my back and supported me no matter what. I appreciate their unconditional love belief in me very much. I am very lucky to have them.
vii
TABLE OF CONTENT
ABSTRACT ...ii
ÖZET ... iv
ACKNOWLEDGEMENTS ... vi
TABLE OF CONTENT ... vii
LIST OF FIGURES ... ix LIST OF TABLES ... x ABBREVIATIONS ... xi CHAPTER 1. INTRODUCTION ... 1 1.1. Cancer ... 1 1.1.1 Breast Cancer... 1 1.2. ATAD2 ... 3
1.2.1 ATAD2 and Estrogen Receptor α ... 5
1.3. Estrogen Receptor ... 6
1.3.1 ER and Cancer ... 7
1.4. EMT and Metastasis ... 8
1.4.1 ER and EMT ... 10
1.5. Aim and Objectives ... 11
CHAPTER 2. MATERIALS AND METHODS ... 12
2.1. MATERIALS ... 12
2.1.1 Reagents ... 12
2.1.2 Buffers and Solutions ... 13
2.1.3 SDS-PAGE Gel ... 14
2.1.4 Antibodies... 14
2.1.5 Kits ... 15
2.1.6 PCR Primers ... 15
2.1.7 Equipment ... 16
2.1.8 Cell Culture Reagents ... 16
2.1.9 Cell Lines and Their Growth Mediums ... 16
2.1.10 Nucleic Acids ... 17
2.2 METHODS ... 17
2.2.1 Maintenance and Handling of Cell Lines ... 17
2.2.2 Bacterial Transformation and Plasmid Isolation ... 18
2.2.3 Kill Curve and Determination of Selection Antibiotic Concentration ... 18
viii
2.2.5 Pellet Collection, RNA Isolation from Cell Pellets and cDNA Synthesis ... 19
2.2.6 qRT-PCR ... 19
2.2.7 Protein Isolation and Quantification of Proteins’ Concentration ... 20
2.2.8 Western Blot ... 21
2.2.9 Mild Stripping ... 21
2.2.10 Scratch Assay ... 21
2.2.10 Statistical Analysis ... 22
2.2.11 Microarray Data Analysis ... 22
3. RESULTS ... 23
3.1 Determination of Expression Changes of EMT genes in siATAD2-Transfected MCF7 and T47D cells ... 23
3.1 Kill Curves ... 23
3.2 shATAD2 and shERα Plasmid Selection ... 25
3.3 Effect of ATAD2 and ERα Silencing on EMT Gene Expression ... 28
3.4 Changes in EMT Protein Levels Upon ATAD2 and ERα Silencing ... 35
3.5 Heatmap Analysis of the Investigated Proteins and Genes Expressions ... 44
3.6 Effect of ERα and ATAD2 Downregulation on Cell Migration ... 45
5. DISCUSSION ... 51
5. FUTURE PERSPECTIVES ... 57
REFERENCES ... 58
APPENDIX ... 63
A. Copyright Permissions ... 63
ix
LIST OF FIGURES
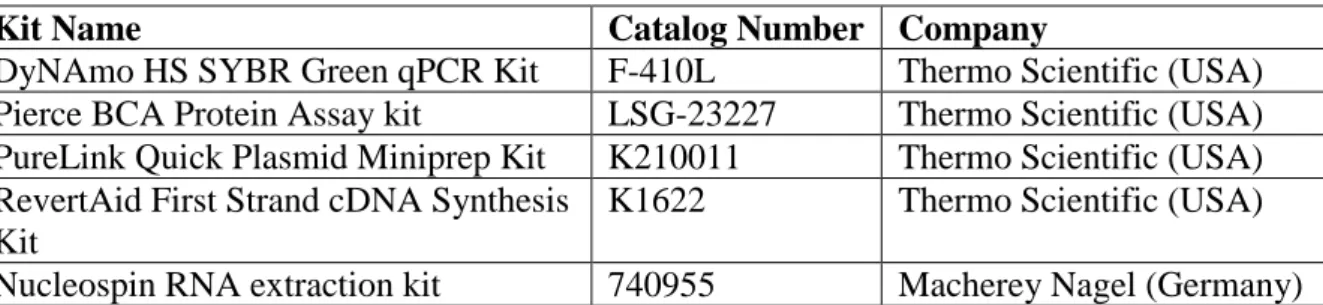
Figure 1.1: Molecular subtypes of breast cancer and their characteristics……….2 Figure 1.2: ATAD2 and ERα amplification loop. Amplified ATAD2 expression in cancer cells contribute to this amplification loop as well………...5 Figure 1.3: EMT in cancer cells and epithelial and mesenchymal cell markers………...……10 Figure 3.1: Differentially expressed EMT-related genes with high enrichment scores in
siATAD2-transfected MCF7 and T47D cells………...23 Figure 3.2: Kill curves for MCF7, T47D, MDA-MB-231 and SK-BR-3 cell lines for stable transfection………...……….24 Figure 3.3: Efficiency of sh(ATAD2) plasmids in MCF7, T47D, MDA-MB-231 and SK-BR-3 cells and sh(ER) plasmids in MCF7 and T47D cells………28 Figure 3.4: EMT gene expression changes in MCF7 and T47D cells………..32 Figure 3.5: EMT gene expression changes in mda-mb-231 and sk-br-3 cells……….33 Figure 3.6: EMT protein expression changes upon ATAD2 and ER silencing in MCF7 and T47D cells……….39 Figure 3.7: EMT protein expression changes upon ATAD2 and ER silencing in MDA-MB-213 and SK-BR-3 cells……….41 Figure 3.8: Heatmap analysis of gene and protein expressions………42 Figure 3.9: Changes in migration capacity of the MCF7 and T47D cells………45 Figure 3.10: Changes in migration capacity of the MDA-MB-231 and SK-BR-3 cells….…49
x
LIST OF TABLES
Table 1.1: Breast cancer cell lines used in this thesis, their molecular subtypes and receptor
status………....3
Table 2.1: Routinely used reagents and chemicals………...……12
Table 2.2: Routinely used buffers and their recipes………..………13
Table 2.3: Solutions and their amounts for preparing SDS-PAGE Gel………14
Table 2.4: Antibodies used for western blot analysis and their concentrations………14
Table 2.5: Kits that were used………...15
Table 2.6: Primers used in RT-qPCR analysis………..15
Table 2.7: Equipment that were used in experiments………...16
Table 2.8: Reagents used in cell culture studies………...16
Table 2.9: Cell lines used in this study and their growth mediums………..…16
Table 2.10: shRNA vectors used in this study………..17
xi
ABBREVIATIONS
ANCCA: AAA+ nuclear coregulator cancer associated AR: androgen receptor
ATAD2: ATPase family AAA domain-containing protein 2 ddH2O: double distilled H2O
DMSO: Dimethyl sulfoxide DOC: Sodium deoxycholate E2: Estradiol
ECM: extracellular matrix EGF: Epidermal Growth Factor
EMT: epithelial-mesenchymal transition ER: estrogen receptor
FBS: Fetal bovine serum FOXB3: Forkhead Box P3
GRHL1: Grainyhead like transcription factor 1 H3K14ac: Histone H3 acetylated at lysine 14 H4K12ac: Histone H4 acetylated at lysine 12 HDCA1: Histone deacetylase 1
HER2: human epidermal growth factor receptor 2 MEIS1: Meis Homeobox 1
MET: mesenchymal-epithelial transition PBS: phosphate buffer saline
PR: progesterone receptor SDS Sodium Dodecyl Sulfate shRNA: Short hairpin RNA TBS: Tris Buffered Saline TCA: Trichloroacetic acid TF: transcription factor
1
CHAPTER 1. INTRODUCTION
1.1. Cancer
Cancer is a heterogeneous disease that can arise from almost any type of cell in the body. Although a long-known disease, the battle against cancer still continues. 1 in 5 people is diagnosed with cancer during their lifetime [1]. Today it continuous have a devastating effect. 10 million people died because of cancer in 2020 [1]. Moreover, the WHO estimates that 30.2 million new cases of cancer will be diagnosed in 2040 [2].
Cancer is a multi-step process and result of the accumulation of genetic mutations. It arises when cells start to divide in an uncontrolled manner. There are many types of cancer, yet all these types share some common traits. All cancer cells escape cell cycle control and apoptosis. They induce angiogenesis, maintain proliferation signaling, evade growth suppressors, activate invasion, and have unlimited replication potential. [3]
Cancers can be classified as benign or malignant according to their invasiveness capacity. Benign cancers are local and gain invasive capacity and become malignant progressively. On the other hand, malignant tumors metastasize to other tissues from their tissue of origin and are responsible for most of the cancer deaths [4].
The heterogeneity and complexity of cancer are the main challenges to its comprehension and treatment. Although cancer is one of the most studied diseases in the world, a better understanding of its mechanisms and better treatment options are still needed.
1.1.1 Breast Cancer
Breast cancer is among the most common cancers worldwide. It is the most common cancer among new cases in 2020 according to the latest GLOBOCAN report [5]. 1 in 4 cancers diagnosed in women is breast cancer [1].
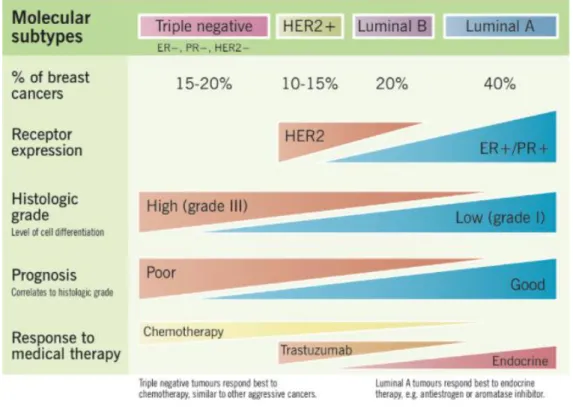
To cope with the heterogeneity problem, breast cancer is divided into subtypes based on its histological or molecular features. The histological classification is based on the appearance of the tumors under a microscope. On the other hand, molecular subtypes are formed in line with gene expression profiles. Molecular subtypes are more predictive in determining response to therapies [6]. The four groups of breast cancer according to their molecular subtypes; Luminal
2
A (ER+ and/or PR+, HER2-) luminal B (ER+ and/or PR+, HER2+), HER2-enriched (ER-, PR-, HER2+)PR-, and triple-negative (ER-PR-, PR-PR-, HER2-) are shown in Figure 1.1 [7].
Expression of ER is the criterion for determining the subtype of a breast tumor. This is understandable when the tremendous role of ER in breast cancer is considered. Almost 70% of all breast cancers are ER+, increasing ERs’ significance in cancer research. Triple-negative breast cancer (ER-, PR-, HER2-) has the worst overall and disease-free survival [8]. Also, the HER2+/ER- subtype has a poorer prognosis compared to ER+ subtypes. It is proven that low ER expressing cells have less disease-free survival rates after tamoxifen treatment [9]. It seems like ER loss manifests a less differentiated, more resistant phenotype with a poorer prognosis in breast cancer cells.
MCF7, T47D, MDA-MB-231, and SK-BR-3 are the four breast cancer cell lines that are used in this thesis. Their receptor status and molecular subtypes are shown in Table 1.1.
3
Cell Line Subtype ER PR HER2
MCF7 Luminal A + + -
T47D Luminal A + + -
MDA-MB-231 Triple Negative - - -
SK-BR-3 HER2 Enriched - - +
1.2. ATAD2
ATAD2 (ATPase family AAA domain-containing protein 2), also called ANCCA (AAA+ nuclear coregulatory cancer‑associated protein) or pro2000 is a highly evolutionarily conserved protein in eukaryotes [10]. It contains two AAA+ ATPase domains and a bromodomain. AAA+ ATPase domain-containing proteins hydrolyze ATP and use the energy obtained from this hydrolysis to change the conformation of their substrate and are known to participate in protein complex assembly [11] while bromodomain-containing proteins recognize acetylated residues on histones and they regulate gene expression through remodeling chromatins [12]. Endowed with such functional domains, it is not surprising that ATAD2 has many crucial roles in biological processes and diseases.
Despite its relatively new discovery, ATAD2 is a frequently studied protein in cancer research and has been found to be overexpressed in and associated with progression of various tumors. ATAD2 overexpression manifests a poor prognosis [13] [14] [15] [16]. ATAD2 upregulation has been shown to correlate with shorter overall survival, shorter recurrence-free survival as well as shorter disease-free survival in hepatocellular and endometrial carcinoma, lung adenocarcinoma, and gastrointestinal tumors. [17] [18]. ATAD2 promotes cell proliferation, invasion, and migration while inhibiting apoptosis in many distinct cancers such as ovarian, cervical, pancreatic cancer, and hepatocellular carcinoma [19] [20] [16] [21]. Moreover, ATAD2 downregulation inhibit drug resistance in pancreatic and ovarian cancers [22] [16]. ATAD2 expression is also upregulated in breast cancer compared to normal breast tissue [14] [23]. This upregulation can be explained at least partially by genomic amplification [24]. Furthermore, ATAD2 overexpression in breast cancer stands out in all subtypes. ATAD2 overexpression has been shown in both ER+ and ER- breast cancer cells [23] . ATAD2
Table 1.1: Breast cancer cell lines used in this thesis, their molecular subtypes and receptor status
4
overexpression is also an indicator of poor prognosis in breast cancer [14] [23]. High ATAD2 expression is associated with poor survival, disease recurrence, and metastasis [23]. ATAD2 has control over several genes that play a role in cancer development. ATAD2 has been shown to directly bind to promoter of replication and cell cycle regulation genes such as Top2A, CDC2, MCM10 and cyclin A2. Moreover, ATAD2 downregulation inhibit proliferation and induce apoptosis in triple negative breast cancer cells [23]. It acts as a cofactor for key transcription factors. ATAD2 is a binding partner of transcription factor E2F1. It regulates expression of E2F1 target gene ACTR whose overexpression is frequently seen in breast cancer [25]. Another transcription factor, myc, is also regulated by ATAD2. ATAD2 interacts with myc transcription complex and increases expression of myc target genes such as cdc25A, cyclin D1, HSP60 and cdk4. As many of the myc target genes control cell cycle, ATAD2 contributes to the cell cycle regulation and S phase entry [24].
With its bromodomain, ATAD2 recognizes acetylation marks on H4. However, bromodomain is not enough for effective interaction between ATAD2 and histones. Integrity of AAA ATPase+ domain is a must for ATAD2’s recruitment to acH4 and oligomer ATAD2 has a stronger affinity for acH4 than its monomer form [14]. ATAD2 competes with HDAC1 to protect H4K12ac from deacetylation. As a result, chromatin is kept in an ‘open’ state and transcription and replication may continue [26]. ATAD2 is also known to interact with H3K14ac when the cells are in the mitotic stage. It recruits E2F and HCF-MLL complex to the acetylated histones. E2F is a well-known transcription factor that plays a central role in cell cycle regulation along with DNA repair, and its misregulation promotes cancer [27] [28]. ATAD2 has a role in the recruitment of histone methyltransferase NSD2/MMSET for activation of NF-κB target genes such as cyclin D1 and c-Myc or VEGF. ATAD2 binds NF-κB and translocates to the promoters of NF-κB target genes, recruiting NSD2/MMSET and thereby facilitating the generation of H3K36me2 and H3K36me3 histone marks. Allowing promoter accessibility, ATAD2 therefore increases the expression of of NF-κB target genes that have important roles in cancer regulation such as angiogenesis, proliferation and apoptosis [29]. After all, ATAD2 is a chromatin regulator that can recruit histone modifiers that relax chromatin structure or block histone modifiers that promote histone condensation.
Besides, ATAD2 participates in DNA replication. Its expression fluctuates through the cell cycle; upregulated in S phase in the same manner as DNA replication-related genes. ATAD2 directly interacts with histone H4 diacetylated at K5 and K12 residues, a mark intrinsic to newly synthesized histones during replication [30].
5 1.2.1 ATAD2 and Estrogen Receptor α
ATAD2 also interacts with steroid hormone receptors ERα and AR. It directly binds to ERα and AR, an interaction enhanced in the presence of receptor ligands, estrogen (E2) and androgen respectively. Bound to ERα, ATAD2 is recruited to the promoter of a subset of ER target genes such as cyclin D1, E2F1, and c-myc. ATAD2 promotes the expression of this subset of genes via recruiting acetyl transferase CBP to the promoter. In the absence of E2, ER can still bind to the promoter of its target genes but CBP recruitment is disrupted and therefore gene activation is recessed [31]. Moreover, upregulation of many of the kinesin family proteins due to E2 treatment is enhanced in the presence of ATAD2. E2F and MLL methyltransferase are recruited to kinesin gene promoter by ATAD2 when cells are treated with estrogen [32]. Another striking discovery is that ATAD2 expression is increased with E2 treatment in ER+ cells. ATAD2 stands out among other ER coactivators with its ability to selectively control ER target genes. Not all ER target genes but some are induced in the presence of ATAD2. These upregulated genes seem to have roles in cell cycles. Hence, it is not a surprise that ATAD2 downregulation inhibits E2-induced cell proliferation as well as G1/S transition [31].
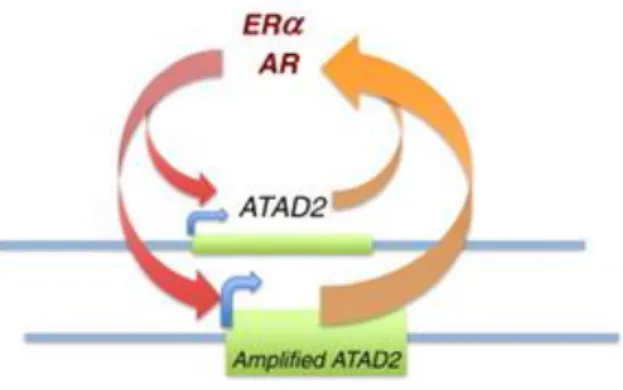
Similar results were found regarding the AR-ATAD2 relationship in prostate cancer. Androgen induces ATAD2 expression. ATAD2 binds to AR and is recruited to specific AR target genes. ATAD2 inhibition reduces androgen-induced cell proliferation and increases apoptosis [33]. Amplification loops between ERα-ATAD2, AR-ATAD2 are found in cancer cells. ATAD2 interacts with and activates these proteins, and these interactions, in turn, activate ATAD2 gene expression [34]. (Figure 1.2)
Figure 1.2: ATAD2 and ERα amplification loop. Amplified ATAD2 expression in cancer cells contribute to this amplification loop as well
6
ATAD2 is an important prognostic biomarker and has tremendous roles in cancer progression in many different cancer types. It regulates histone dynamics and recruits transcription factors and regulates the expression of many genes that have distinct cellular functions. Therefore, a better understanding of the function of ATAD2 as well as its relation with other cellular components and processes in cancer are needed.
1.3. Estrogen Receptor
Estrogen receptor (ER) is a nuclear receptor that has control over many distinct and important physiological processes in humans. It dimerizes and translocates to the nucleus upon ligand binding and binds to the specific sequences of DNA called estrogen response elements (ERE) to regulate the transcription of certain genes. It has two subtypes: ERα and ERβ. Though structurally quite similar and sharing some common functions, these subtypes also have different roles. ERα is abundant in the mammary gland, uterus and ovary while ERβ is abundant in the prostate, bladder, and immune system. Compatible with the tissue of expression, ERα becomes prominent in mammary gland development and function. On the other hand, ERβ comes forward in immune system regulation [35]. In this study, ER refers to ERα.
Like other steroid hormone receptors, the estrogen receptor consists of a DNA binding domain (DBD), a binding domain (LBD) and an N-terminal domain that compromise a ligand-independent functional domain (AF1). Both ERs share similarities in their DBDs and LBDs. This allows them to bind the same DNA sequences and ligands with similar affinities. The AF1 region, which is related to co-regulator recruitment, differs in ERα and β. Despite the huge similarities, sometimes ERα and ERβ also have some striking differences. Sometimes they respond differently to same ligand such as tamoxifen and raloxifene, which are partially E2 agonists with ERα but pure E2 antagonists with ERβ [36]. Also, the subtypes may have different or even opposite roles in expression of the same gene, which results in different effects on disease progression. Cyclin D1 expression is upregulated with ERα and it is downregulated with ERβ [37]. It has been shown that ERα promotes proliferation in MCF-7 cells, but ERβ introduction inhibits proliferation by promoting cell cycle arrest [38].
ER controls gene expression not only by binding to DNA but also by interacting with transcription factors (TFs) in the nucleus. This allows ER to control the expression of genes that lack the ERE sequence. Interaction of ER with the transcription factors activator protein 1 (AP1), Sp1 and nuclear factor κβ (NF-κB) set good examples for ERE-independent gene expression control of ER [39] [40] [41]. The TF that ER is bound to changes its effect on gene
7
expression. Interaction with the TFs MEIS1 and FOXP3 upregulates gene expression while interaction with GRHL1 downregulates expression [42].
ER can exert its effect on gene expression in a non-genomic manner by activating second messengers such as kinases or phosphatases. This creates a more rapid response than genomic activation. For example, ER activates the MAPK pathway in MCF7 breast cancer cells, which leads to cell cycle stimulation [43], or the MAPK pathway is activated by ER in endothelial cells which in turn activates Endothelial nitric oxide synthase (eNOS) and leads to nitric oxide release and vascular smooth muscle relaxation [44].
Primary female sex hormone estrogen is the ligand for ER. Estradiol (E2) is the most abundant form of estrogen in humans [45]. ERα can be activated by estrogen binding in a ligand– dependent manner, or it can be activated by other proteins such as EGF, cAMp or PKA in a ligand-independent manner. These proteins can be protein kinases such as PKA [45], growth factors such as EGF [46] or IGF-1 [47], the neurotransmitter dopamine [48] or cell cycle regulators such as cyclin D1 [48]. These proteins phosphorylate ERα at various sites, which leads to its dimerization and activation. Phosphorylation of ER in a ligand-independent manner requires MAPK most of the time. This ligand-independent activation of ERα is one of the reasons hormonal therapy becomes ineffective in ER-positive breast cancer cells and resistance develops.
1.3.1 ER and Cancer
Estrogen has found to be effective in the development of numerous cancers some of which are breast, endometrium, ovary, prostate, lung and colon. Estrogen is known to regulate expression of most of the genes that have roles in tumor formation and development. Almost 70% of breast cancers are ER-positive [49]. That makes ER a valuable receptor in breast cancer studies. ERα expression is elevated in breast carcinoma and it acts as a tumor promoter [50]. In the breast cancer, ERα regulates the cell cycle, in particular G1-S transition via cyclin D1 [51], and represses apoptosis by upregulating antiapoptotic Bcl-2 and Bcl-XL expressions [52]. Furthermore, non-genomic activation of MAPK and PI3K/Akt pathways by estrogen increases cell survival. Another very important process for cancer progression, angiogenesis, is also found to be affected by estrogen. In breast cancer, E2 stimulates two important angiogenesis factors; interleukin 8 and VEGF [53]. ERβ is relatively new in breast cancer studies but it has produced some surprising results. Re-expression of ERβ in breast cancer cell lines reduces cell
8
proliferation, increases apoptosis and the efficacy of the chemotherapeutic agent. Another interesting study has revealed that co‑expression of ERα:ERβ may be an indicator of tumor aggressiveness and the sensitivity of hormonal therapy [54].
Endocrine therapy, in which estrogen and ER interaction is disrupted, is one of the most used treatments in ER-positive breast cancer patients. Because ER-positive breast cancers are highly dependent on ER signaling, this is a very promising strategy to combat breast cancer. However, anti-estrogens that are used in hormone therapy have serious side effects and resistance develops frequently during long-term treatment. One third of the women receiving endocrine therapy gain resistance [55]. Three main types of molecules that are used in endocrine therapy are (I) selective estrogen receptor modulators (SERMs) like tamoxifen, raloxifene and toremifene, (II) selective estrogen receptor degraders (SERDs) like fulvestrant, and (III) aromatase inhibitors like anastrozole, letrozole and exemestane. SERMs compete with estrogen to bind ER and restrict co-regulator binding to ER. Even though ER can bind to DNA, because of the absence of a co-activator, it is in an inactive state [56]. Selective receptor degradators bind to ER and cause their degradation while aromatase inhibitors inhibit estrogen synthesis. As ER has many important roles in many different tissues, the effects of these agents on gene regulation should be tissue specific to prevent side effects. Effects of endocrine therapy agents in other tissues than the target tissue and resistance to therapy are two major challenges in the success of endocrine therapy. Development of more specific agents and combinational therapy are promising strategies to overcome the drawbacks of endocrine therapy [57].
1.4. EMT and Metastasis
Epithelial to mesenchymal transition (EMT) is a complex and highly regulated process. It is crucial for embryonic development, wound healing and tissue fibrosis [58]. Tumor cells can also undergo EMT to become more mesenchymal. Epithelial cells lose contact with the basement membrane and with each other along with losing their apical-basal polarity as EMT progresses. At the end, cells are able to degrade basement membrane and migrate away as mesenchymal cells. With EMT, cells acquire higher migratory capacity and invasiveness, resistance to apoptosis, and a more stem-cell like phenotype, as well as increased production of ECM components [59] [60].
All EMT processes that occur in body are classified into three distinct subtypes that result in different cell phenotypes and require different signals. Type 1 EMT occurs during embryogenesis and gives rise to mesoderm, endoderm and to neural crest cells. On the other
9
hand, Type 2 EMT occurs during wound healing, tissue regeneration, and organ fibrosis. It is triggered with inflammation and gives rise to fibroblast cells. Type 3 EMT is the one that is seen in cancer cells and produces cells that have the ability to invade and metastasize [61] [62]. Carcinomas develop on the epithelial side of the basement membrane as benign tumors. Some carcinoma cells gradually acquire the capability to detach from neighboring cells and pass the basement membrane enter to the blood or lymphatic system in which they travel as circulating tumor cells (CTCs). Once they find a proper tissue to colonize, the tumor cells pass the lumen of blood or lymph vessels and penetrate the tissue. They adapt to the new environment and proliferate to form a secondary tumor site [63]. This process is called metastasis and it is the cause of 90% of cancer related deaths. It is known that not all cancer types have same affinity for metastasis. Some cancer types metastasize on rare occasions while others usually do. Basal cell carcinomas and astrocytomas are two examples of rarely metastasizing cancer types. Even though tumor formation is relatively understood, metastasis is still a mystery [4].
EMT is a spectrum. Rather than giving rise to two sharp ends as epithelial and mesenchymal, cells can display a phenotype in between. A hybrid epithelial-mesenchymal (E/M) phenotype can be seen in tumor cells. E/M hybrid cells can express epithelial and mesenchymal markers at the same time. This partial EMT allows cancer cells to migrate collectively as clusters. Moreover, it has been shown that E/M phenotype possessing cancer cells leave the bloodstream more easily [64].
As a quite complicated process, EMT requires orchestration of many signaling pathways, transcription factors, epigenetic modifications, micro RNAs and long non-coding RNAs. These factors can change the expression of some cell surface proteins such as E-cadherin, occludin, N-cadherin or integrin; or cytoskeletal proteins such as vimentin to shift the cell phenotype [62]. Expression changes of these proteins can be used as biomarkers in order to determine the cell phenotype. E–cadherin and occludin are epithelial markers while vimentin and N-cadherin are mesenchymal ones [62]. Twist1, Twist2, Snail1, Snail2 (Slug), ZEB1 and ZEB2 are transcription factors known to be associated with EMT. They suppress E-cadherin expression. Thus, they reduce the epithelial phenotype [58]. Silencing of Slug has been shown to reduce cell migration in metastatic breast cancer cells [65]. Twist1 inhibition in breast cancer cells reduces E-cadherin expression and increases vimentin expression, manifesting a mesenchymal phenotype in mouse models. Also, Twist1 downregulation lowers Snail, Slug, and ZEB2 expression which indicates an interaction between these transcription factors’ expression levels
10
[66]. Twist1 has been shown to induce metastasis by upregulating integrin α5 and integrin β1 expression in MCF7 cells [67]. Moreover, many signaling pathways such as TGF-β, Wnt–β-catenin, Notch, Hedgehog, and RTKs can regulate EMT by controlling EMT–related TF expressions [58].
A surprising discovery is that the tumor of the metastatic lesion is similar to the primary tumor in terms of morphology showing an epithelial phenotype. It is proposed that once they settle at the metastatic site, cancer cells reverse EMT and switch from a more mesenchymal state to a more epithelial state. This reverse EMT process is called MET (mesenchymal epithelial transition) and it is also necessary for a healthy development of an organism [68].
It has recently been discovered that EMT is related to drug resistance as well. Targeting EMT becomes more precious in this sense. Two extremely complicated and hard to deal with processes, metastasis and drug resistance, can be targeted at the same time in this manner [69]. However, targeting EMT is quite tricky as it includes complex interactions between the stroma and the tumor.
1.4.1 ER and EMT
As one of the major signaling pathways in cancer, ER has control over EMT. ERα silences EMT genes such asLCN2 and IFI27 via methylation [70]. Interactions between many EMT TFs and ERα have been shown. Slug is an EMT-related transcription factor regulated by ERα. ERα downregulates slug expression by directly binding to its promoter and indirectly through GSK3 kinase [71]. ERα controls EMT through the pathways it regulates, too. ERα downregulates TGFβ signaling, which is known to upregulate EMT TFs such as ZEB1, Twist
11
and Snail [72]. Also, another ERα regulated signaling pathway, NF-κB, increases expression of EMT TFs Twist1 and Slug [73]. ERα downregulates NF-κB signaling [74]. Thus, it promotes an epithelial phenotype. Moreover, EMT induction upon ERα silencing is shown. Transcriptome profiling reveal that adhesion is altered significantly with ERα silencing. Estrogen receptor silencing induces invasion and migration in human breast cancer cells [75]. Consistent with phenotype change, vimentin expression is downregulated while E-cadherin expression is upregulated upon ER downregulation in MCF7 cells [76].
1.5. Aim and Objectives
ATAD2 is a co-activator that is overexpressed in many different cancer types including breast cancer [14] [15] [16] [17] [18]. Its overexpression correlates with poorer prognosis, disease recurrence and metastasis [23]. ATAD2 is shown to directly interact with ERα and enhance transcription of ER target genes. Moreover, E2 treatment increases ATAD2 expression [31]. ERα is one of the major signaling pathways in breast cancer contributing to cancer formation and progression as well as EMT. It has previously been shown that ERα silencing induces a mesenchymal phenotype in ER+ breast cancer cell lines [75].
The aim of this study was to show the ER-dependent effect of ATAD2 on EMT in breast cancer cells. For this purpose, two ER+ (T47D, MCF7) and two ER- (MDA-MB-231 and SK-BR-3) breast cancer cell lines were selected. ATAD2 was silenced using the shRNA plasmid in these four lines. Also, ERα was downregulated in ER+ cell lines with shRNAs. Effects of downregulations of ERα and ATAD2 on EMT were investigated.
12
CHAPTER 2. MATERIALS AND METHODS
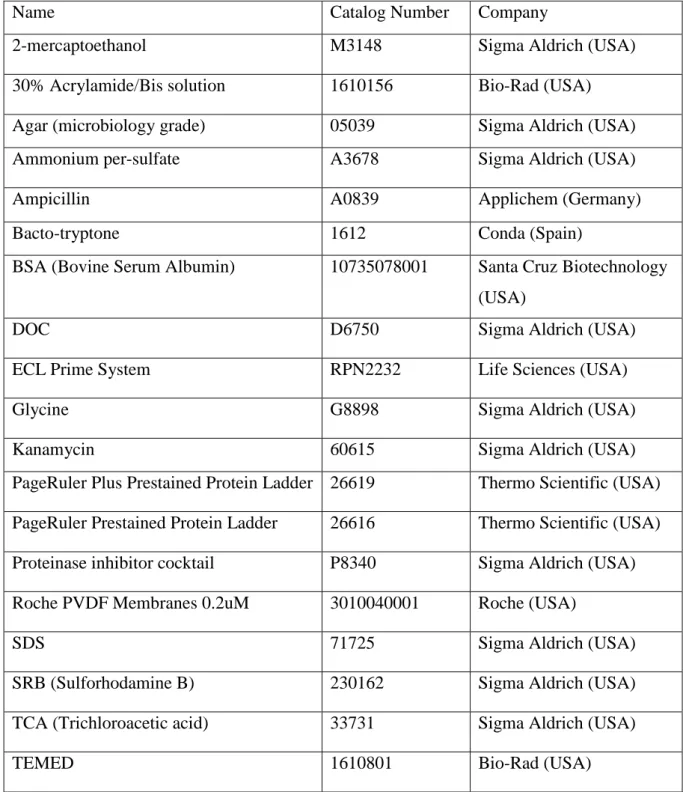
2.1. MATERIALS2.1.1 Reagents
Name Catalog Number Company
2-mercaptoethanol M3148 Sigma Aldrich (USA) 30% Acrylamide/Bis solution 1610156 Bio-Rad (USA) Agar (microbiology grade) 05039 Sigma Aldrich (USA) Ammonium per-sulfate A3678 Sigma Aldrich (USA)
Ampicillin A0839 Applichem (Germany)
Bacto-tryptone 1612 Conda (Spain)
BSA (Bovine Serum Albumin) 10735078001 Santa Cruz Biotechnology (USA)
DOC D6750 Sigma Aldrich (USA)
ECL Prime System RPN2232 Life Sciences (USA)
Glycine G8898 Sigma Aldrich (USA)
Kanamycin 60615 Sigma Aldrich (USA)
PageRuler Plus Prestained Protein Ladder 26619 Thermo Scientific (USA) PageRuler Prestained Protein Ladder 26616 Thermo Scientific (USA) Proteinase inhibitor cocktail P8340 Sigma Aldrich (USA) Roche PVDF Membranes 0.2uM 3010040001 Roche (USA)
SDS 71725 Sigma Aldrich (USA)
SRB (Sulforhodamine B) 230162 Sigma Aldrich (USA) TCA (Trichloroacetic acid) 33731 Sigma Aldrich (USA)
TEMED 1610801 Bio-Rad (USA)
13
Triton X-100 T8787 Sigma Aldrich (USA)
Trizma Base T1503 Sigma Aldrich (USA)
Tween-20 822184 Merck (Germany)
Yeast Extract 1702 Conda (Spain)
2.1.2 Buffers and Solutions
Buffer Recipe
10X PBS 80 g NaCl; 2 g KCl; 14.4 g Na₂HPO₄.2H₂O; 2.4 g KH₂PO₄ in 1 L dH₂O (pH=7.4)
10X Running Buffer 15 g Trizma Base; 72 g glycine; 5 g SDS in 1 dH₂O 10X TBS 24 g Trizma base; 88 g NaCl in 1 L H₂O. pH = 8.0 5X Protein Loading Buffer 0.001g Bromophenol blue; 2g SDS; 62.5 mM Tris-HCL
(pH:6.8); 15% glycerol
5% β-mercaptoethanol is added before loading
Cell lysis buffer 30 µl 5M NaCl; 50 µl 1M Tris-HCL (pH = 8.0); 100 µl 10X Proteinase inhibitor; 12.5 ul 10% SDS; 1.25 µl Triton X-100; 50 μl 10% DOC. up to 1 mL ddH₂O
LB 10 g Tryptone; 10 g NaCl; 5 g Yeast Extract in 1 L dH₂O LB Agar 10 g Tryptone; 10 g NaCl; 5 g Yeast Extract; 15 g Bacto
Agar in 1 L dH₂O
Mild Stripping Buffer 15 g glycine; 1gr SDS; 10 ml Tween-20 in 1 L ddH2O Ponceau S staining solution 1gr Ponceau S; 50 ml acetic acid. Up to 100 ml dH₂O TBS-T (0.2%) 1 ml 0.2% Tween 1X 500 ml TBS
Wet Transfer Buffer 6 g Trizma Base; 28 g glycine; 20% Methanol. up to 1 L dH₂O
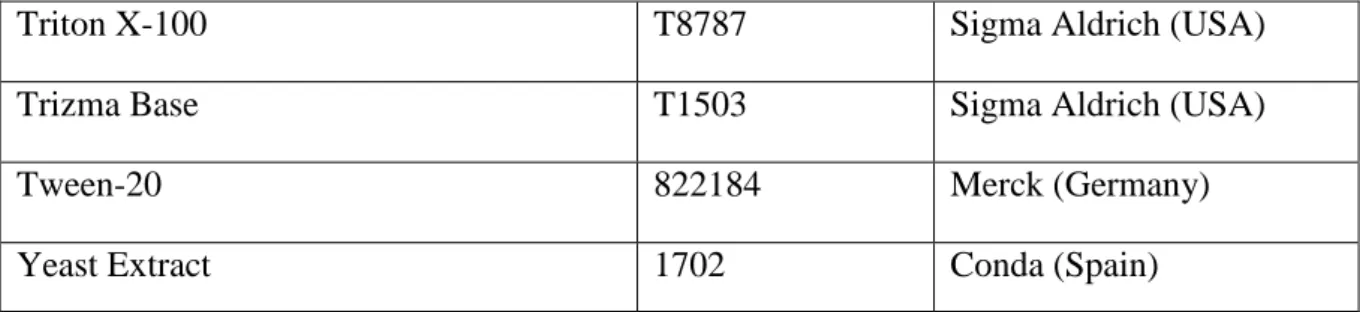
14 2.1.3 SDS-PAGE Gel
8% Resolving Gel (Total: 10 ml) 5% Stacking Gel (Total: 5 ml)
ddH20 3.380 ml ddH20 3.4 ml
30% Acrylamide/Bis mix 2.66 ml 30% Acrylamide/Bis mix 0.85 ml 1M Tris HCl (pH 8.8) 3.75 ml 1 M Tris HCl (pH 6.8) 0.625 ml 10% SDS 0.1 ml 10% SDS 0.005 ml 10% APS 0.1 ml 10% APS 0.005 ml TEMED 8 μl TEMED 5 µl 2.1.4 Antibodies Antibody Catalog Number Company Concentration for WB Rabbit polyclonal
anti-α-ATAD2 antibody*
1/1000 Mouse monoclonal anti-ERα
antibody
sc-8002 Santa Cruz Biotechnology (USA)
1/200 Mouse monoclonal anti-E
Cadherin antibody
ab1416 Abcam (UK) 1 µg/mL Mouse monoclonal
anti-Vimentin antibody
ab8069 Abcam (UK) 1/2000 Mouse monoclonal
anti-Occludin antibody
33-1500 Thermo Fisher (USA) 0.5 µg/mL Rabbit polyclonal anti-Slug
antibody
ab27568 Abcam (UK) 1/1000 Mouse anti-Integrin α5
antibody
4705 Cell signaling Technology (USA)
1/1000 Mouse monoclonal
anti-β-Actin antibody
A5441 SIGMA 1/10.000
Anti-rabbit IgG- HRP 6154 Sigma-Aldrich (USA) 1/5000 Anti-mouse IgG-HRP A0168 Sigma-Aldrich (USA) 1/5000
* ATAD2 primary antibody was produced and kindly provided by Dr. Mehmet Öztürk’s lab.
Table 2.3: Solutions and their amounts for preparing SDS-PAGE Gel
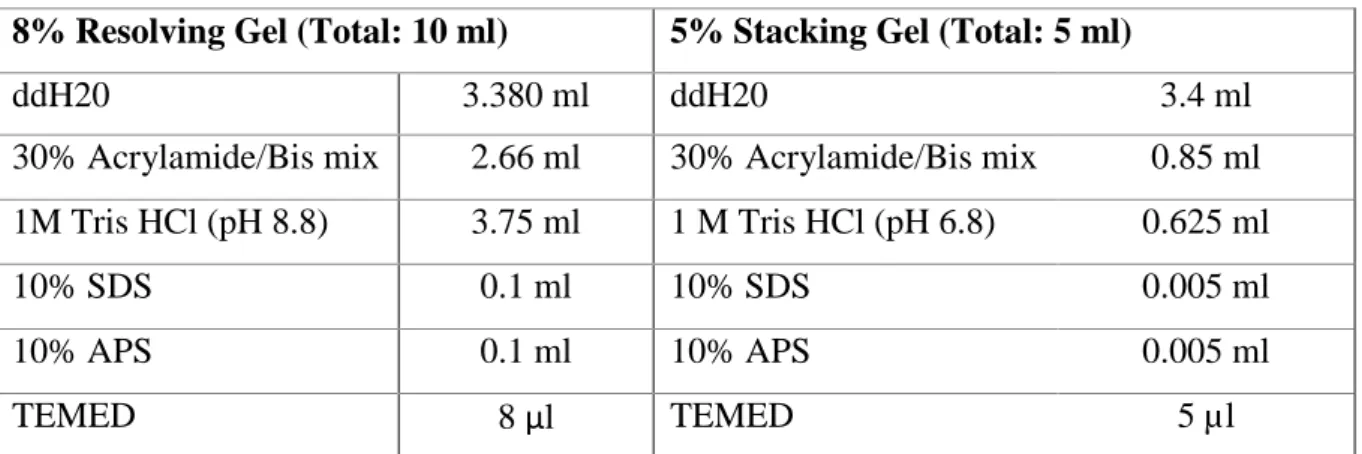
15 2.1.5 Kits
Kit Name Catalog Number Company
DyNAmo HS SYBR Green qPCR Kit F-410L Thermo Scientific (USA) Pierce BCA Protein Assay kit LSG-23227 Thermo Scientific (USA) PureLink Quick Plasmid Miniprep Kit K210011 Thermo Scientific (USA) RevertAid First Strand cDNA Synthesis
Kit
K1622 Thermo Scientific (USA) Nucleospin RNA extraction kit 740955 Macherey Nagel (Germany) 2.1.6 PCR Primers
PCR primers that were used in RT-qPCR analysis were given in Table 2.6 with their Tm values. Primers were dissolved in nuclease-free water to a final concentration of 100 μM upon arrival.
Primers Sequence Tm (°C) Size (bp)
GAPDH F GGCTGAGAACGGGAAGCTTGTCAT 60 140 GAPDH R CAGCCTTCTCCATGGTGGTGAAGA ATAD2 F TGAAAAGGCTTTGGCAATTC 60 167 ATAD2 R TTGCGATGCCGATAAATACA CDH1 F CCCGGGACAACGTTTATTAC 58 72 CDH1 R GCTGGCTCAAGTCAAAGTCC CDH2 F ACAGTGGCCACCTACAAAGG 58 201 CDH2 R CCGAGATGGGGTTGATAATG FN F CTGGCCGAAAATACATTGTAAA 58 114 FN R CCACAGTCGGGTCAGGAG SNAI2 F TGGTTGCTTCAAGGACACAT 58 66 SNAI2 R GTTGCAGTGAGGGCAAGAA VIM F GGTGGACCAGCTAACCAACGA 58 183 VIM R TCAAGGTCAAGACGTGCCAGA ZEB1 F GGGAGGAGCAGTGAAAGAGA 58 70 ZEB1 R GGGAGGAGCAGTGAAAGAGA ZEB2 F AAGCCAGGGACAGATCAGC 58 74 ZEB2 R CCACACTCTGTGCATTTGAACT Table 2.5: Kits that were used
16 2.1.7 Equipment
Instrument Company
Leica (Germany) Amersham Imager 600 Dharmacon (USA) AutoFlow NU-8500 Water Jacket CO2
Incubator
NuAire (USA)
Centrifuges 5810 and 5810 R Eppendorf (Germany) PCR Thermal cycler
Stratagene Mx3005P Real-Time PCR System Agilent (USA)
2.1.8 Cell Culture Reagents
Reagent Catalog
Number
Company
Dimethyl sulfoxide (DMSO) A3672 Applichem (Germany)
DMEM BE12-707F Lonza
FBS (Fetal Bovine Serum) CH30160 GE Healthcare (UK) L-glutamine BE17-605E Lonza (Switzerland) Lipofectamine 2000 Transfection Reagent 11668027 Thermo Scientific (USA) Non-Essential Amino Acids 1140-035 Gibco (USA)
OptiMEM 11058021 Gibco (USA)
PBS (Phosphate Buffer Saline) SH30256 GE Healthcare (UK) Penicillin/Streptomycin DE17-602E Lonza (Switzerland)
RPMI 1640 BE12-702F Lonza (Switzerland)
Sodium Pyruvate BE13-115E Lonza (Switzerland)
Trypsin/EDTA SV30031 GE Healthcare (UK)
Geneticin 10131-27 Gibco (USA)
2.1.9 Cell Lines and Their Growth Mediums
Cell Lines Medium
MCF7 DMEM; 10% FBS; 1% non-essential amino acids, 1% penicillin/streptomycin
Table 2.7: Equipment that were used in experiments
Table 2.8: Reagents used in cell culture studies
17
T47D RPMI 1640; 10% FBS; 1% non-essential amino acids, 1 mM sodium pyruvate; 1% penicillin/streptomycin
MDA-MD-231 DMEM; 10% FBS; 1% non-essential amino acids, 1% penicillin/streptomycin
SK-BR-3 DMEM; 1% L-glutamine; 10% FBS; 1% non-essential amino acids, 1 mM sodium pyruvate; 1% penicillin/streptomycin
2.1.10 Nucleic Acids
Name Catalog
Number
Company Target Sequence
pSuper-GFP/Neo VEC-PRT0006 OligoEngine pSR-ERα-458: 5′-TTC AGA TAA TCG ACG CCA G-3′
pSR-ERα-499: 5′-GTA CCA ATG ACA AGG GAA G-3′
ATAD2 SureSilencing shRNA Plasmid
336313 Qiagen consists of 4 shRNA plasmids targeting different parts of ATAD2 gene
2.2 METHODS
2.2.1 Maintenance and Handling of Cell Lines
After cells were thawed a in 37°C water bath until a small piece of ice remained, the complete medium was added and cells were centrifuged at 1500 rpm for 5 minutes. The supernatant was discarded and the pellet was dissolved in fresh growth media. The cells were seeded to T25 flasks. All cell types were grown in CO2 incubators at 5% CO2 and 37°C. Each time they reached 90% confluency, they were passaged. To freeze cells, the medium was aspirated and the flask was washed with 1X PBS. Then the cells were incubated in 0.25% Trypsin/EDTA for about 5 minutes in order to detach them from the surface. Detached cells were collected with fresh growth media and centrifuged at 1500 rpm for 5 minutes. The supernatant was discarded and the pellet was dissolved in fresh prepared 10% DMSO containing FBS. The cells were preserved at liquid nitrogen in cryoveils. All cell culture practices were performed under cell culture laminar flow hoods by using sterile techniques.
18
2.2.2 Bacterial Transformation and Plasmid Isolation
Competent DH5α cells were thawed on ice. 50 µl cells were mixed with 100 ng vector in cold eppendorf by flipping several times. Then, the tubes were incubated on ice for 30 minutes, in a water bath at 42°C for 45 seconds and on ice for 2 minutes, respectively. Then, the transformed cells were grown in 300 µl LB at 37°C with constant shaking for 1h. Next, they were spread on 1X ampicillin containing LB agar plates and incubated at 37°C overnight. Next morning, a single bacterial colony was selected and grown in a 200 µl LB with antibiotics as a starter culture for 2 hours. After the incubation, they were transferred into a bigger flask with 300 ml LB to grow overnight. Next day, plasmids were isolated using Qiagen Plasmid MidiPrep Kit according to the manufacturer’s instructions. The concentrations of plasmids as well as A260/A280 and A260/A230 were measured by NanoDrop.
2.2.3 Kill Curve and Determination of Selection Antibiotic Concentration
shRNAs targeting ATAD2 and ERα contain neomycin resistance genes. To create stable clones, a minimum geneticin concentration that kills non-transfected cells should be determined for each cell line. For this purpose, cells were treated with various concentrations of G418 and their survival was determined by the SRB assay. 50.000 cells/well were seeded in triplicates in 24 well. After 1-day of incubation, 0, 200, 400, 600, 800, 1000 µg/mL antibiotics were applied to the cells with fresh medium. The cells were grown for 2 weeks with medium change every 3 days. Then, SRB was performed. The medium was sucked and cells were washed with PBS. Next, the cells were fixed with ice cold 10% TCA at +4°C for 1 hour. After fixation, the cells were washed with autoclaved water 5 times and they were left to air dry. SRB was added to each well and the cells were incubated at room temperature for 10 minutes. The cells were washed with 1% acetic acid 5 times and they were left to air dry one more time. SRB was dissolved in 0.5X TBS and absorbance was measured at 546 nm. The minimum concentration that killed all cells was detected and used as the selection concentration.
2.2.4 shRNA Plasmid Transfection
250.000 cells/well were seeded in a 6 well plate. The cells were incubated one day. 2 µg ATAD2 vector or 3 µg ERα vector was diluted in 250 µl OPTIMEM while 5 µL transfection reagent lipofectamine 2000 was diluted in 250 µl OPTIMEM. Lipofectamine was incubated in OPTIMEM for 5 minutes. Then, the vector was added into lipofectamine dropwise. They were
19
mixed and incubated for 20 minutes. Then, the mixture was added to wells dropwise and the plate was shaken back and forth. After 4 hours, the medium was changed with antibiotic-free fresh medium. Cells were grown for 72 hours. After incubation, the cells were seeded into the 150 mm dish sparsely to allow single cell colony formation. The cells were treated with antibiotics at the selection concentration determined by the kill curve. The medium was refreshed every 3 days. When colonies were formed, a single colony was picked and grown further.
2.2.5 Pellet Collection, RNA Isolation from Cell Pellets and cDNA Synthesis
To collect the pellets, the cells were trypsinized and centrifuged at 1500 rpm at +4°C for 5 min. Then the supernatant was dissolved in ice-cold PBS and centrifuged one more time under the same conditions. The supernatants were discarded and pellets were snap frozen in liquid nitrogen. RNA was isolated from the pellets using the MN Nucleospin RNA Kit according to the manufacturer’s protocol. RNA concentration as well as the 260/280 ratio and 260/230 ratio were measured using a Nanodrop. 260/230 and 260/280 ratios around 2 were accepted as pure. cDNA was synthesized from isolated RNA using the RevertAid First Strand cDNA Synthesis Kit according to the kit’s protocol. 100 ng of RNA and oligo(dT) primers were used in the cDNA synthesis.
2.2.6 qRT-PCR
DyNAmo HS SYBR Green qPCR kit was used for the qPCR experiments. Total reaction volume was 10 µl and contained 2 µl cDNA, 0.2 µl 10 µM forward primer, 0.2 µl 10 µM reverse primers, 5 µl master mix and 2.6 µl nuclease free water. QPCR was performed in duplicate and the reaction conditions were as follows:
Initial denaturation: 95°C for 15 minutes Denaturation: 94°C for 20 seconds,
Annealing: Tm for 20 seconds 40 cycles Extension: 72°C for 15 seconds
Melting curve: 95°C for 1 minute 55°C for 10 seconds
20 95°C for 30 seconds
The Ct values of each well were obtained at the end of the qPCR reaction and the average of the duplicates was calculated. GAPDH was used as a housekeeping gene. All samples were normalized according to their respective GAPDH values. ΔCt was calculated by subtracting the gene of interest from the housekeeping gene. 2-ΔCt was calculated and graphs were drawn with these results.
2.2.7 Protein Isolation and Quantification of Proteins’ Concentration
Pellets were collected as described in section 2.5.5. The content of the cell lysis buffer was given in the Materials section. Depending on the pellet size, 50-75 µL cell lysis buffer was added on each pellet. The pellets were dissolved and incubated on a shaker at +4 for 30 minutes. Then, tubes were centrifuged at 13.000 rpm for 40 minutes at +4°C. The supernatants were transferred into new tubes. The BCA Protein Assay Reagent Kit was used according to the manufacturer’s protocol for protein quantification. Standards and samples were prepared in triplicates to a 96 well plate. 2 mg/mL BSA was diluted to 0.1 mg/ml. A standard line was calculated using the indicated BSA concentrations in Table 2.11 µl protein with unknown concentration was diluted with 999 µl dH₂O. 100 µL working reagent (A:B = 1:50) was added to each well. The plate was incubated at 37°C in the dark for 40 minutes. Absorbance was measured at 562 nm wavelength with a microplate reader. According to the standard curve, the concentration of each protein was calculated.
dH₂O (μL) Albumin (μL) Final Concentration (μg/μL)
100 0 0 90 10 1 80 20 2 70 30 3 60 40 4 50 50 5 30 70 7 0 100 10
21 2.2.8 Western Blot
10% SDS-PAGE was prepared according to Table 2.3. The proteins were boiled with 4X protein loading dye at 95°C for 5 minutes before loading to the gel. The proteins were run at 80V until they passed the stacking gel and at 120V until the loading dye left the gel in 1X Running Buffer. Then, the proteins were transferred to the PVDF membrane with wet transfer at 250 mA for 2.5 hours in 1X Transfer Buffer. When the transfer was over, the membrane was blocked in 5% milk powder dissolved in 1X TBS-T for 1 hour at room temperature. Then, the membranes were incubated in primary antibodies overnight at 4°C on the shaker (primary antibodies were diluted in 3% BSA in 1X TBS-T). After the incubation, the membranes were washed with 1X TBS-T for 10 minutes 3 times and they were incubated in secondary antibodies for 1 or 1.5 h at room temperature on the shaker (secondary antibodies were diluted in 3% milk powder in 1X TBS-T). Excess antibodies were washed with 1X TBS-T for 10 minutes 3 times. The membranes were developed with ECL and visualized with the Amersham Imager 600. Western quantifications were done using the Image J program.
2.2.9 Mild Stripping
Membranes were stripped to check another protein in the same membrane. Mild stripping buffer content was given in the Materials section. Membranes were incubated in the stripping buffer on the the shaker for 10 minutes twice. Then, they were incubated in 1X PBS for 10 minutes on the shaker twice, again. Lastly, they were washed with 1X TBS-T on the shaker for 5 minutes twice. After stripping, the membranes were blocked with 3% milk for 1 hour at room temperature. When blocking was done, the membranes were incubated with the new primary antibodies on the shaker at 4°C overnight.
2.2.10 Scratch Assay
Cells were seeded in a 24 well plate in triplicates such that they reached 90% confluency the other day. 0.01% FBS containing media was used while cells were seeded in order to reduce their proliferation with FBS deprivation. One day after the cells were seeded, a scratch with a 200 µl pipette tip was drawn in the middle of the the each well. Then, the medium was aspirated and the wells were washed with PBS gently. The cells were maintained in 0.01% FBS-containing media and pictures were taken every 12 hours. At the back of each well, a line perpendicular to the scratches was drawn with a permanent marker and pictures were always
22
taken between these lines. The gap between the scratches was measured using ImageJ and graphs were drawn with GraphPad Prism 8.0.
2.2.10 Statistical Analysis
Statistical significance was determined using GraphPad Prism 8.0. Comparison of the scratch assays was done with one-way ANOVA. P values smaller than 0.05 were accepted as significant.
2.2.11 Microarray Data Analysis
ATAD2-silenced MCF7 and T47D microarray results were obtained in our lab previously. The reference EMT gene set was from the Molecular Signatures Database (MSigDB) v7.2, Gene set: HALLMARK_EPITHELIAL_MESENCHYMAL_TRANSITION. GSEA was performed to compare the EMT gene set with FC ≥ 1.5, p< 0.05 genes from theATAD2-silenced MCF7 and T47D cells. Leading edge genes, which were genes with higher enrichment scores, were extracted for further analysis.
23
3. RESULTS
3.1 Determination of Expression Changes of EMT genes in siATAD2-Transfected MCF7 and T47D cells
DEG analysis was performed by Buse Nurten Özel. Differentially expressed EMT-related genes (P<0.05, FC ≥ 1.5) in siATAD2-transfected MCF7 and T47D cells were determined. Leading edge subset of EMT genes that has the highest enrichment score is shown in Figure 3.1 in a heatmap. Upregulation of all these genes except HTRA1 and MATN2 promotes EMT and migration of different cancer cells. These EMT inducing genes are all downregulated with ATAD2 silencing in MCF7 and T47D cells. Moreover, HTRA1 and MAT2 expressions showed different expression patterns from the rest of the gene set. These results suggested that ATAD2’s role in EMT could be induction and it could promote the mesenchymal phenotype.
3.1 Kill Curves
Figure 3.1: Differentially expressed EMT-related genes with high enrichment scores in siATAD2-transfected MCF7 and T47D cells
24
To investigate the effect of ATAD2 on EMT, it was decided to downregulate ATAD2 and the effect of this downregulation on EMT was evaluated. ATAD2 and ERα was known to interact with each other. It was also intended to be silence ER to analyze the dependence of the effect of ATAD2 on EMT.ATAD2 and ERα plasmids that were going to be used for silencing contain a neomycin resistance gene. To produce stable clones, kill curves were drawn for the neomycin analog, geneticin, for four cell lines. The cell lines were grown in concentrations ranging from 0 to 1000 μg/mL geneticin-containing medium for 14 days. Then SRB was performed and the absorbance was measured. Based on the measured absorbance values, the relative cell number vs the geneticin concentration graphs were drawn in Graphpad and the geneticin concentration in which all cells were dead was determined as the selection concentration. The concentratios used for selection were 800 μg/mL for MCF7, 400 μg/mL for T47D, 800 μg/mL for MDA-MB-231, and 600 μg/mL for SK-BR-3. (Figure 3.2) After shRNA transfection, the selected concentrations of geneticin were added to the medium to select colonies. Also, the selected colonies were grown in a medium containing the selected antibiotic concentrations to create stable clones.
Figure 3.2: Kill curves for MCF7, T47D, MDA-MB-231 and SK-BR-3 cell lines for stable transfection
Kill curves for MCF7, T47D, MDA-MB-231 and SK-BR-3 cell lines. Cell lines were grown in indicated concentration geneticin containing mediums for 14 days. 800 μg/mL for MCF7, 400 μg/mL for T47D, 800 μg/mL for MDA-MB-231 and 600 μg/mL for SK-BR-3 were selected concentrations. Cells were seeded in triplicates.
0 200 400 600 800 1000 0 50 100 MCF7 geneticin conc (µg/mL) re la ti v e c e ll n u m b e r 0 200 400 600 800 1000 0 50 100 T47D geneticin conc (µg/mL) re la ti v e c e ll n u m b e r 0 200 400 600 800 1000 0 50 100 MDA-MD-231 geneticin conc (µg/mL) re la ti v e c e ll n u m b e r 0 200 400 600 800 1000 0 50 100 SK-BR-3 geneticin conc (µg/mL) re la ti v e c e ll n u m b e r
25 3.2 shATAD2 and shERα Plasmid Selection
The most efficient sh(ATAD2) and sh(ER) plasmids should be determined in order to effectively silence these genes in cell lines. All cell lines were transfected with four shATAD2 plasmids, and the ER+ cell lines MCF7 and T47D were transfected with two ERα plasmids. After 72 hours, the pellets were collected and western blots were performed. Actin was used as a loading control and all cells were normalized to their corresponding actin band. In MCF7, sh(ATAD2) plasmid 1 which reduced ATAD2 protein expression almost by half was selected to be used in further studies for silencing. (Figure 3.3A) In T47D cells, sh(ATAD2) plasmid 4 reduced ATAD2 expression by almost 50% and it was used for further studies. (Figure 3.3B) sh(ATAD2) plasmid 4 which was most efficient in mda-mb-231 cells, was selected. It inhibited ATAD2 expression by more than 50%. (Figure 3.3C) sh(ATAD2) plasmid 2 which decreased ATAD2 expression by 15% was selected for SK-BR-3 cells for further studies. (Figure 3.3D) Moreover, efficient ERα plasmids were determined for ER+ cell lines. Western blots were performed with pellets and actin normalization was performed. Both ER plasmids reduced ER expression by 30% compared to control in MCF7 cells. It was decided to use both of them in MCF7 cells to reduce ERα expression. (Figure 3.3E) In T47D cells, both ER plasmids reduced ER protein expression by almost 25%. (Figure 3.3F) Both ER plasmids were used in T47D cells to inhibit ERα expression.
26
27
28
3.3 Effect of ATAD2 and ERα Silencing on EMT Gene Expression
After plasmid selection, MCF7 and T47D cells were transfected with empty ER vector shC(ER), ER silencing vectors sh(ER459), sh(ER499); empty ATAD2 vector shC(ATAD2) and ATAD2 silencing vector sh(ATAD2). No colony could be grown after sh(ER459) transfection in MFC7 cells. Two colonies named as sh(ER459) C1 and sh(ER459) C2 were selected for further growth in T47D cells. Moreover, two colonies named as sh(ER499) C1 and sh(ER499) C2 were selected for sh(ER499) transfection in MCF7 and T47D cells. Also, one colony for control plasmids and one colony for sh(ATAD2) plasmid were selected for further growth. In order to be able to detect protein expression changes in EMT markers, all selected colonies were grown for 4 passages, which is around 2 weeks. ER silencing vector transfected colonies were transfected with sh(ATAD2) vector after 2 weeks of growth period. The transfection protocol was performed as described in the Methods section unless colony selection was not performed after sh(ATAD2) transfection. After cells were grown, the pellets were collected. These pellets were used for q-PCR and western blot analysis. In q-PCR analysis, ATAD2 expression was checked in all cell lines to evaluate ATAD2 silencing. Also, E-cadherin as an epithelial gene and n-cadherin, vimentin, slug, ZEB1, ZEB2 and fibronectin as mesenchymal genes were investigated in all cell lines to interpret the EMT states.
Wild type ATAD2 was downregulated with sh(ATAD2) plasmid in MCF7 cells. ATAD2 silencing did not affect e-cadherin expression but ER silencing downregulated it. ATAD2 inhibition in ER-silenced MCF7 cells did not change e-cadherin expression as well. Vimentin expression was induced with ER silencing, and ATAD2 inhibition in ER-silenced cells downregulated this vimentin expression. ZEB1 and slug gave expression patterns similar to vimentin. ZEB2 expression was upregulated with ER downregulation and ATAD2 silencing Figure 3.3: Efficiency of sh(ATAD2) plasmids in MCF7, T47D, MDA-MB-231 and SK-BR-3 cells and sh(ER) plasmids in MCF7 and T47D cells.
(A-D) Cells were transfected with control and sh(ATAD2) plasmid. After 72 hours, pellets were collected and western blot was performed to asses silencing efficiency.
(E-F) MCF7 and T47D cells were transfected with control and sh(ER) plasmids. After 72 hours, pellets were collected and western blot was performed.
All westerns were normalized according to actin loading control. Graphs show relative protein expression with respect to wild type cells.
29
did not affect it. Fibronectin and n-cadherin were not expressed in MCF7 cells. Mesenchymal markers expressions were low in wild type MCF7 cells. Control plasmid transfection did not affect the expression of EMT markers. A change in the mRNA levels of EMT genes indicated that ER silencing may induce a mesenchymal phenotype while ATAD2 silencing in ER silenced MCF7 cells inhibited this induction. (Figure 3.4A)
ATAD2 was successfully downregulated in T47D cells, too. ATAD2 downregulation did not affect the expression of any of the investigated EMT genes. On the other hand, when ERα was silenced, epithelial marker e-cadherin expression was downregulated and mesenchymal markers vimentin, slug, ZEB1 and ZEB2 were upregulated. This suggests a possible shift to mesenchymal phenotype with ER silencing. When ATAD2 was downregulated in ER silenced cells, mesenchymal markers vimentin, slug and ZEB1 were inhibited. The expression of ZEB2, another mesenchymal marker, was upregulated in two colonies transfected with one ER plasmid while it did not change in colonies transfected with other ER plasmid. E-cadherin expression was not affected by ATAD2 silencing in ER-silenced T47D cells. Fibronectin and n-cadherin were not expressed in T47D cells. All these changes may indicate a downregulation in mesenchymal phenotype with ATAD2 silencing. (Figure 3.4B)
30 A. MCF7
31
Figure 3.4: EMT gene expression changes in MCF7 and T47D cells B. T47D
32
Mda-mb-231 and sk-br-3 cells were ER-. They were transfected with empty ATAD2 vector shC(ATAD2) and selected sh(ATAD2) plasmids. One colony for shC(ATAD2) and two colonies for sh(ATAD2) were selected and grown further. ATAD2 mRNA level was downregulated with sh(ATAD2) plasmid in both colonies in mda-mb-231 cells. This downregulation caused a change in the expression of most the investigated genes. E-cadherin, which is an epithelial marker, is upregulated upon ATAD2 silencing while n-cadherin and vimentin, which are mesenchymal markers, were downregulated. Slug, ZEB1 and ZEB2 were transcription factors which induces EMT. They were inhibited with ATAD2 silencing. Fibronectin expression did not seem to be affected by ATAD2 silencing. No slug mRNA expression could be detected in mda-mb-231 cells. It can be concluded that ATAD2 downregulation reduced mesenchymal marker expressions while inducing epithelial marker expressions in mRNA level in mda-mb-231 cells.
ATAD2 mRNA level was downregulated with sh(ATAD2) transfection in both colonies in other ER- cell line sk-br-3. Upon this ATAD2 downregulation, EMT inducing transcription factors ZEB1, ZEB2 and slug expression were downregulated, too. Fibronectin was not effected from ATAD2 silencing. E-cadherin, N-cadherin and vimentin mRNA expressions could not be detected in sk-br-3 cells. This shows an inhibition in the mesenchymal phenotype of sk-br-3 cells.
Figure 3.4: EMT gene expression changes in MCF7 and T47D cells
ATAD2 and ER silenced MCF7 and T47D colonies were grown for 2 weeks. Also, ATAD2 was downregulated in ER-silenced colonies. ATAD2 expression was downregulated in both MCF7 (A) and T47D (B) cells. E-cadherin, vimentin, slug, ZEB1 and ZEB2 mRNA expression changes upon ATAD2 and ER silencing in MCF7 (A) and T47D (B) cells were shown in graphs. Experiment was done in duplicates, once. GAPDH was used as control and expression of each gene was normalized to GAPDH. * p < 0.05, ** p < 0.005 ***, p< 0.0005
33 A. MDA-MB-231
34
Figure 3.5: EMT gene expression changes in mda-mb-231 and sk-br-3 cells
ATAD2 silenced MDA-MB-231 and SK-BR-3 cells were grown for 2 weeks. ATAD2 gene cxpression was reduced in both mda-mb-231 (A) and sk-br-3 (B) colonies. E-cadherin, n-cadherin, vimentin, slug, ZEB1, ZEB2 and fibronectin mRNA expression changes upon ATAD2 silencing in mda-mb-231 (A) and sk-br-3 (B) cells were shown in graphs. Experiment was done in duplicates once. GAPDH was used as control and expression of each gene was normalized to GAPDH. * p < 0.05, ** p < 0.005 ***
![Figure 1.3: EMT in cancer cells and epithelial and mesenchymal cell markers [58]](https://thumb-eu.123doks.com/thumbv2/9libnet/5562339.108563/22.892.118.770.260.466/figure-emt-cancer-cells-epithelial-mesenchymal-cell-markers.webp)