Examination of the various chemical properties of the Hizan
region (Bitlis-Turkey) honey types
Omer Kilic
1, Mehmet Ali Kutlu
2, Fethi Ahmet Ozdemir
31Department of Park and Garden Plants, Technical Science Vocational College, Bingol University, 12000, Bingol, Turkey; 2
Beekee-ping, Research, Development, Applications Centre Offices, Bingol University, 12000, Bingol, Turkey; 3Department of Molecular
Bio-logy and Genetics, Faculty of Science and Art, Bingol University, 12000, Bingol, Turkey - E-mail: [email protected], Summary. The objective of this study was to examine the various chemical properties of the honey samples
acquired from 20 different locations in the Hizan district of the Bitlis province. All samples were acquired from the apiarists who are members of the Hizan Beekepers Association. To this end; analyses have been carried out for moisture, insoluble solid substance, diastasis activity, electrical conductivity, proline, ash, total sugar, free acidity, HMF, fructose ratio, glucose ratio, fructose/glucose ratio in 100 g, fructose+glucose amount in 100 g in terms of grams. The moisture values of the samples were determined to vary between 15.44%- 17.28%, insoluble solid substance amount was determined to vary between 0.001% - 0.080%, diastasis num-ber between 10.0 mg/100 g - 26.1 mg/100 g, electrical conductivity value between 0.18 ms/cm-1 - 0.25 ms/
cm-1, proline amount between 414.2 mg/kg - 880.8 mg/kg, ash amount between 0.01% - 0.07%, total sugar
average between 69.09% - 75.28%, free acidity value between 16.0 meq/kg - 26.1 meq/kg, HMF value be-tween 6.5 mg/kg - 20.8 mg/kg, fructose ratio bebe-tween 27.9 mg/100 g - 41.3 mg/100 g, glucose ratio bebe-tween 30.6 mg/100 g - 34.6 mg/100 g, fructose/glucose ratio between 1.19 g/100 g - 1.28 g/100 g, fructose+glucose amount in 100 grams in terms of grams was determined to vary between 67.5 g/100g - 75.9 g/100 g. It was determined that none of the honey samples contained maltose and that only the samples acquired from Gayda and Keklik villages had very small amounts such as 2.7 mg/100 g and 2.1 mg/100 g. It was determined as a result of the studies carried out on the honey samples that especially proline amount was high. The fact that there was no sucrose in any of the honey samples except two put forth that no sugar has been used for feed-ing the bees. It was observed that the results were in accordance with the EU standards as well as the Turkish Food Codex Notification on Honey.
Key words: honey, chemical property, Hizan district
Introduction
Honey is a valuable food that is obtained from the nectars of flowers or as a result of the collection, transformation and processing of the living parts of flowers or the substances roduced in the secretion of bugs that suck the living parts of such flowers which is preserved in a bee hive until it matures (1). Honey chemically consists of 70-80% sugar, 10-20% water, organic acid, mineral, vitamin, protein, phenolic compounds and free amino acids with fundamental monosaccharides of fructose and glucose (2).
The changes in the chemical composition of honey may arise due to its various biochemical properties (3). The quality of honey is mostly determined due to its sensory, chemical and microbiological characteristics. The criteria that attract attention in honey are; moisture, insoluble solid substance, diastasis activity, electrical conductivity, proline, ash, free acidity and hydroxymethylyfurfuraldehyde (HMF) content (4).
The moisture content of honey is a parameter that is related with climate conditions. The moisture content of honey is required to ensure the sustainment of its stability as well as to prevent fermentation during
its storage. The moisture content of a mature honey is very low so as not to give way to the development of microorganisms. Fermentation will not take place in case the moisture content of honey is lower than 17% (5-7). High moisture in honey is an indication that water has been added or that the honey has not yet fully matured.
Diastasis is one of the natural enzymes in honey (4). Enzymes such as diastasis play an important role with regard to the biological value of honey (8). Changes in the diastasis activity depend on many factors such as the sucrose content of food sources, nectar flow rate, floral origin of the product and the age of the bee (9). Being subject to high temperature values and long storage durations may cause diastasis to be inactive (8).
The electrical conductivity of honey is related with the concentrations of mineral salts, organic acids and proteins. This parameter is quite important for the evaluation of the honey samples acquired from regions with different vegetation (10).
Honey contains; proline, lysine, histidine, arginine, aspartic acid, trionine, serine, glutamic acid, glycine, alanine, cystine, valine, methionine, isoleucine, leucine, tyrocine, phenylalanine, tryptophane as aminoacid and proline is the most distinctive among these (11, 12). Proline is the only aminoacid that is added to the honey by the bee during the transformation of the nectar to honey. The protein content of honey is generally stated in terms of its proline amount. Because proline makes up about 50-85% of the aminoacids (13, 14). Proline content varies significantly with regard to different honey types (15). The proline amount in honey is an indicator that reflects the maturity level of the honey such as saccharase and glucose oxidase activities together with other compounds the amounts of which depend on the bee (14).
The ash amounts in honeys vary with regard to the flora used by the bees (16). Excess honey ash is directly proportional with its dark color. The ash in the honey is made up of the mineral substances inside it. Organic acids are among the most important small compounds in honey. The most commonly found acid in honey is gluconic acid (17) and it is formed as a result of the effect of glucose oxidase enzyme on glucose. There is also formic, acetic, butyric, citric, lactic, maleic, malic, oxalic, pyrogluconic, succinic acid
in addition to gluconic acid. In addition, it is also stated that there is gliconic, α-ketoglutaric, pyruvic, tartaric, 2 or 3-phospho-glyceric acids (17). Monosaccharides undergo dehydration when heated in concentrated acid solution and transform into furan derivatives. 5-hydroxymethylfurfural (HMF) forms from aldohexose when aldopentoses transform to furfural. Honey is subject to heat treatment procedure in order to prevent its crystallization tendency or to remove its crystal appearance and to destroy the microorganisms that contaminate it. Diastasis activity decrease and HMF increase should be controlled during heat treatment application (18). Heat treatment application based on temperature and time might lead to the decrease of vitamins, nutrient elements and diastasis activity as well as increase of HMF amount (18, 19). Hence, enzyme activity and HMF content provide information regarding the maturity of natural honey and the degree of the heat treatment applied (20).
The aim of this study was to examine the chemical properties of honey samples acquired from 20 different locations in the Hizan region.
Materials and Methods
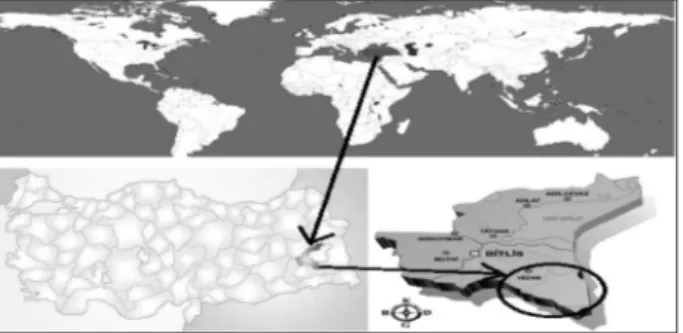
Hizan is located to the north west of the Hakkari Region of Eastern Anatolia (Fig. 1). It is a district of the Bitlis province with a surface area of 971 square kilometers. Hizan has a rough surface surrounded with high mountains. The 2400 meter high Panur mountain which is an extension of Southeast Taurus range is located to the west of the district, the 2950 meter high Sinegir Mountain is located to the east of the district, the 2700 meter high Hasteri Mountain is located to the south of the district. 70% of the district population live on agriculture and animal breeding and beekeeping is very important in this region.
Trips were made to 20 different locations in 2015 including Kocyiğit, Atlı, Hecter, Panur, Ballı, Yukarı Ayvacık, Gayda, Keklik, Kop suyu, Altınoluk, Gokçimen, Akdik, Harman Doven, Erencik and Ekinli where there are members registered to the Hizan honey manufacturers association in order to determine the various chemical properties of the honeys produced in the district (Fig. 2). Twenty 0.5 kg samples of extracted honey obtained from manufacturers in these areas were
placed in glass containers to be used as material. Moisture determination; according to IHC, S.09-11,2002 analysis method, insoluble dry substance determination; according to IHC, S.54,2002 analysis method, Diastasis number determination; according to IHC, S.38-40.2002 analysis method, electrical conductivity determination; according to IHC, S.38-40,2002, proline determination; according to IHC, S.58-59,2002 analysis method, raw ash determination; according to IHC, S.18-19,2002 analysis method, total sugar determination; according to Luff Schoorl analysis method, free acidity determination; according to IHC, S.20-22,2002 analysis method, HMF determination; according to IHC, S.25-27,2002 analysis method and sugar profile determination; according to AOAC 977,20.2010 analysis method using IR-MS device.
Statistical analysis was carried out using Duncan of IBM SPSS 20 for Windows. Probability of p< 0.05 was considered significant. Each treatment was divided into 3 replications.
Results
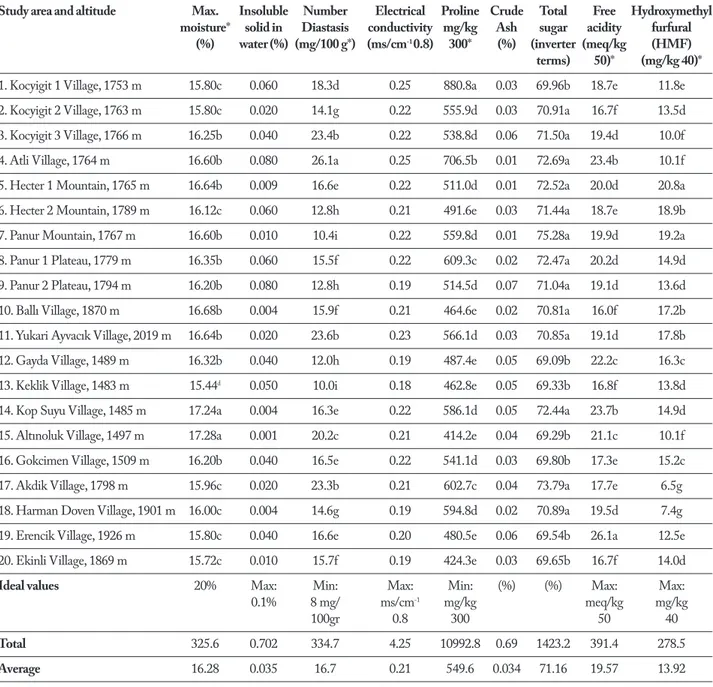
In this study, honey samples acquired from 20 different locations of the Hizan District of the Bitlis province were subject to analyses with regard to moisture, insoluble dry substance, diastasis activity, electrical conductivity, proline, ash, total sugar, free acidity, HMF, fructose ratio, glucose ratio, fructose/ glucose ratio in 100 g, fructose+glucose amounts in grams in 100 g and the results are given in Table 1 and Table 2. The average moisture value for the honey samples acquired from 20 different areas in the study was 16.28%; with the lowest moisture ratio of %15.44 obtained for the sample acquired from Keklik Village; the highest moisture ratio of 17.28% obtained for the sample acquired from the Altınoluk Village (Table 1). The moisture values of the honey samples examined differed in a statistically significant manner (p<0.05). The insoluble dry substance amount average for the honeys used in the study was 0.035%; with the lowest insoluble dry substance amount of 0.001% obtained for the honey sample from Altınoluk Village; whereas the highest insoluble dry substance amount of 0.080% was determined for the honey sample number 2 acquired from Atlı Village and Panur Plateau (Table 1). There
was no statistically significant difference between the insoluble dry substance amounts in honey samples (p>0.05). The average diastasis number for the honeys used in the study was determined as 16.7 mg/100 g; with the lowest diastasis activity determined for the honey sample acquired from Keklik Village with 10.0 mg/100 g; whereas the highest diastasis activity was obtained for the sample from Atlı village with 26.1 mg/100 g (Table 1). There was a statistically significant difference between the diastasis numbers of the honey samples used in the study (p<0.05). The electrical conductivity average value of the samples used in the study was determined as 0.21 ms/cm-1; with the
lowest electrical conductivity value obtained for the honey sample acquired from the Keklik Village with 0.18 ms/cm-1; the highest electrical conductivity value
obtained for the honey sample acquired from the Atlı Village and Kocyiğit Village number 1 with 0.25 ms/ cm-1 (Table 1). There was no statistically significant
difference between the electrical conductivity values of the honey samples examined (p>0.05).
The average proline amount for the honey
Figure 1. The geographical map of Hizan district.
Figure 2. Various photos of the Hizan region where honey
samples used in our study was a high value of 549.6 mg/kg; with the lowest proline amount obtained for the honey sample acquired from the Altınoluk Village with 414.2 mg/kg; whereas the highest proline amount was obtained for the honey sample number 1 acquired from the Kocyiğit Village with 880.8 mg/kg (Table 1). There was a statistically significant difference between the proline amounts for the honey samples (p<0.05). The average ash amount for the honey samples used in
the study was determined as 0.034%; with the lowest ash amount obtained for the honey samples acquired from Atlı Village, Hecter and Panur Mountains with 0.01%; whereas the highest ash amount was obtained for the honey sample number 1 acquired from the Panur Plateau with 0.07% (Table 1). There was no statistically significant difference between the ash amounts for the honey samples used in the study (p>0.05). The total sugar average for the honey samples acquired from 20
Table 1. Chemical analysis results for the 20 different honey samples acquired from the Hizan district
Study area and altitude Max. Insoluble Number Electrical Proline Crude Total Free Hydroxymethyl
moisture* solid in Diastasis conductivity mg/kg Ash sugar acidity furfural
(%) water (%) (mg/100 g*) (ms/cm-1 0.8) 300* (%) (inverter (meq/kg (HMF)
terms) 50)* (mg/kg 40)*
1. Kocyigit 1 Village, 1753 m 15.80c 0.060 18.3d 0.25 880.8a 0.03 69.96b 18.7e 11.8e 2. Kocyigit 2 Village, 1763 m 15.80c 0.020 14.1g 0.22 555.9d 0.03 70.91a 16.7f 13.5d 3. Kocyigit 3 Village, 1766 m 16.25b 0.040 23.4b 0.22 538.8d 0.06 71.50a 19.4d 10.0f 4. Atli Village, 1764 m 16.60b 0.080 26.1a 0.25 706.5b 0.01 72.69a 23.4b 10.1f 5. Hecter 1 Mountain, 1765 m 16.64b 0.009 16.6e 0.22 511.0d 0.01 72.52a 20.0d 20.8a 6. Hecter 2 Mountain, 1789 m 16.12c 0.060 12.8h 0.21 491.6e 0.03 71.44a 18.7e 18.9b 7. Panur Mountain, 1767 m 16.60b 0.010 10.4i 0.22 559.8d 0.01 75.28a 19.9d 19.2a 8. Panur 1 Plateau, 1779 m 16.35b 0.060 15.5f 0.22 609.3c 0.02 72.47a 20.2d 14.9d 9. Panur 2 Plateau, 1794 m 16.20b 0.080 12.8h 0.19 514.5d 0.07 71.04a 19.1d 13.6d 10. Ballı Village, 1870 m 16.68b 0.004 15.9f 0.21 464.6e 0.02 70.81a 16.0f 17.2b 11. Yukari Ayvacık Village, 2019 m 16.64b 0.020 23.6b 0.23 566.1d 0.03 70.85a 19.1d 17.8b 12. Gayda Village, 1489 m 16.32b 0.040 12.0h 0.19 487.4e 0.05 69.09b 22.2c 16.3c 13. Keklik Village, 1483 m 15.44d 0.050 10.0i 0.18 462.8e 0.05 69.33b 16.8f 13.8d
14. Kop Suyu Village, 1485 m 17.24a 0.004 16.3e 0.22 586.1d 0.05 72.44a 23.7b 14.9d 15. Altınoluk Village, 1497 m 17.28a 0.001 20.2c 0.21 414.2e 0.04 69.29b 21.1c 10.1f 16. Gokcimen Village, 1509 m 16.20b 0.040 16.5e 0.22 541.1d 0.03 69.80b 17.3e 15.2c 17. Akdik Village, 1798 m 15.96c 0.020 23.3b 0.21 602.7c 0.04 73.79a 17.7e 6.5g 18. Harman Doven Village, 1901 m 16.00c 0.004 14.6g 0.19 594.8d 0.02 70.89a 19.5d 7.4g 19. Erencik Village, 1926 m 15.80c 0.040 16.6e 0.20 480.5e 0.06 69.54b 26.1a 12.5e 20. Ekinli Village, 1869 m 15.72c 0.010 15.7f 0.19 424.3e 0.03 69.65b 16.7f 14.0d
Ideal values 20% Max: Min: Max: Min: (%) (%) Max: Max:
0.1% 8 mg/ ms/cm-1 mg/kg meq/kg mg/kg
100gr 0.8 300 50 40
Total 325.6 0.702 334.7 4.25 10992.8 0.69 1423.2 391.4 278.5
Average 16.28 0.035 16.7 0.21 549.6 0.034 71.16 19.57 13.92
different locations Hizan District of the Bitlis province was determined as 71.16%; with the lowest sugar ratio obtained for the honey sample acquired from the Gayda Village with 69.09%; whereas the highest total sugar ratio was obtained for the honey sample acquired from the Panur Mountain with 75.28% (Table 1). There was a statistically significant difference between the total sugar amounts of the honey samples studied (p<0.05). The average free acidity value of the honey samples used in the study was determined as 19.57 meq/kg; with the lowest free acidity value obtained for the honey sample acquired from the Ballı Village with 16.0 meq/kg; whereas the highest free acidity value was obtained for the honey sample acquired from the Erencik Village with 26.1 meq/kg (Table 1). There was a statistically significant difference between the free acidity values of the honey samples used in the study (p<0.05). The average HMF value for the 20 different honey samples used in the study was determined as 13.92 mg/kg; with the lowest HMF value obtained for the honey sample acquired from the Akdik Village with 6.5 mg/kg; whereas the highest HMF value was obtained for the honey sample acquired from the Hecter Mountain with 20.8 mg/kg (Table 1). There was a statistically significant difference between the HMF values of the examined honey samples (p<0.05). When the sugar profile of the honey samples used in the study are examined; it was observed that the lowest fructose ratio was obtained for the honey sample acquired from the Altınoluk Village with 27.9 mg/100 g; with the highest fructose ratio obtained for the honey sample acquired from the Hecter Mountain and Akdik Village with 41.3 mg/100 g (Table 2). There was a statistically significant difference between the fructose ratios of the honey samples used in the study (p<0.05). The lowest glucose ratio was obtained for the honey sample number 1 acquired from the Erencik Village and Kocyiğit Village with 30.6 mg/100 g; whereas the highest glucose ratio was obtained for the honey sample acquired from the Hecter Mountain with 34.6 mg/100 g (Table 2). There was a statistically significant difference between the glucose ratios of the honey samples used in the study (p<0.05). When the maltose amounts for the honey samples acquired from 20 different locations of the Hizan District were examined, it was observed that none of them contained maltose. Whereas sucrose was present only in the honey
samples acquired from the Gayda and Keklik villages and that these were very small values of 2.7 mg/100 g and 2.1 mg/100 g respectively (Table 2). There was no statistically significant difference between the sucrose values of the honey samples used in the study (p>0.05). When the fructose/glucose ratio for the 20 different honey samples used in the study were examined; the lowest fructose/glucose ratio was observed for the honey samples number 2 acquired from Keklik and Gokcimen Village and Hecter Mountain and Panur Plateau with 1.19 g/100 g; whereas the highest fructose/glucose ratio was obtained for the honey sample acquired from the Erencik Village with 1.28 g/100 g (Table 2). There was no statistically significant difference between the fructose/glucose ratios for the honey samples used in the study (p>0.05). When the fructose+glucose value in terms of grams is examined in 100 grams for the honey samples used in the study, it was observed that the lowest fructose+glucose (g/100 g) value was obtained for the honey sample acquired from the Gayda Village with 67.5 g/100 g; whereas the highest fructose+glucose (g/100 g) value was obtained for the honey sample acquired from the Hecter Mountain with 75.9 g/100g (Table 2).
There was a statistically significant difference between the fructose+glucose (g/100 g) values for the honey samples used in the study (p<0.05).
Discussion
Moisture ratio in honey is an indicator of its viscosity and quality (21) with a low percentage indicating its maturity and that it can preserve its naturality for a long period of time without crystallization (7, 22) determined in a study carried out in Van that the average moisture value of 20 honey samples was 17.8%; another study (23) determined the average moisture of 50 flower honey samples acquired from various regions of Turkey as 17.56%; Kurt et al., (24) determined the moisture amount in 12 extracted honey samples as 16.83%; Sunay et al., (25) carried out a study in which they determined the average moisture in flower honey samples as 18.31% and the average moisture of honeydew honey samples as 17.62%. The moisture values of the 20 different honey samples used in this study were between 15.44%- 17.28% and the
average moisture value was determined as 16.28%. When the data acquired from our study were compared with the aforementioned study data, it was observed that the average moisture amount in our study was quite lower in comparison with the other studies, that the honey samples used in the study were harvested on time and that they can preserve their naturalness for a long time without crystallizing.
Çetin et al., (23) carried out a study using 50 different honey samples in which it was put forth that the insoluble solid substance amount varied between 0.01%-0.09%, that the average insoluble solid substance value was 0.03%. The insoluble solid substance amount of the 20 different honey samples
used in our study varied between 0.001% -0.080% and the average insoluble solid substance value was determined as 0.035%. When the results of our study were compared with the data from the aforementioned studies; it was observed that the insoluble solid substance amount of the honey samples used in our study was at a very low value.
Diastase number is an important quality criteria and indicates the freshness of honey and for how long it has been stored under which conditions. Şahinler et al., (19) determined the diastase number average for the honey samples acquired from Hatay region as 17.9 g/100 g. According to the diastase number analysis carried out by Yılmaz (26) on various honey samples
Table 2. Chemical analysis results for the 20 different honey samples acquired from the Hizan district
Study area and altitude Fructose Glucose Maltose Sucrose Fructose/Glucose Fructose +
(mg/100 g) * (mg/100 g) * (mg/100 g) (mg/100 g) Glucose Glucose
g/100 g g/100 g*
Min:09-Max:1,4 Min:60
1. Kocyigit 1 Village, 1753 m 37.9e 30.6d - - 1.24 68.5e
2. Kocyigit 2 Village, 1763 m 38.3c 30.9d - - 1.24 69.2d
3. Kocyigit 3 Village, 1766 m 39.6b 32.2b - - 1.23 71.8c
4. Atli Village, 1764 m 39.8b 32.2b - - 1.24 71.9c
5. Hecter 1 Mountain, 1765 m 41.3a 34.6a - - 1.19 75.9a
6. Hecter 2 Mountain, 1789 m 40.0a 31.5c - - 1.27 71.5c
7. Panur Mountain, 1767 m 39.7b 32.9b - - 1.21 72.9b
8. Panur 1 Plateau, 1779 m 38.1c 32.0b - - 1.19 70.1d
9. Panur 2 Plateau, 1794 m 39.1b 32.2b - - 1.21 71.3c
10. Ballı Village, 1870 m 39.2b 31.8c - - 1.23 71.0c
11. Yukari Ayvacık Village, 2019 m 39.4b 31.3c - - 1.26 70.7d
12. Gayda Village, 1489 m 36.8f 30.7d - 2.7 1.20 67.5e
13. Keklik Village, 1483 m 36.8f 30.9d - 2.1 1.19 67.7e
14. Kop Suyu Village, 1485 m 39.9b 32.5b - - 1.23 72.4b
15. Altınoluk Village, 1497 m 27.9g 31,6c - - 1.20 69.5d
16. Gokcimen Village, 1509 m 37.1e 31.1c - - 1.19 68.2e
17. Akdik Village, 1798 m 41.3a 32.5b - - 1.27 73.8b
18. Harman Doven Village, 1901 m 39.4b 31.0c - - 1.27 70.4d
19. Erencik Village, 1926 m 38.8c 30.6d - - 1.28 69.2d
20. Ekinli Village, 1869 m 37.2e 30.7d - - 1.21 67.9e
obtained from various cities in the Southeastern Anatolia Region, it was determined that the diastase numbers varied between 10.2-30.2 g/100 g. Polat (27) carried out a study on chestnut honey in which the diastase activity of the honey was determined as 17.9. Devillers et al., (28), Küçük et al., (29), and Haroun (11) carried out studies in which they determined the diastase activities of the honey samples they used as 23.29, 17.7 and 9.93 respectively. The diastase number for the honey samples used in our study are within the 10.0 mg/100 g - 26.1 mg/100 g interval and the average diastase value was determined as 16.7 mg/100 g. When the results of our study were compared with the results from the aforementioned studies; it was determined that the values of our study were quite low which indicates that the honey samples used in our study were of high quality and were stored fresh and in good conditions.
The electrical conductivity of honey depends on the mineral substance content. Devillers et al., (28) carried out a study in which they determined the electrical conductivity of the honey samples they used as 1308 ms/cm-1, whereas Polat (27) determined
the electrical conductivity of the honey samples used in the interval of 1057-1172 ms/cm-1. The electrical
conductivity values of the 20 different honey samples used in our study varied between 0.18 ms/cm-1 - 0.25
ms/cm-1 and the average electrical conductivity value
was recorded as 0.21 ms/cm-1. When the results of
our study were compared with the results of the aforementioned studies; it was observed that the electrical conductivity values of the 20 different honey samples we used were quite low.
Proline is the only amino acid added by the honey during the transformation of nectar into honey. Yılmaz (26) determined the proline value interval for the honey samples acquired from Eastern and Southeastern Anatolia Regions to be between the 300-860 mg/ kg interval, whereas Oddo et al (30) determined the average proline amount for the honeydew honey samples in Europe as 468 mg/kg. Heredia et al. (31) carried out a study on Morocco honey samples in which the proline values were determined to vary between 315.9-770 mg/kg. A study carried out on Burkino Faso honey samples put forth the proline value to be between 437.8-2169.4 mg/kg (15). Bilgen Çınar (32) carried out analyses on Turkish pine honey
samples in which the proline amount was determined to vary between 569.41-653.83 mg/kg. The proline amount for the honey samples used in our study varied between the interval 414.2 mg/kg - 880.8 mg/ kg and the average proline amount was determined as 549.6 mg/kg. When the results from our study were compared with the results for the aforementioned studies; it can be stated that the proline amount of the honey samples we used were quite high and that they were very nutritious in terms of protein.
Ash ratio is one of the best indicators whether harvesting and beekeeping operations have been carried out at the desired levels or not. Terrab et al., (33) determined the ash ratio in the thyme honey samples then examined to be between 0.16-0.60%. Bilgen Çınar (32) carried out a study on the pine honey samples in Turkey in which the ash amount was determined to vary between 0.50-0.55%. Şahinler et al., (19) determined the ash values for the honey samples acquired from the Hatay region to be between 0.1% and 1.7% and the average ash ratio was determined as 0.32%. The ash amount for the honey samples acquired from the honey manufacturers in Ireland Island in two consecutive harvest periods was determined as 0.2% on average (34). It was determined that the ash content for the 49 honeydew and nectar honey samples acquired from the city of Madrid in Spain varied between 0.003% - 0.990% (35). Popek (36) put forth the total ash amount of Polish honeydew honey samples as 0.561%. The ash amount average for the 38 honey samples acquired from the Luso region of Portugal was determined as 0.35% (37). The average ash amount for the samples we used was determined as 0.034%; whereas the ash amount for the honey samples used in our study varied between 0.01% - 0.07%. When the results of our study were compared with the data acquired from the aforementioned studies were compared; it was observed that the ash ratio is quite low for the 20 different honey samples we used and that the harvesting and beekeeping methods are carried out at the desired level.
Free acidity contributes to the taste of honey, provides strength against microorganisms and increases chemical reactions as well as antibacterial and antioxidant properties. In addition, it also provides information about the origin of honey (38). Yılmaz et al. (39) determined the average free acidity value
for samples acquired from Eastern and Southeastern Anatolia regions as 22.3 meq/kg. Batu et al., (40) carried out a study in which average free acidity value was determined as 32.49 meq/kg for the samples studies while emphasizing that the free acidity values for the studied samples varied between 6.73 meq/kg - 47.06 meq/kg. Velioglu et al., (41) put forth that the average free acidity value for the sunflower honey samples was 14.35 meq/kg. The average free acidity value for the 20 different samples used in this study was 19.57 meq/kg and it was observed that the free acidity value of the honey samples used in the study varied between 16.0 meq/kg - 26.1 meq/kg. When the free acidity values acquired as a result of the study were compared with the results of the aforementioned studies, it was observed that the free acidity value of the 20 different honey samples used in our study were quite high, that the honey samples used in the study were tasty, resistant against microorganisms with high antibacterial and antioxidant properties.
HMF (hyroxymethylfurfural) forms in honey as a result of thermal treatment. HMF is one of the important quality criterion for honey. It was determined for 49 different honey samples sold commercially in Southern Spain without any thermal treatment applied that the HMF amount varied between 0.19-41.16 mg/ kg (20) and that the high HMF values were due to the climate conditions in Southern Spain. The HMF amount in different honey samples in Morocco which has a similar climate that can result in increaesd HMF content was determined to vary between 3.8 and 48.4 mg/kg (10). It was determined that the HMF value for Ireland honeys varied between 0.4-37.3 mg/kg and that the average HMF value was 7.0 mg/kg (34). Average HMF amount for different origin honeys sold in the Brazilian market was determined as 35.7 mg/ kg (42). Merin et al., (43) emphasized that the HMF amount right after the harvest for 72 honey samples in Israel varied between 0.32 and 18 mg/kg. Whereas the average HMF value for the honeys of Luso region in Portugal was determined as 9.41 mg/kg (37). İpek (44) determined as a result of the HMF analysis carried out on honey samples from Turkey that the HMF amount varied between 1.47-17.67 mg/kg. The HMF value of the honey samples used in our study was in the interval of 6.5 mg/kg - 20.8 mg/kg and the average HMF value for the honey samples used was determined as 13.92
mg/kg. When the HMF values acquired as a result of the study were compared with the aforementioned study results, it was observed that the HMF values and the average HMF values of the honey samples used in our study were relatively lower and it can be concluded that this result is due to the fact that the honey samples used in the study were not subject to thermal treatment or that some of the other samples had relatively high HMF values due to the climate conditions.
Oddo et al., (30) put forth that the fructose ratio in the honeydew honeys in Europe varied between 28.7-36.2% whereas the glucose ratio varied between 21.3-31.1% and that the total fructose and glucose in these honey samples was in the interval of 51.2-66.2%, whereas the fructose/glucose ratio varied between 1.01-1.48. Heredia et al., (31) determined the fructose and glucose amounts in Morocco honey samples to vary between 32.13-43.07%, 27.25-36.15% respectively. Another study carried out in Israel put forth that the fructose+glucose (invert sugar) amount varied between 70.1-79.2% (45). Özdemir et al., (46) carried out a study to distinguish flower honeys from honeydew honeys and emphasized during the study that the fructose amount varied between %39.42-42.20, whereas the glucose amount varied between 29.61-33.48%. Şahinler et al., (19) determined the fructose+glucose (invert sugar) as 66.2% for the Hatay region highland honey samples and as 69% for sunflower honey samples. It was determined in our study that the fructose ratio varied between 27.9 mg/100 g - 41.3 mg/100 g for the 20 different samples used, whereas the glucose ratio varied between 30.6 mg/100 g - 34.6 mg/100 g. It was determined that the fructose/glucose ratio varied between 1.19 g/100 g - 1.28 g/100 g and that the fructose+glucose amount per gram in 100 grams of honey varied between 67.5 g/100g - 75.9 g/100 g. When the results acquired as a result of our study were compared with the results of the aforementioned studies, it was observed that the honey samples used in our study had relatively high fructose and glucose amounts as well as high fructose/glucose ratio and fructose+glucose (invert sugar) amount. Maltose was not detected in the 20 different honey samples used in our study and sucrose was determined only in two samples. Thus, it can be concluded that sugar was not used for the feeding of the bees.
In conclusion, it was determined as a result of the chemical analysis result carried out on honey samples acquired from 20 different locations of Hizan district in the city of Bitlis that the studied samples were in accordance with the EU standards and the Turkish food codex honey regulation with regard to the studied parameters.
References
1. Mendes E, Brojo PE, Ferreira IMPLVO, FerreiraM. A. Quality evaluation of Portuguese honey. Carbohyd. Polym. 1998; 37: 219–223.
2. Nagai T, Inoue R, Inoue H, Suzuki N. Scavenging capacities of pollen extracts from Cistus ladaniferus on autoxidation, superoxide radicals, hydroxyl radicals and DPPH radicals. Nutrition Res. 2002; 22: 519–526.
3. Bogdanov S, Lüllmann C, Martin P, Von der Ohe W, Russ-mann H, Vorwohl G, Oddo LP, Sabatini AG, Marcazzan GL, Piro R, Flamini C, Morlot M, Lheretier J, Borneck R, Marioleas P, Tsigouri A, Kerkvliet J, Ortiz A, Ivanov T, D’arcy B, Mossel B, Vit P. Honey quality, methods of analy-sis and international regulatory standards: review of the work of the international honey comission. Mitt. Lebensm. Hyg. 1999; 90: 108–125.
4. Gomes S, Dias LG, Moreira LL, Rodrigues P, Estevinho L. Physicochemical, microbiological and antimicrobial proper-ties of commercial honeys from Portugal. Food Chem. Toxi-col. 2010; 48:544–548.
5. Amor DM. Composition, properties and uses of honey- a literature survey. The british food manufacturing industries research association, Leatherhead”, UK., Scientific and Technical surveys No. 108, 1978; 84.
6. Molan PC. The antibacterial activity of honey 2. variation in the potency of the antibacterial activity. Bee World. 1992; 59–76.
7. Singh N, Bath PK. Quality evaluation of different types of Indian honey. Food Chemistry. 1997; 58(2): 129–133. 8. Ünal C, Küplülü Ö. Chemical quality of strained honey
consumed in Ankara. Ankara Üniv. Vet. Fak. Derg. 2006; 53: 1–4.
9. Özcan M, Arslan D, Ceylan DA. Effect of inverted sac-charose on some properties of honey. Food Chem. 2006; 99: 24-29.
10. Terrab A, Diez M, Heredia FJ. Characterization of Morac-con unifloral honeys by their physicochemical characteris-tics. Food Chemistry. 2002; 79: 373-379.
11. Haroun MI. Türkiye‘de üretilen bazı çiçek ve salgı ballarının fenolik asit ve flavonoid profilinin belirlenmesi. Doktora Tezi. Ankara Üniversitesi, Fen Bilimleri Enstitüsü. 2006; 110.
12. Sunay AE. Balda orijin tespiti. Yüksek Lisans Tezi. İstanbul Teknik Üniversitesi. 2006; 145.
13. Bogdanov S. Harmonised methods of the international honey commission. 2002; 1–62.
14. Hermosin I, Chicon RM, Cabezudo MD. Free amino acid composition and botanical origin of honey. Food Chemistry. 2003; 83: 263-268.
15. Meda A, Lamien CE, Romito M, Millogo J, Nacoulma OG. Determination of the total phenolic, flavonoid and proline contents in Burkina Fason honey, as well as their radical scavenging activity. Food Chemistry. 2005; 91: 571 -577.
16. Kahraman T, Buyukunal SK, Vural A, Sandıkcı Altunatmaz S. Physico-chemical properties in honey from different re-gions of Turkey. Food Chem. 2010; 123: 41–44.
17. Ağırbaş Ç. Trakya yöresi ballarının bileşimlerinin araştırılması, Yüksek Lisans Tezi, Fen Bilimleri Enstitüsü, İstanbul Üniversitesi. 2001.
18. Tosi E, Ciappini M, Re E, Lucero H. Honey thermal treat-ment effects on hydroxmethylfurfural content. Food Chem-istry. 2002; 77: 71- 74.
19. Şahinler N, Şahinler S, Gül A. Hatay yöresi ballarının bileşimi ve biyokimyasal analizi. MKÜ Ziraat Fakültesi Dergisi. 2001; 6(2): 93-108.
20. Serrano S, Espejo R, Villarjo M, Jodral ML. Diastasis and invertase activities in andalusian honeys. International Jour-nal of Food Science and Technology. 2006; 42: 76-79. 21. Mesallam AS, El Shaarawy MI. Quality attributes of honey
in Saudi Arabia. Food Chemistry. 1987; 25: 1–11.
22. Akyüz N, Bakırcı İ, Ayar A, Tunçtürk Y. Van piyasasında satışa sunulan balların bazı fiziksel ve kimyasal özellikleri ve bunların ilgili standarda uygunluğu üzerinde bir araştırma. Gıda. 1995; 20(5): 321- 326.
23. Çetin K, Alkın E, Uçurum MHÖ. Piyasada satılan çiçek ballarının kalite kriterlerinin belirlenmesi. Journal of Food and Feed Science – Technology. 2011; 11: 49-56.
24. Kurt A, Yamankaradeniz R. Erzurum ili merkezinde tüketilen süzme ballar üzerinde bir araştırma. Gıda. 1982; 7(3): 115-120.
25. Sunay EA, Altıparmak Ö, Doğaroğlu M, Gökçen J. Türkiye’de ve dünyada bal üretimi, ticareti ve karşılaşılan sorunlar. II. Marmara Arıcılık Kongresi, Yalova. 2003. 26. Yılmaz H. Composition of honeys collected from eastern
and sourth eastern Anatolia and effect of storage on HMF content and diastasis activitiy. J. Agric For. 2000; 25: 347- 349.
27. Polat G. Farklı lokasyon ve orijinlere sahip balların reolo-jik, fizikokimyasal karakteristikleri ve mineral içeriklerinin belirlenmesi. Yüksek Lisans Tezi, Gıda Mühendisligi Ana-bilim Dalı. Konya. 2007.
28. Devillers J, Morlot M, Pham Delegue MH, Dore JC. Clas-sification of monofloral honeys based on their quality con-trol data. Food Chemistry. 2004; 86: 305-312.
29. Küçük M, Kolaylı S, Karaoğlu Ş, Ulusoy E, Baltacı C, Can-dan F. Biological activities and chemical composition of three honeys of different types from Anatolia. Food Chem. 2007; 100: 526–534.
Characteri-zation of unifloral honeys. Apidologie. 2004; 26: 453–485. 31. Heredia FJ, Terrab A, Diez MJ. Palynological,
physio-chemical and colour characterization of moroccan honeys: I. river red gum (Eucalyptus Camaldulensis Dehnh) hon-ey. International Journal of Food Science and Technology. 2003; 38: 379-386.
32. Bilgen Çınar S. Türk çam balının analitik özellikleri. An-kara Üniversitesi, Fen Bilimleri Enstitüsü. 2010; 81. 33. Terrab A, Recamales AF, Hernanz D, Heredia FJ.
Charac-terization of Spanish thyme honeys by their physicochemi-cal charateristics and mineral contents. Food Chemistry. 2004; 88: 537-542.
34. Downey G, Hussey K, Kelly JD, Walshe TF, Martin PG. Preliminary contribution to the characterisation of artisanal honey produced on the island of Ireland by palynological and physico-chemical data. Food Chemistry. 2005; 91: 347-354. 35. Soria AC, Gonzales M, De Lorenzo C, Martinez-Castro I,
Sanz J. Characterization of artisanal honeys from Madrid (Central Spain) on the basis of their melissopalynologi-cal, physicochemical and volatile composition data. Food Chemistry. 2004; 85: 121-130.
36. Popek S. A procedure to identify a honey type. Food Chem-istry. 2002; 79: 401-406.
37. Silva LR, Videra R, Monteiro PA, Valentao P, Androde PB. Honey from Luso region (Portugal): physicochemical char-acteristics and mineral contents. Microchemical Journal. 2009; 93(1): 73-77.
38. Cavia MM, Fernandez-Muino MA, Alonso- Torre SR, Huidobro JF, Sancho MT. Evolution of acidity of honeys from continental climates: Influence of induced granulation. Food Chem. 2007; 100: 1728–1733.
39. Yılmaz H, Küfrevioğlu İ. Composition of honeys collected from eastern ant south-eastern anatolia and effect of storage on hydroxymethylfurfural content and diastasis activity. Turk-ish Journal of Agriculture and Forestry. 2001; 25: 347-349.
40. Batu A, Küçük E, Çimen M. Doğu Anadolu ve Doğu Karadeniz bölgeleri çiçek ballarının fizikokimyasal ve bi-yokimyasal değerlerinin belirlenmesi teknolojik araştırmalar. G.T.E.D. 2012; 8: 52-62.
41. Velioglu S, Köse G. Ülkemizde üretilen ayçiçeği ballarının standarda (TS 3036) uygunluğu üzerinde bir araştırma. J. Nutr. and Diet. 1983; 17: 285 293.
42. Azeredo LC, Azeredo MAA, De Souza SR, Dutra VML. Protein contents and physicochemical properties in honey samples of Apis Mellifera of different floral origins. Food Chemistry. 2003; 80: 249-254.
43. Merin U, Bernstein S, Rosenthal I. A parameter for quality of honey. Food Chemistry. 1998; 63(2): 241-242.
44. İpek C. Türkiye‘deki bal numunelerinde bulunan Hidrok-simetilfurfural miktarı, stabilitesi ve hidrokHidrok-simetilfurfural miktarı tayini analitik metod validasyonu. Yüksek Lisans Tezi. Marmara Üniversitesi Sağlık Bilimleri Enstitüsü. 2012; 71.
45. Dag A. Physical, chemical and alynological characterization of avocado honey in Israel. International Journal of Food Science and Technology. 2005; 41: 387-394.
46. Özdemir F, Karkacier M, Gurel F. Identification of differ-ent honeys using sugar composition determined by HPLC. Gıda. 2000; 25 (1): 69-73.
Correspondence: Fethi Ahmet Ozdemir
Department of Molecular Biology and Genetics, Faculty of Science and Art, Bingol University, 12000, Bingol, Turkey
Tel: +90 0 426 216 00 12 Fax: +90 0 426 216 00 22