GARCH MODELLING OF ISE – 100 INDEX
NECDET KARACAN
108664005
ĠSTANBUL BĠLGĠ ÜNĠVERSĠTESĠ
SOSYAL BĠLĠMLER ENSTĠTÜSÜ
ULUSLARARASI FĠNANS YÜKSEK LĠSANS PROGRAMI
Supervised by: KENAN TATA
2011
GARCH MODELLING OF ISE- 100 INDEX
ĠSTANBUL MENKUL KIYMETLER BORSASI (IMKB) BĠLEġĠK 100
ENDEKSĠNĠN GARCH ĠLE MODELLENMESĠ
NECDET KARACAN
108664005
KENAN TATA
: ...
PROF. DR ORAL ERDOĞAN
: ...
OKAN AYBAR
: ...
Tezin Onaylandığı Tarih
: ...
Toplam Sayfa Sayısı:
Anahtar Kelimeler (Türkçe)
Anahtar Kelimeler (Ġngilizce)
1)
Risk
1)
Risk
2)
Getiri
2)
Return
3)
Oynaklık
3)
Volatility
4)
GARCH
4)
GARCH
ABSTRACT
In recent years, risk and return concepts has become more important for financial markets. Financial market volatility has a major role in the investment decision taking process. High volatility implies frequent changes in the variables relatively to a certain average in a certain period of time. The notion of increasing volatility in the equity markets became a subject of academic research.
In this study, the volatility of the return series of the ISE-100 index was econometrically analyzed under the independent macro factor variables affecting the ISE return. Additionally, ARCH/GARCH models are evaluated in order to determine the most appropriate model for predicting volatility of ISE
Using monthly historical data from January 2002 to December 2009, it is observed that there exists ARCH effect in the volatility of ISE-100 index. After the existence of the ARCH effect was accepted, it was concluded that GARCH (1.1) is the most appropriate model to forecast volatility of ISE-100.
ÖZET
Son yıllarda risk ve getiri kavramları finansal piyasalar için önem teşkil etmektedir. Finansal piyasa oynaklığı yatırım kararları almada önemli role sahiptir. Yüksek oynaklık, belirli süre içerisinde değişkenlerin değerinin belirli bir ortalamadan uzak olması anlamına gelir. Hisse senedi piyasasında artan oynaklık kavramı akademik araştırmalar da geniş yer bulmuştur.
Bu çalışmada IMKB-100 endeksinin getiri serilerinin oynaklığı IMKB-100 getirisini etkileyen bağımsız makro ekonomik faktör değişkenleri altında ekonometrik olarak analiz edilmiştir. Bununla birlikte, ARCH/GARCH Modelleri kullanılarak IMKB oynaklık modellemesinde kullanılabilinecek en uygun metot araştırılmıştır.
Ocak 2002 – Aralık 2009 yılları arasında aylık verilerin kullanıldığı çalışmada IMKB oynaklığının ARCH etkisi taşıdığı gözlemlenmiştir. ARCH etkisinin varlığı kabul edildikten sonra, değişkenliğin tahmin edilmesinde kullanılacak en uygun modelin GARCH (1.1) olduğu sonucuna ulaşılmıştır.
ACKNOWLEDGEMENT
First, I offer my sincerest gratitude to my supervisor Kenan TATA for his guidance, review and constructive criticism about my thesis. Without his guidance this study would not have been possible.
I would like to express my thanks to Alp Nasır and Sefa Takmaz who always supported me about my research; I appreciate their help very much. I am also grateful Dr. Burçak Müge TUNAER VURAL for her help and guidance.
I was indebted to ''The National Scientific and Technological Research Council of Turkey through 2210- National MS Scholarship Programme '' for the opportunity given to me in pursuing this master program.
My deepest gratitude goes to my family for their endless love and support throughout my life. I am indebted to my grandfather for his care and love. Although he is no longer with us, he is forever remembered. I am sure he shares my happiness in the heaven. A special thank to my wonderful grandmother. I have no suitable word that can fully describe her.
TABLE OF CONTENTS
Abstract. ... iii
List of Tables. ... vii
List of Figures . ... vii79
1. Introduction ... 1
2. Literature Review ... 3
2.1 Price ... 3
2.2 Volatility ... 10
2.2.1 ARCH/GARCH Model Studies in Literature ... 20
2.3 General View of Istanbul Stock Exchange ... 26
2.3.1 Historical Background ... 26
2.3.2 Foreign Portfolio Investments ... 27
2.3.3 Investor Profiles of ISE ... 32
2.3.4 Macroeconomic Factors‟ Effects on ISE – 100... 34
2.4 Researches about Volatility of ISE ... 44
3. Methodology and Data ... 47
3.1 Data ... 47
3.2 Methodology ... 47
3.2.1 ARCH Model ... 49
3.2.2 GARCH Model ... 53
3.2.3 Value at Risk ... 56
4. Findings and Results ... 59
4.1 Descriptive Statistics and Preliminary Tests ... 59
4.2 Economic Indicators and Their Effect on ISE ... 60
4.3 Volatility Structure ... 63
5. Conclusion ... 66
6. References ... 68
LIST OF TABLES
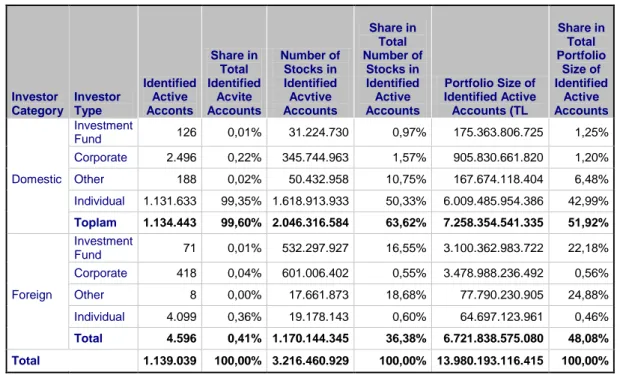
Table 1 : Net Foreign Operations. ... 32
Table 2 : Equities-Number of Investors and Portfolio Sizes Categorized by Portfolio Sizes , 2009 ... 33
Table 3: Equities- Number of Investors and Portfolio Sizes Categorized by Portfolio Sizes , 2002………...…33
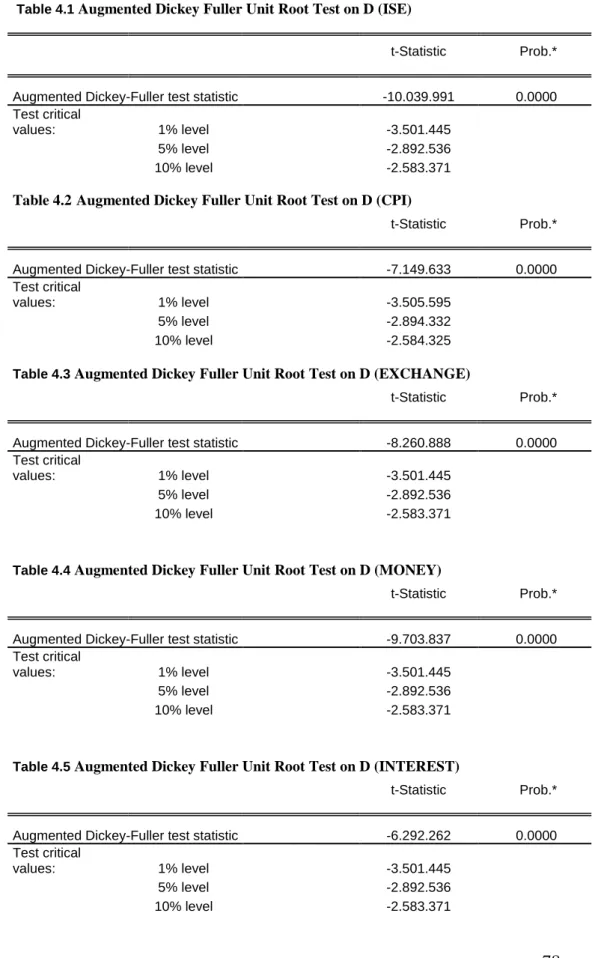
Table 4 : Unit Root Tests. ... 78
Table 5 : ISE-100 Correlogram. ... 79
Table 6 : Analayses Values of Data Whose Logarithm was Taken. ... 80
Table 7 : Heteroskedasticity Analyze ... 81
Table 8 : Lag Advanced Model. ... 82
Table 9 : Covariance Matrix. ... 83
Table 10: Covariance Matrix (continues). ... 84
Table 11 : Equation Descriptvie Statistics. ... 85
Table 12 : Correlogram of Residuals Squared. ... 86
Table 13 : ARCH-LM Test Results. ... 86
Table 14 : Alternative ARCH - GARCH Model Estimation Results. ... 87
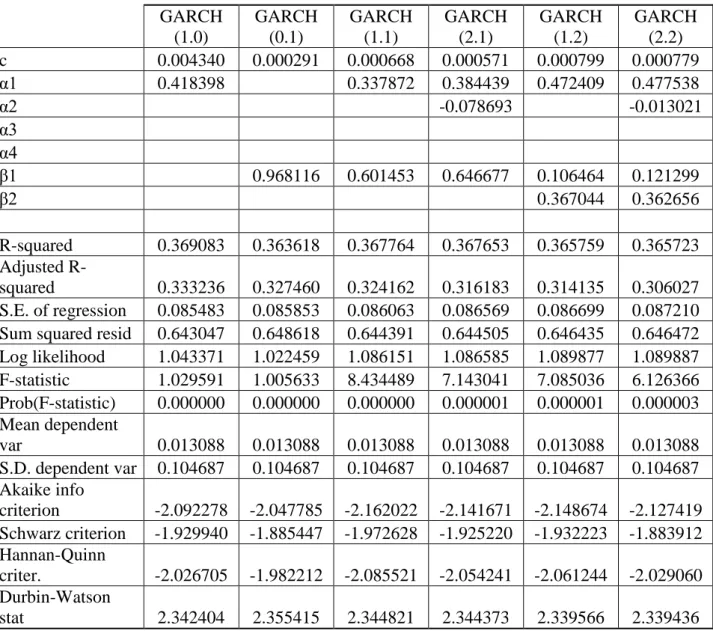
Table 15 : Akaike Info and Schwarz Criterion Results of GARCH Models. ... 88
Table 16 : GARCH (1.1) ... 89
Table 17 : ARCH-LM Test Results for GARCH (1.1.) Model. ... 89
LIST OF FIGURES
Figure 1: Foreign Holdings and ISE- 100 ... 29
Figure 2: Foreign Holdings and ISE- 100 Market Cap. ... 30
Figure 3: Net Foreign Operations. ... 32
Figure 4: Relationship between ISE – 100 and Interest Rates. ... 39
Figure 5 : Relationship between ISE-100 and Banking Deposits. ... 40
Figure 6 : ISE -100 Index Return Distribution Statistics. ... 59
1
1. Introduction
In financial markets, identification of the risk and the potential return of an asset can be seen as one of the most helpful input for market players. Market players, who have a determinant role for new investments, determine their investment decisions and the risk appetites according to comparison between risk levels and expected returns. In other words, for the same amount of expected return, an individual prefers to invest in the less risky financial instruments. However, as mentioned by Engle (2003), risk exist in future and knowing about risk, an investor may change his/her behavior to avoid.
Volatility is one of the most important concepts in finance world and modeling and forecasting the volatility of stock markets has been the subject for empirical and theoretical researches for many economists and financial researchers. The volatility of returns in stock exchange market can be seen as a major obstacle for new investments in market.
In terms of stock exchange, an increase in the volatility means a rise, not only in profit but also in loss and this change makes market more risky. Changes of variables in short period result in an excess volatility. This excess volatility causeshigh percentage increase or decrease in stock prices. In stock exchange markets, high volatility is one of the negative characteristics of market for low level risk-tolerance investors because, in high volatility conditions, the required risk that should be undertaken is also high. In such a high volatility – high risk time periods, low level risk-tolerance investors prefer to stay out of the game and that decreases number of investors in market. Therefore, we can conclude, volatility is one of the main concepts in risk management and finance theory
Volatility can be measured by using the standard deviation and variance returns from the security or market index. Traditional time series and economic models operate under the assumption of constant variance. In contrary, with the increasing importance of risk and uncertainty, modern
2 finance theory lets us use new econometric models with variable variance and co-variance.
By analyzing the empirical findings which examine the capital market volatility, the results show us that the usage of the non linear conditional variable variance model is more successful than the model which uses the linear time series model. In addition, the studies written for the capital market volatility, let us observe that the ARCH and GARCH models are the best way to explain the conditional variability.
3
2. Literature Review
2.1 Price
Price is a component of an exchange between buyer and seller. In other words, price is the quantity of payment in order to obtain something.
In finance theory, as also mentioned by Fama (1965), the past market data of the investors let to forecast the stock prices movements, especially the technical analysis is the best known analysis technique. As each discipline has its own assumption, the technical analysis has also some assumptions. Based on these assumptions, to forecast the future movement of a stock price, the past movement of a stock price is endowed with information. Dow Theory, the most popular technical analysis is formulated not only by price action but also by market behavior. The theory accept that the past repeats itself for price action and market behavior so if there is a successfully viewed price chart is created, it helps the investors to predict the future movement of a stock and this prediction allow them increase their expected gains.
In contrast to the chartist theories, random walk claims that the future path of the price level of securities are no more predictable than the path of series of accumulated random numbers. The random walk hypothesis is a financial theory stating that stock market prices evolve according to a random walk and thus the prices of the stock market cannot be predicted. It is consistent with the efficient-market hypothesis. In short, theory claims, price movement series are independent, as a result of this; the past data can not be used in any prediction of future movements.
As I mentioned before price is a component of an exchange between buyer and seller. Price changes, due to market forces i.e. buying and selling of the available goods in the market. Human beings with their both rational and emotional urges are the players of that market. The volatile nature of financial markets makes it sometimes difficult to analyze the exact reasons for various kinds of movements. At those times, in many times, emotional urges overcome rational side and increased volatility times becomes one of the most important circumstances for investors.
4 Osborne (1959) assumes the independency of prices changes from one transaction to another transaction in individual securities. They are identically independent distributed (iid.) random variables. In addition, as Fama (1965) mentioned, in this model Osborne assumes that the transaction movements of prices are fairly uniformly spread across time and their distributions have finite variance.
In point of fact, there is no, commonly accepted, general price information model for stock exchanges, in the explanation of price levels and distribution of price movements in terms of behavior.
Many articles and researches are examined in order to show factors that affect the prices. The followings are some factors that affect the buying or selling decisions of investors. These factors are chosen with the harmonization of some articles such as; Malhotra (2007) “Factors Affecting Share Prices”, Oseni and others (2009) “Determinants of Equity Prices in the Stock Market”, Sharma (2008) “Causes for Stock Price Changes”.
According to Smith (2008) price is directly affected from the trend of market trading. In other words, the price of the stock of a company is affected, most of the time, by the general market direction. In bullish market, stock prices mostly rise. If there are more people willing to buy the stock, the price of that stock will increase. In bearish market, stock prices mostly decrease. If there are more people willing to sell the stock, the price of that stock will decrease. Analyzing future price movements will help investors to predict the market.
We can add economic growth data to this segment. As Zhang (2004) mentioned, stock prices are positively related with growth of all sectors. In contrary, in an economic recession times, one can buy stocks cheaper than they were in times of market highs.
The performance of sector or industry plays very crucial role in determining the buying or selling decisions of investors. As stated by Draper (1974) the stock prices of companies, which are in same industry,
5 will move successively. The reason of this is; good or bad market conditions will generally affects companies in same way.
Company performances are also one of the vital factors that affect the stock prices. The main of aim of a company is to create profit. Earnings per share are the profit that the company made per share. For this reason, investors mostly evaluate the company based on its earnings per share revenues and its future earning potentials. The company, which achieves good earnings results, will face with increases in its stock prices because more investors may become more interested in that company. According to Zhang (2004) investor‟s behaviors against that company may change positively. Moreover that, price/ earnings ratio gives fair idea to investors if the price of company overvalued or undervalued.
As mentioned by Oseni and others (2009) the effect of FII can not be ignored in prices of stocks. These kinds of institutions mostly buy or sell with huge quantities, so these institutions‟ any buying of stock positively effects prices. In contrast to this, any sell from FII will create downward trend over stock.
One another effect of price changes may be explained by the term insider trading. From the explanation of wikipedia, the term “insider” can be explained by; “a person who has first hand information, about the operations and the financial status of a company, with his/her potential access to non-public information about the company.” This kind of traders will buy or sell the stocks before news about company is disclosured and presented. The information asymmetry makes it hard for the investors to get information about the companies before they release public announcements on large events. It can be said that corporate insiders are the ones who take advantage of the information asymmetry. Therefore, according to Chen and others, since the insiders‟ use the advantage of getting private information about the companies before a public announcement is made; they may have an opportunity to use this information for manipulation for the sake of their own benefits, which is called “insider trading”.
6 Meulbroek (1992) claimed that insider trading causes more rapid price discovery and stronger volatility. Additionally, Cornell and Sirri (1992) and Chakaravarty and McConell (1997) at their studies, supported the conclusions of Meulbroek (1992).
Share buy-back by a company concludes the reduction in the number of shares in the market. According to demand and supply equilibrium; a decrease in the number of shares in the market means decrease in supply. This normally causes an upward shift in share price. Moreover, sometimes share buy-backs used by companies to support and to increase the liquidity of stock.
Stock splits have also effects on price changes. According to study of “Tick Size, Share Price and Stock Splits” by Angel (1997), from the theory, stock splits should not have an impact on stock prices. Because it is a corporate action, that increases the number of corporations‟ outstanding shares by dividing each share, which also diminishes price. On the other hand, many researches believed that, stock prices increases after stock split. However, some believe that stock split has no real and direct impact on the stock price, as the stock price will increase regardless of stock split.
Moreover, dividend announcements can be seen one of the most important factor that affects price. It is known that shareholders of a company should have the money which is created by that company. Therefore, keeping the money for new investment opportunities or distribution of that profit should not be a matter for that company, because as it is stated in literature, there is no or little effect of the issuance of dividends on the company‟s capital structure or stock prices. When it is taken into consideration from a different perspective, it is seen that the dividend payments cause a decrease in the re-investment resources of a company.
7 From the literature, the study conducted by Miller and Modigliani in 1961 and suggests that “dividend payments have no impact on shareholder‟s value.”
The effects of dividend announcements were also investigated by Uddin (2003) in a study in which 137 declared dividends were used between October 2001 and September 2002. His study indicated that investors do not benefit from dividend announcements.
In addition, analyst coverage of a stock is an important factor, which leads to efficient pricing of the stock. The real value of a firm is sometimes overestimated or underestimated by individual investors. Investors therefore need an independent evaluation on the company‟s fundamentals and its future expectations provided by as many analysts as possible. The coverage of a stock by high number of analysts usually reduces volatility in the market. Analysts also play a key role as an intermediate agent between company management and investors. Managements usually prefer meeting with analysts to share their goals and expectations, which are then forwarded to investors by analysts.
The efficient market hypothesis supposes that prices influence all kinds of information. According to Fama (1970 and 1991), any publicly available information is immediately reflected to prices, which is in accordance with the semi-strong market efficiency. On the other hand, there have been many studies in literature as Kogan and Lochster (2005) mentioned, Huberman and Regev (2001) , Busse and Green (2001), and Meschke (2004) showing some instances in which the re-releases of already available public information can have a significant price effect on individual stocks.
It was indicated by Kogan and Lochstoer (2005) that instantaneous market-level returns have been greatly influenced by the announcements in terms of the direction of the announcement. The trading volume and price volatility were also showed to be influenced by the announcements.
8 News is regarded as one of the most important and most rapidly affecting factors for stock prices. For example good or bad news creates different impressions on investors in such a way that bad or good news can receive different reactions from the investors.
Similarly, bad stories of stocks can create negative impressions among investors. While there are negative drifts for the stocks having bad public stories, there are fewer drifts for the ones having good stories. This situation is interpreted by Chan (2001) that prices cannot be fast enough to reflect bad public news. Chan added that no news stories in the event month tend to reverse in the subsequent month. According to Chan (2001), this reversal is a statistically significant one even after controlling for size, book-to-market, and liquidity influences. This interpretation complies with the fact that spurious price movements receive overreactions from the investors. Therefore, investors can be a little bit slow to give reactions to the valid information which causes the drift. Investors also overreact to price shocks, which results in excessive trading volume and reversal.
There are also some other researchers such as Erdogan and Yezegel (2009) who investigated the return behavior after large price changes as a result of the announcement of “no news”. They indicated that although there is an explanation about the “no news” after large negative price changes, the prices are observed to continue to drift downwards. On the other hand, if the positive sub-sample is taken into consideration, there may be a partial reverse in the prices after the announcement of no news.
The volatile natures of most markets make it sometimes difficult to analyze the exact reasons for various kinds of or down movements. Systematically studying major factors, which affect prices, is very essential for all investors. The volatility of stock price changes is a measure of how much the market is liable to fluctuate.
Black and Scholes (1973) defines that;
“Volatility is of interest to all traders because it quantifies the risk and is the key input of all pricing models.”
Without an efficient volatility estimate, it is difficult for traders to identify situations, in which, prices overvalued or undervalued. That‟s why
9 physicists and economists are increasingly interested in time series analyses. According to Liu et all (1999), understanding the statistical properties of the volatility also has practical consequences.
The periods of stock market volatility in developed markets have intensified the debates about the causes of this kind of price movements. Accordingly, several studies have been conducted to investigate the relationship between stock market volatility and macroeconomic variables. The total value of company shares depends on the state of the economy. Therefore, a change in the uncertainty level about the macroeconomic conditions in the future will cause a proportional change in the stock return volatility.
Schwert (1989) shows how macroeconomic variables, precisely inflation, industrial production and money supply, will determine stock market volatility for the U.S.A. Schwert‟s finding reveals the idea that macroeconomic volatility affects the volatility in a stock market.
Schwert (1989) analyzed the effect of market volatility on various economic variables and tried to examine the effect of time varying volatility among these variables. He concluded that economic downturns have higher rates of market volatility. This result agrees with the result that was obtained by Officer (1973). He also indicated that financial leverage plays an important role in the increase of stock market volatility, as predicted by Black (1976) and Christie (1982). However, financial leverage is responsible for only a small part of the variation in stock volatility.
Morelli (2002) analyzed the relationship between conditional stock market volatility and conditional macroeconomic volatility with data about England. In contrast to Schwert‟s (1989) defended conclusions, Morelli‟s finding shows that macroeconomic volatility does not explain stock market volatility.
Davis and Kutan (2003) extended Schwert‟s (1989) study. It was showed in this study that both movements in inflation and real production and measured macroeconomic volatility have a weak power to explain stock market volatility.
10 By using monthly data of 1986-2003 periods, Kasman (2006) analyzes the relationship between conditional stock market volatility and macroeconomic volatility for Turkey. The findings indicate that 6 % of the stock market volatility is defined by the change in macroeconomic volatility.
2.2 Volatility
From the glossary statistical terms of OECD, volatility, in financial markets, refers to the amount of uncertainty or risk about the prices changes of determined variable. So we can conclude, the higher the volatility, the riskier the good.
According to Poon S. (2005)
“a statistical definition of volatility can be given by, as a measure of distribution or dispersion of observations in a data set around the arithmetic average. Statistically, volatility is often measured as the sample standard deviation.”
Volatility shows the sensitive part of the total variability against the changes in the market. In other words, volatility is defined as an increase or decrease of any variable according to a certain average value.
In order to explain volatility in financial terms, it is better to refer to the definition given by the ISE. ISE explains volatility as “the feature of fluctuation that the price of a security or the market in general has in a short time interval”. It is possible for investors to reduce the risks to be taken if the size and time of these fluctuations are determined beforehand. Since investors face risks in financial markets, they can reduce these risks if they can predict the volatility.
In capital markets, volatility is the statistical measure of the dispersion of returns for a given security or a given market index. Volatility can be measured by using the standard deviation or variance returns from the security or market index. In calculation, standard deviation or variance are squared, so that negative or positive differences are all combined into one quantity. This means volatility does not measure the direction of price changes. On the other hand, this does not mean the price changes of two
11 compared variables will always go with the same direction. Sometimes, variable will increase more than a compared market index or price difference occurs by negative value of security against market index. As suggested by Mala and Reddy (2007), Krainer (2002), concluded in his study that the developments in an economy can be predicted with the help of the degree of volatility. If the level of risk is higher in volatility, there will be a rise in the cost of capital. As a result, risk- averse investors will decide to decrease investments. The study of Mala and Reddy (2007) showed a similar result in terms of reduced investments and slow economic development according to degree of volatility.
Volatility is used to mean that variability shows higher increases or decreases than its average. It is believed that making a definition of “good” or “bad” for the concept of high volatility in financial markets is not true. Since higher volatility has a possibility of getting higher profits or losses in compare with the low volatility time periods, the liquidity of market will change according to the structure of market players. I mean, if there are more risk-averse investors in the market, the market liquidity may decrease, on the other hand, by the sensation of getting more profits, market liquidity may increase with new investors‟ attendance in the market. In short, volatility has different effects on different markets.
All investors want to have an idea about the stock market risk and return behavior. Because stocks have different levels of volatility, it is not surprising to see that while some stocks are volatile, the others are not volatile that much. Furthermore, some stocks may be more volatile than market volatility. However, the degree of volatility changes from one stock portfolio to another according to the type of the stock it holds. The manner of a portfolio manager against volatility affects stock portfolios. While some stock traders are not afraid of trading in volatility time periods to earn much, the others do not want to take risks and may sell with panic in volatility periods. Since an investor aims to get the highest return against the undertaken risk, it is important for him/her to forecast the volatility in order to determine when to sell or buy by taking the risk into consideration.
12 The asset return volatility was used by Markowitz (1952) as a measure of risk in modern finance theories and it is also mentioned in the study of Liu, Lee and Lee (2009). Mandelbrot (1963) is the first person who claimed volatility clustering in finance. Mandelbrot show that volatility changes over time and that, for short lags, time series of daily stock index returns exhibit positive correlations. According to observations of Mandelbrot; high amount of changes in the prices of goods tend to be followed by high changes, of either sign, and low amount of changes tend to be followed by low changes. This conclusion feature volatility of financial variables has dynamic structures rather than static. Fama (1965) supported the findings of Mandelbrot in his research.
The importance of stock market volatility is apparent. Therefore, it is necessary to find suitable stocks for an investor‟s investment or trading style and risk tolerance levels. Since stock prices generally fluctuate, it is not surprising to see higher or lower levels in prices. If the stocks have relatively more volatility, most probably they will have a higher and lower range than less volatile stocks. The moving range of a stock indicates how much volatile it is. In other words, the more a stock moves, the more volatile it is. For this reason, it is especially important for investors to forecast the volatility level of a stock or market in order to determine their investment decisions. Black (1976) argues that corporate leverage affects the long-term volatility of returns of common stocks. According to Black, declines in stock prices increase the debt-equity ratio (financial leverage) of firm subsequently risk (volatility) increases for the firm. The corporate leverage argument is unable to explain variations in volatility for broad market indices.
As a result of rapid changes in financial markets and observed volatility in stock exchange markets, there have been a lot of economists and financial researchers who have been performing many empirical and theoretical studies to model and forecast the volatility of stock markets. It can be said that volatility in financial markets has increased since 1980s. In the last 30 years, many new investment instruments have been introduced to
13 financial markets in an attempt to decrease the impact of turbulences in global financial markets. Consequently, it has become a necessity to predict the volatility concept and the increased assets in financial markets.
According to many financial market analysts and investors, the volatility of stock returns, interest rates and exchange rates increased very high. If there is a high volatility rate in the financial market, this will have very important effects for policy-makers. According to Becketti and Sellon (1990), the investment decisions may be changed if investors think that high volatility is equal to high risk. On the other hand, the politicians may think that financial market volatility may penetrate into the economy and thus the economic performance may be damaged. Financial volatility can also be considered as a threat to the regularity of the financial market functions and the applicability of financial institutions. However, the difference in the structure of the financial markets can change the nature of volatility, its size and its permanence.
Daly (1999), claimed volatility of stock exchanges can be seen as a sign of price of stock exchanges is not valued as they deserve. And it is also seen as a sign that indicates, capital markets are not functioning as it is needed. Shortly, volatility means that securities are not priced fairly and capital market is not working functional as well as it should.
In terms of stock exchange, increase in the volatility means an increase in both profit and loss, which makes market more risky. In other words, with a high volatility stock price changes may increase or decrease by high percentages. In stock exchange markets, high volatility is one of the bad features of market for risk-averse investors, because, in high volatility conditions, the required risk that should be undertaken is also high. In such a high volatility – high risky time periods, risk-averse investors prefer to stay out of the game and that decreases number of investors in market.
As Kurihara (2006) mentioned in his study for Japan, many factors such as enterprise performance, dividends, stock prices of other countries, gross domestic product, exchange rates, interest rates, current account deficits, money supply, employment etc… have impact on daily stock
14 prices. The findings of Aydemir and Demirhan (2009) for Turkish economy supported the ideas of Kurihara (2006). According to their conclusion, investors‟ perception (market reaction) to these indicators with good or bad news, will guide the way of prices.
In financial markets, determination of the risk of an asset and determination of potential return are the biggest helpful inputs for market player. Volatility of returns in market can be major stumbling block for attracting investment because market players determine their investment decisions according to relation between risk and return. By being aware of risks, people may alter their behavior to avoid them. As Engle (2003) mentioned, there are always risks people choose because benefits from taking them exceed the possible costs. This is also determined as central paradigm of finance by Engle. According to his belief in his article, people must take risks to achieve rewards but not all risks are equally rewarded. The difference in risk levels of financial assets exists as a result of differences in their returns. So anyone can conclude that, volatility and determination of volatility is the most crucial thing for traders. Traders are mostly interested in which direction the market is going. In other words, traders are interested in velocity of that direction not interested in the way of direction.
In last 30 years period, the effects o globalization is increasing in global markets. This globalization fact causes an enlargement for uncertainty‟s zone of influence. With the increasing effect of turbulences in global financial markets in last 30 years, there are many hedging assets exists for protecting risky conditions. Forecasting of volatility concept, gain importance with increased assets in financial markets. Because, in recent years, by developments, there are lots of different assets and derivatives of these assets, which are in market, which are hedge assets of that market and which are hedge of that hedges etc…
According to Figlewski (2004); although the basic Black and Scholes (BS) option pricing formula is composed of five parameters and the returns of volatility of the underlying asset is only one of the components
15 among them, the volatility seems to play an important role because it is the only one that is not observed directly. It is possible to know or obtain information about the other parameters such as stock price, strike price, time to option expiration and the interest rate from the market easily except for volatility. The only way to get information about volatility is to make predictions about it.
The term volatility can be determined by standard deviation or variance. The relationship between standard deviation and variance shows that volatility and variance bear a resemblance to each other. This feature of volatility makes non linear time series analyses more accurate.
Existence of volatility, its mean reverting behavior, the asymmetric impact of negative versus positive return innovations and possibility to those exogenous or pre-determined variables may have significant influences on volatility. Volatility has a great effect on evolution of real prices and forecasting it, gives crucial benefits to investors. Advances in time series modeling such as ARCH / GARCH models and stochastic volatility models have made it possible to do this. If volatility cannot define successfully or cannot forecast, it will cause very dangerous dimensions for investors. Markets can cope up with normal level volatility. On the other hand, if exaggerated volatility exists in the market, market will face with problems.
Volatility can be defined as a concept that can generally be seen in stocks, exchange rates and inflation in developing countries. The performance of the financial instruments depends mainly on volatility of the share market.
Volatility, which exists in a financial market at a normal level, is believed to be a natural part of the process in allocating the investable funds and providing rivalry. Since the regular functions of financial system might be damaged and the economic performance might be affected negatively due to this volatility, the extreme volatility in share prices could damage the interest rates and exchange rates.
16 After investors realize the increase of this volatility in share market as the increase in share investments, they are likely to invest their funds in more risky areas. As a result of this reaction, an increase is observed in the cost of exportation deeds. Since small and new companies are affected more by this effect, investors may prefer to buy the shares of much bigger and more experienced companies. Because investors get their funds that they bought from administration by means of the financial markets and associations, these markets and associations play an important role in economy.
The movements in total share market volatility have been the subject of several studies in the literature. For example, Officer (1973) investigated the Great Depression period between 1929-1939 and concluded that share income variability had an extremely high rate. Despite the fact that there is a meaningful correlation between collective leverage power and volatility, it explains only a small part of this movement of volatility. Therefore, it is really difficult to interpret the degree of increase or decrease in total share volatility especially for the Great Depression period by using simple share models. Officer (1973) indicates the variability of volatility in macro economic variables. Black (1976) and Christie (1982) indicated that financial leverage is increased by share volatility. Shiller (1990) indicated that share market volatility is relatively higher than dividend‟s variables. According to Shiller‟s value models, the increase in volatility is caused by the proportion of rediscount or each of cash currents. Standard turning can be used to define the concept of volatility.
Because of the abolition of the regime in stable exchange rate in 1971, investors experienced a setting of a definite exchange rate that they had not had before. Then as a result of the petrolium crisis in 1973, huge fluctations in markets increased the inflation and influenced the tendency for rise and fall in interest rates.
17 The Financial crisis that happened on 19th October 1987 was the date when a rapid fall was observed at an end point in share prices in the U.S.A. and called Blak Monday.1
This huge rate of volatility in the share market negatively affected the primary economic transition channels, and as a result the financial markets experienced a severe crisis*. Because of globalism, many countries‟ stock exchange markets were affected by this crisis in the U.S.A. Particularly the decrease in share prices on19th October was observed to decrease the consumer expenses. It is thought that this factor is likely to lower the consumers‟confidence and the consumer expenses in the future again. Both the consumer expenses and the company investment expenses are influenced by this volatility.
Changes in capital investments, consumption and other work period variables are the areas that the level of volatility market influences. It is important to know why the share volatility changes. Therefore, it is necessary that both positive and negative aspects of volatility be investigated well since it can be regarded as positive or negative according to different standpoints. Because the share prices have a very high mobility, there could be high amounts of increase or decrease in share prices. In other words, a high volatility may cause an investor to have either a high profit or a high loss depending on the situation of the prices: in high volatility environments, the higher the increase of prices is, the more the investor will profit and the lower the increase of the prices is, the more the investor will lose. In such a case, if the investor controls a high volume operation, s/he can harm the market especially when manipulation is seen as a way to avoid the risks of volatility. This is the negative side of volatility. However,
1 Black Monday is the day in which Stock Exchange prices were the most decreased day. * In October 1987, Black Monday, decrease of stock exchange markets started in Hong Kong. With an effect of time differences, this downward trend of stock prices continued by European Stock Exchange Market. At the end of the day Dow Jones, American Stock Exchange, decreased by % 22.6 (508 point) which was an unnoticed decrease ever happen.
18 volatility also has a positive side. One of the long term investment instruments, capital market instrument is likely to provide high profit in a short term. Since the volatility gives investors a chance to gain much in a very short time without waiting much, they want to take part in the stock exchange, so this causes the demand to increase.
There are various ways in modeling volatility. There have been many economists and financial researchers who have investigated the concept of modeling and forecasting the volatility of stock market in several empirical and theoretical studies in literature. Therefore, volatility is observed to be one of the most important concepts in finance world. However, the volatility of returns in market may create some problems for new investments.
As it is mentioned by Mazıbaş (2005) there is a volatility parameter in many values at risk models, used in measuring a market risk. It is seen that the volatility of stock market prices is also used in Black-Scholes‟s formula in order to obtain the prices of traded options.
There are six different models used in modeling volatility, from the book of Introductory Econometrics for Finance by Brooks;
The first one is the historical volatility models. The historical estimate is the simplest model for volatility. It is based on the idea that the values in the past will also continue in the future. As mentioned by Figlewski and Green (1999), it is obtained by calculating the returns of financial asset belonging to the previous period, calculating these returns according to the continuous compounding return and then taking the standard deviations of the continuous compounding returns. The square root of the variance gives the standard deviation, i.e. volatility.
Figlewski and Green (1999) defines that;
“the historical average variance (or standard deviation) is the traditional volatility input used for options pricing models. However, there has been an ever- increasing indication that proposes the idea that using the volatility obtained from more sophisticated time series models is likely to result in much more accurate option valuations.”
19 Second one is implied volatility models. According to Brooks (2008), it is known that a volatility estimate or forecast is needed as an input for all pricing models used for financial options. Black-Scholes‟s basic assumption is that the volatility of the asset that the option depends on affects the market price of the option.
Black-Scholes model and other option models are based on standard deviations. Implied Volatility is obtained by placing the standard deviation in the Black-Scholes model.
Third one is exponentially weighted moving average (EWMA) models. Brooks (2008) defines the exponentially weighted moving average (EWMA) is a version of the historical average volatility measure. Since it uses more recent observations, it provides a chance of stronger forecast of volatility than the other data points.
The EWMA is one of the infinite impulse response filters which use exponentially decreasing weighting factors. In the EWMA, the decrease in the weighting for each older data point occurs exponentially, but it does not reach zero. According to Harper (2007), when compared with the Moving Average, the EWMA is more advantageous because of its memory. By using a factor, the EWMA can remember a fraction of its past. For this reason, if the term is chosen wisely, the EWMA can provide a good indicator of the history of the price movement. Therefore, the highest weights can be obtained in the volatility estimate by the latest observations used in the model.
According to Brooks (2002) autoregressive volatility models can be seen as a fourth type of volatility models. Autoregressive volatility models can be defined as a simple example of the class of stochastic volatility specifications. In these models, it is possible to obtain time series of observations on some volatility proxy.
Fifth one is autoregressive conditional heteroskedasticity variance (GARCH) type of volatility models. Generalized Autoregressive Conditional Heteroskedasticity (GARCH) is an improved model of ARCH
20 by Bollerslev in 1986. Conditional variance is a function of past squared unexpected returns and its own past values. The model is a weighted average of all past squared forecast errors in which weight of old data is decreases. GARCH is also an ARMA (p,q) process in the variance.
According to Brooks (2002) Last type of volatility model is stochastic volatility models. Brooks (2008) states that, the stochastic volatility models are characterized by randomly changing volatility with regard to some stochastic differential equations. In stochastic volatility model, the variance is modeled as a variance that cannot be observed. For that reason, it is also known as latent volatility. In short, the stochastic volatility model assumes that unknown volatility changes stochastically in time.
2.2.1 ARCH/GARCH Model Studies in Literature
In classical standard deviation calculations, the linear time series method is used and it is assumed that variance remain constant over time. In traditional economic models, changes of variance is not depends on time. In other words, it is assumed that, variance is independent from time. On the other hand, changes in variances of time series are mostly denotes dependent to time series, it is also called as, heteroskedasticity. However, today the acceptance of the fact that variance remains constant is not valid anymore. For time periods forecasting errors may be high or low. These changes in the forecast errors are called volatility in financial markets. Time series statistics used for determining the best volatility forecasts in volatility modeling researches. The traditional econometric time series models, generally assume a normal distribution of stock returns.
Mandelbrot (1963) concluded that big changes tend to be followed by big changes and small changes tend to be followed by small changes. In traditional econometric approaches, it is mentioned that the changing variance may appear mostly in models in which horizontal section data are used, whereas time series data are used in models containing the constant variance. The use of conditional variance models allows for a rapid and reliable volatility prediction.
21 Poon (2005) states that,
“new characteristic of volatility, time varying nature of returns fluctuations, existed by Engle (1982). Engle succeeded to get Nobel Prize for his achievement in modeling it. The Autoregressive Conditional Heteroscedasticity (ARCH) model is used by Engle (1982) for the first time to explain this type of volatility persistence: since high/low volatility tends to persist, it is called “autoregressive”, since it varies with time or with respect to a point in time, it is called “conditional”. It is heteroskedasticity because non-constant volatility is expressed by a technical jargon “heteroskedasticity”.”
Engle (1982) introduced the Autoregressive Conditional
Heteroskedasticity (ARCH) in order to find a more convenient way to determine the dynamic characteristics of financial assets and forecast of the changes of variance in time periods. The Autoregressive Conditional Heteroskedasticity (ARCH model), which was put forward by Engle in 1982, is based on hypothesizing normal errors for asset returns and capturing a lot of stylized facts of financial assets such as time-varying volatility and volatility clustering.
According to the researches of Engle (1982) and Cragg (1982), in the macroeconomic data‟s time series analyses models, by some kind of economic researches, they proved variable variance is not stable as its assumed in previous traditional economic researches. Because of this reason, in forecast of financial market volatility, it is better to use ARCH model rather than traditional approaches. Engle (1982), allow the first and second moments of the stock index return to depend on its past realizations. The return and variance of return are modeled as linear functions, which facilities the statistical estimation for parameters. After years Bollerslev improved the ARCH model. Bollerslev (1986) transferred the ARCH model to the, Generalized Autoregressive Conditional Heteroskedasticity (GARCH) by including autoregressive moving average model. Bollerslev (1986) allowed the variance to depend not only on lagged squared deviations from mean return, but also on lagged variances.
22 French et al. (1987) examine daily and monthly returns on the NYSE stock index or the period between January 1928 and December1984 and found evidence that statistically significant positive relation between expected returns and volatility. Chou (1988) supported French et al. (1987) finding about positive relation between the predictable components of stock returns volatility, by using same data for a different period.
Booth and Hatem (1992) claimed that the accordance with data exhibiting a similar dependency structure increases the success of the GARCH models both in theoretical and empirical applications like this trend in returns.
As Grunbichler and Schwartz (1993) mentioned, Akgiray (1989) indicated that stock returns in the U.S.A on daily basis between 1963 and 1986 did not include serially independent realizations. His conclusions are similar to those of Fama (1965) in terms of price change. According to their views, high price changes are followed by high changes and low price changes are followed by low changes. Akgiray (1989) also stated that there are severe deficiencies of models that are based on linear dependent daily stock index returns. One of the differences between linear dependent models and non-linear models can be seen in the criticism the linear dependent models received. The linear dependent models have been criticized to neglect information about the dependence on the squared values of returns, which is valuable for prediction proposes.
Lamoureux and Lastrapes (1993) found that an Arch model provides superior volatility forecasts than does implied volatility in a sample of 10 stock series. Akgiray (1989), for forecasting monthly US stock index volatility, stated GARCH model superior to ARCH.
Grunbichler and Schwartz (1993) studied the volatility of the German and Swiss equity markets for a recent time period and look at its time series properties. It is significant that they observe a higher correlation between the volatilities in these two markets than between the returns.
Corhay and Rad (1994) investigated whether autoregressive conditional heteroskedastic models could adequately describe stock price
23 behavior in European capital markets. In previous researches, there are lots of work has been applied to American markets. That‟s why Corhay and Rad preferred to analyze European markets, in order to analyze autoregressive conditional heteroskedastic model suitable or not in which markets “generally much smaller and thinner” than American markets. The market looked at France, Germany, Italy, the Netherlands and the U.K, estimating ARCH and GARCH models of various orders they found that the Garch (1.1) model generally outperformed other Arch and Garch models.
According to Cromwell at all (1994), the GARCH model can be preferred to the ARCH model in some cases. If the values of variance belonging to the past period are efficient in determining the current value, in other words the changes happening in the variant are internal, the use of the GARCH is more appropriate. Additionally, in cases where the delay structure of the ARCH model is very long, the delay structure can be shortened by using the GARCH model. In other words, the GARCH model allows for the existence of a more economic delay structure.
As long as the prediction horizon increases, most time-series models like the GARCH will predict an unconditional variance of the series. This is regarded to be one of the best features of a volatility prediction model because volatility series are „mean-reverting‟. This state suggests that if they have a higher level now than the average in the past, they are likely to have a tendency to fall back towards their average level, whereas if they have a lower level now than the average in the past, they are likely to have a tendency to rise back towards their average level. Therefore, this is the property that makes the GARCH volatility forecasting models different from the EWMAs.
According to Saganuma (2000), volatility estimates are strongly connected with asset allocation decisions and value at risk calculations. Rolling window, EWMA, GARCH and stochastic volatility are some of the volatility measures used in practice. Because of their capability of incorporating the dynamic structure of volatility and forecasting future
24 behavior of risk, the GARCH and EWMA models are believed to have better results than constant, rolling window volatility models.
Mc Millan, Speight and Gwilym (2000) analyze the predictive power of several GARCH models in evidence of U.K. By using symmetric and asymmetric error statistics they conclude, the GARCH model outperforms smoothing and moving average techniques which have been previously identified as providing superior volatility.
In an attempt to determine certain qualitative features of volatility, Engle and Patton (2001) examined what a good volatility should have. They concluded that some factors such as mean reverting behavior of volatility, asymmetric impacts against positive or negative periods and possibility of exogenous and unpredictable circumstances could have significant effects on volatility in the ongoing volatility. Working on the daily data of Dow Jones for twelve years, Engle and Patton obtained some findings that comply with the theoretical results, in which the obtained empirical data depend on the sampling frequency.
The use of the GARCH models in measuring volatility is beneficial for its assuming a conditional heteroscedasticity and homoscedasticity unconditional error. In other words, there is an assumption in the model that the realizations of the preceding errors function as changes in variance, and thus these changes facilitate both temporary and random departures from constant unconditional variance. This situation is also true for daily data. The fact that the GARCH model holds the property in data for volatility clustering is its major benefit.
Volatility and market efficiency is one of the popular research topics for finance literature. Fama (1965) analyzed stock market prices and random walk behavior of stock prices and he used the term “efficient market” for the first time. According to the random walk theory, no trends have an effect on the existence of the movements in prices, and past prices are not effective in predicting the future prices.
25 In Efficient Market Hypothesis, all kinds of information are influenced by prices. In other words, if a market is efficient, the price of any kind of information should increase rapidly and correctively.
Nowadays, real markets and capital markets have become to be affected more from each other. Therefore, effective functioning of capital markets has been one of the most widely debated issues. The effectiveness of capital markets means that securities that are subject to the capital market should reflect their real values.
Volatility in financial markets, Price Bubble, Noise Traders in financial markets, Insider Trading, and Free Rider problem can be cited as the factors that emerge in ineffective financial markets and that remove the market from the effective balances.
There are 3 forms of Efficient Market Hypothesis,
First one is weak form. This form claims, historical market prices and historical data are observed to be reflected in prices. However, Efficient Market Hypothesis also claims that price changes of any period are fully independent from previous changes.
Another form is semi- strong form. This form claims, both past data of price movements and all publicly available information of market contribute to price formation. According to this view, it is possible for an investor to obtain higher returns from benchmark because all investors shared all of their new information, and as a result the effects of this information are simultaneously reflected in the market.
The third and the last form, strong form. This form claims, any kind of information, even the insider trader information is reflected in prices.
Rational expectations theory is criticized by many economists, and it is claimed that not all of the investors in the market move with rational motivations.
Wallace (2010) denotes that,
“Shiller is strongly disagree with Efficient Market Hypothesis and said, The Efficient market Hypothesis is one of the most egregious errors in the history of economic though.”
26 Robert Shiller, is one of the defender about behaviors‟ of investors‟ affects markets in high rate. He said “We are talking about playing game against other people. How do you ever play a game without thinking about their psychology?”
Shiller (2008) emphasizes that an investor who takes part in capital markets is not “a smart investor who knows what she/he wants” and claims that most of the investors taking part in the market just follow trends and tendencies. Such transactions increase the volatility in stock markets. In short, social and psychological factors (Behavioral Finance) are emphasized to be important in behaviors of the investors taking part in the market.
Herd psychology has revealed that investors who do not behave rationally have developed behaviors that are entirely based on their instincts. In this type of behavior, the notion of adapting to the general behavior and moving away from the rational behavior are dominant. Therefore, it is clear that a financial system, which is based on herd psychology and in which the investment decisions are taken according to herd psychology, is not an effective market.
2.3 General View of Istanbul Stock Exchange
2.3.1 Historical Background
The Istanbul Stock Exchange was established on December 26, 1985 for the purpose of ensuring that securities are traded in a secure and stable environment, including buying and selling of stocks treasury bills, government bonds, revenue sharing certificates, private sector bonds, foreign securities, real estate certificates. ISE commenced to operate on January 3, 1986 and ISE has contributed to the development of Turkish capital markets and Turkish economy since its establishment. In the establishment year, ISE had 40 companies and this reached to 323 companies in 2009. Market cap of ISE was 938 million dollar in 1986 and increased to 288 billion dollar. With 2008 crisis, market cap decreased to 119 billion dollar and then, after a year later, reached to 238 billion dollar.
27 Moreover that, in the establishment year of ISE, trading volume was just 50 thousand dollar and, in 2009, increased to 316 billion dollar levels.
In 2009, ISE‟s stock market was 10th
in terms of market cap and was 7th among emerging markets in terms of volume. ISE was the 3rd stock market that provided the highest return in same year.
According to data of ISE, between 1986 and 2009, 45 billion dollar fund was released through the stock market. And 21.8 billion dollar of this fund was released between 2004 and 2009.
With the effect of globalization, both the volume and the velocity of capital flows have increased. Moreover, with the increase of depth in Turkish capital markets and political stability, interests of foreign investments rose.
2.3.2 Foreign Portfolio Investments
With the effect of globalization, both the volume and the velocity of capital flows have increased. Capital starts to move from abundant regions to scarce regions, because, returns from scarce regions are much more than abundant regions. This is a kind of win-win game. By this transaction of capital, capital will get the benefit of high return, and countries with scarce capital will get the benefits of extra capital. There are two kinds of capital investment, foreign direct investment and portfolio investment.
According to ISE Review (1998:8)
“Portfolio investment is the purchase of stocks - bonds and money market instruments by foreigners, by taking the risks of political risk- country risk- foreign exchange risk etc., for the purpose of realizing a financial return, which does not result in foreign management, ownership or legal control.”
Portfolio theory has a crucial role in the explanation of international portfolio instruments. According to this theory, investors distribute their money funds to obtain the highest return. By this diversification, investors become willing to buy not only local securities, but also foreign securities.
28 Since 1980s to today, when we analyze the portfolios of investors, it is clear to see that, total share of foreign securities in portfolio is increased.
According to researches of French and Poterba (1991), between 1980s and 1990s for American Investors, share of local stocks for American investors decrease from 94% to 83 %, from year 1980s to 1990s. French and Poterba (1991) also concluded that, this downward trend is also same in Japan. For Japanese investors, in same year period, share of local stocks against total value of stocks, decreased to 83% from 91%.
Increase in liquidity and with sharing risks, existed prices of stocks in emerging countries can be concluding as a nature of portfolio diversification. The effects of internationally diversified portfolio investments over prices are also studied by many other researchers.
By foreign portfolio investments, emerging markets affected more than developed countries, because of their low volume. As it is mentioned by Bodnaruk and Östberg (2008); Merton (1987) and Errunza-Losq (1985) concluded that, foreign purchases have positive effects in Mexican stocks. Moreover, Allan and Gale (1991) also concluded foreign portfolio investments have positive effects over local stock prices and this is seen as a reason of diminishing liquidity risk.
As it is mentioned by Stulz and others (1998), there are many studies in literature that determined positive effects of foreign purchases over local stock prices, such as; Bohn and Tesar (1996), Clark and Berko (1996) and Henry (1997). According to Clark and Berko (1996) any 1% increase in foreign portfolio investments causes 13 % increase in Mexican stock prices. This is also seen as a consequence of sharing risks and increasing liquidity.
A research about South Korean capital market also supported the positive effects of foreign portfolio investments over local stock prices. Conclusion of the research was; 1 billion $ foreign purchase causes 24% increase in prices of Korean local stocks. In the article of “Cross – Border Equity Flows: Hot or Cold?‟‟ by Cozzini and Howell (1994), 1 billion $ foreign portfolio investment increased the stock exchange prices by 1.4%.
29 There are many hypotheses about explaining foreign portfolio investments‟ positive or negative effects on stock exchange returns. Base Broadening hypothesis, Expected / Unexpected Flow hypothesis, Feedback hypothesis, Prices pressure hypothesis are many of them. When we generalize all those researches, we can conclude that increase in foreign portfolio investments causes an increase in liquidity. And this also creates downward shift in risks and cost of capital. At least the price goes up. Foreign Portfolio Inv. Liquidity ↑ Risk ↓ Cost of Capital ↓ Prices ↑
2.3.2.1 Portfolio Investments over ISE
Portfolio investments have changeable characteristics. This kind of capital movements mostly speculative and permanence of that money is very short. That‟s why this is also called as Hot Money2
. Capital movements, which called as Hot money, mostly come to country for short term period. With transaction of foreign exchange to local currency, the aim of foreign investment becomes to create positive added- value by using possibilities of arbitrage. At this section of my thesis, I will try to analyze the effects of foreign capital movements over Istanbul Stock Exchange.
With the increase of depth in Turkish capital markets and political stability, interests of foreign investment raised. Since 2005, foreign holding share in Turkish equity market hadn‟t decreased below % 50. The highest foreign holding share belongs to December 2007 by share of %72.4 and the lowest foreign holding share was %41.6 which was in Nov. 2002
As we see from the graph, increases in the foreign holding share positively affects Istanbul Stock Exchange – 100 index level and decreases in foreign holdings share has downward shift over Istanbul Exchange – 100 index. For example, in January 2002, foreign holding of ISE was 49% levels and in 12 months period, foreign holding‟s share decreased to 43.1%levels.
2 Hot Money: Large quantities of money that move quickly in international currency exchanges due to speculative activity. Foreign funds temporarily transferred to a financial center and subject to withdrawal at any moment. Borrowers enticing hot money should be ready to lose it when another borrower offers a higher rate.
30 Figure 1: Foreign Holdings and ISE – 100
Source: ISE, Oyak Securities Research
Foreign investors‟ sell ISE buy Dollar strategy causes 47% decrease in ISE-100 index, from 10,152$ to 6,324$3. In the analyze of foreign holdings share and ISE-100 index between November 2002 and December 2007, which is lowest to highest foreign holding share period, positive correlation also can be seen. In that period, foreign holdings‟ share increased by 30.8% percentage from 41.6% to 72.4% levels. In same time period, ISE-100 index close value reached to 47,906$ from 8,662$4. Increase in foreign portfolio investments in country raises the liquidity of local capital markets which also increases the market efficiency.
When we analyze data‟s of total market cap of Turkish stocks between years 2002 and 2009, the highest market cap value reached to 98,293 million $ which belongs to October 2007. And the lowest market cap value was 6,568 million $ in September 2002. Foreign holdings‟ share in ISE – 100 was 72.1% in October 2007, which is second highest foreign share in Turkish stock market and in September 2002, foreign holdings‟ share in ISE – 100 was 47.6%5.
3
Dollar / Turkish Lira; 1.3053 (Jan. 2002) and 1,6397 (Dec. 2002). 4
Dollar / Turkish Lira; 1.5353 (Nov. 2002) and 1,1593 (Dec. 2007) 5
Dollar / Turkish Lira; 1,6505 (Sep. 2002) and 1,1716 (Oct. 2007)
0 3.000 6.000 9.000 12.000 15.000 18.000 21.000 24.000 27.000 30.000 33.000 36.000 39.000 42.000 45.000 48.000 51.000 54.000 0% 10% 20% 30% 40% 50% 60% 70% 80% 90% 100% Jan -02 M ay -02 Sep -02 Jan -03 M ay -03 Sep -03 Jan -04 M ay -04 Sep -04 Jan -05 M ay -05 Sep -05 Jan -06 M ay -06 Sep -06 Jan -07 M ay -07 Sep -07 Jan -08 M ay -08 Sep -08 Jan -09 M ay -09 Sep -09 (US$) Foreign Holdings % (ISE)