PERCEIVERS AS COGNITIVE MISERS: SCALE
DEVELOPMENT FOR IMPLICIT LEADERSHIP THEORIES IN
THE CONTEXT OF MBA DEGREES FROM TURKEY
Aykut BERBER*, Yasin ROFCANİN**
ABSTRACT
This study is an attempt to develop and test a scale in Implicit Leadership Theories (ILTs) in the context of MBA students. The study is composed of two steps. The first steps involves two seperate focus groups where statements related to ILTs are developed. In the second step, these statements are tested with surveys to two different sample sets who are full time working MBA students. Results confirm the existence of three factors in ILTs. Further discussions and further suggestions are provided in the study.
Keywords: Scale Development, Implicit Leadership Theories, Cognitive Schemes
ÖRTÜK LİDERLİK ÜZERİNE ÖLÇEK GELİŞTİRME VE
GEÇERLİLİK ANALİZİ: MBA ÖĞRENCİLERİ İLE YAPILAN
BİR ÇALIŞMA
ÖZETBu çalışmanın amacı, MBA öğrencileri bağlamında örtük liderlik teorisi ile ilgili bir ölçek geliştirmektir. Çalışma iki kısımdan oluşmaktadır. Birinci kısımda, odak grubu çalışmaları ve mülakatlar sonucunda örtük liderlik teorileri ile ilgili ifadeler elde edilmiştir. İkinci kısım, bu ifadeleri içeren anketin, tam zamanlı çalışan MBA öğrencilerinden oluşan iki ayrı örneklem grubuna uygulanmasına yöneliktir. Çalışmanın sonuçları , üç ayrı faktör grubunun varlığına işaret etmektedir. Tartışma ve sonuç kısımlarında ilgili faktörler ve uygulamaları ele alınmaktadır.
Anahtar Sözcükler: Ölçek Geliştirme, Örtük Liderlik Teorileri, Bilişsel Şemalar
* İstanbul Üniversitesi, İşletme Fakültesi, Avcılar, İstanbul, E-posta:
** Syracuse University, Faculty of Economics and Administrative Sciences,
16
INTRODUCTION
Early research on leadership categorization theory (Eden and Leviatan, 1975) emerged in combination with developments in social cognitive realms. Central assumption of this line of research is that leadership perceptions and behavioral ratings are provided by the knowledge structures of perceivers (Rosch, 1978). Growth of this idea is rooted in social categorization tendencies observed in society that allowed for the classification of individuals into leader or non-leader categories. Of most significant importance in this theory is implicit leadership theories (Lord, Foti and De Vader, 1984) that have been studied in voluminous contexts and in different cultures.
Treated as outgrowth from traditional leadership studies, implicit theories on leadership represent special forms of cognitive schemas and incorporate the cognitive networks of individuals. General theories of implicit leadership theories imply that they are cognitive structures containing the traits and behaviors of managers (Kenney, Schwartz-Kenney and Blascovich, 1996). Hence, it is the common tendency of followers to apply implicit leadership theories to categorize behaviors of other people (managers in work settings) and try to find grounded explanations for their behaviors (e.g., Lord et al., 1984; Lord and Maher, 1993; Phillips and Lord, 1986).
Lord et al. (1984) developed the theoretical bases for implicit leadership theories based on the path setting contributions of Rosch’s (1978) cognitive categorization theory. Common denominator of both of these theories underpin that perceivers (e.g., followers) classify stimulus persons (e.g., their supervisors) within a specific category that they have in their minds and that is either socially constructed or individually defined. Result of this categorical comparison is the implicit definition of effective leadership in minds of followers (see Lord and Maher, 1993, for an overview). Analyses of extant literature in implicit leadership theories revealed examples including research focusing on the influence of performance information on the perception of leadership (see Lord and Maher, 1991, for an overview), the content of implicit leadership theories (e.g., Offermann, Kennedy and Wirtz, 1994), the overall effects of implicit leadership theories on the perception of a specific leader (e.g., Ensaria and Murphy, 2003; Shamir, 1992).
With development of implicit leadership theories, numerous approaches of social cognitive theory (Fiske and Taylor, 2008) and more general advances in the cognitive sciences have been integrated into leadership studies. These perspectives have enabled scholars understand
17
and evaluate the cognitive processes underlying leaders' and followers' perceptions, interpretations, and sense making in leader member types of dyadic relationships (Shamir, 2007; Shondrick and Lord, 2010).
Formation and effectiveness of implicit leadership theories are affected by cultural contexts and many scholar efforts have emphasized the importance of cultural context when evaluating the implicit leadership schemas of individuals (Shondrick and Lord, 2010). One of the most eminent studies in culture-driven leadership research is the GLOBE (Global Leadership and Organizational Behavior Effectiveness) Project, run by many scholars from different nations and with collaborative efforts (Brodbeck et al., 2000). The GLOBE Project is an example showing the cultural variations and its effect on leadership and organizational behavior effectiveness. In one part of the study, leadership attributes were analyzed across 61 countries and the conclusions pointed out that global leadership prototype tended to change in context of cultural peculiarities of different nations (Brodbeck et al., 2000; Scandura and Dorfman, 2004).
In Turkish context, limited numbers of studies have been conducted to elicit and examine implicit leadership categories of individuals at work settings. One Turkey specific study was a sub-dimension of GLOBE Project (Kabasakal and Bodur, 2007) and another implicit leadership related study was conducted by Paşa (2000). Kabasakal and Bodur (2007) used qualitative data collection and in-depth interview methods to have culture specific insights regarding Turkish culture. Paşa (2000) used the sample of 4 companies that operated in different sectors. 143 members who were both at managerial and non-managerial positions were surveyed on their implicit leadership schemas. Paşa (2000) concluded that there was a prototypical leadership style and showed how status differences among employees affected the desired behaviors of their immediate supervisors. In both of these studies, having a vision, mastering in interpersonal relations, fairness and decisiveness were revealed as determining characteristics for a leader (perceived leadership image). Both of the studies were applied for business sector and reflected the perceptions of already employed people in work settings.
Even though implicit leadership theories have received substantial academic interest among scholars in recent decades (e.g. Fiske and Taylor, 2008), only a handful of studies focused on the development process of implicit leadership theories in minds of followers or perceivers.
18
In same line of thinking, there is no scale developed in implicit leadership theory in Turkish context even though we are informed on culture specific leadership prototypes in Turkey (e.g. Kabasakal and Bodur, 2007). Hence, this study is an attempt to try to develop implicit leadership theories in Turkish context. We used two sets of samples to test our questionnaire in different time settings. We implemented in-depth interviews and consulted the extant implicit leadership literature in order to come up with items for our culture specific questionnaire.
We hope to make certain culture bound contributions to leadership literature. First, this study will contribute to the field as it will picture the perceived leadership images of our participants. The output of the study is efforts on the development of a basic list of attributes and adjectives determining effective leadership prototype. Given the limited scope of studies in implicit leadership theories, our primary attempted contribution is to try to develop a scale on implicit leadership and contribute to this literature with a scale tested in Turkey. Empirical tests that include Exploratory Factor Analyses, Confirmatory Factor Analyses, and Correlation Covariance Matrices further will add to the reliability and validity of the scale offered. We hope that scale offered in this study will be tested in different contexts and will find further validity.
The present study proceeds as follows: first, we provide theoretical background. Then, we discuss the steps we followed in scale development. Findings from in-depth interviews and case analyses are presented in detail. Then we provide findings from item purification stage and conduct exploratory and confirmatory factor analyses for reliability and validity testing. Further covariance correlation matrices are also provided to test for discriminant validity of findings. The study ends with limitations and conclusions.
THEORETICAL BACKGROUND Social Cognitions and ILTs
Over the past 35 years, scholars have shown extant interest in developing leadership theories and ILTs have emerged based on the developing field of social cognition. Fiske and Taylor (1984, 2008) were among the first scholars who argued that information is represented abstractly in schemas, such as types of animals, events, cars, emotions, and people, and this line of argument related to rise of implicit leadership theories. Although different leadership schemas have been identified (such as schemas for different roles and behavioral scripts for different
19
events) they all influence social cognition and person perception by means of shaping an individual's perception, interpretation, memory and stimulus (Brown, Scott and Lewis, 2004; Fiske and Taylor, 1984, 2008). Focused attention on these schemas helps us allocating our scarce attentions to other issues that are salient for us such as solving problems or coordinating activity within a team. We do this by relying on general knowledge and then encoding the unique aspects related to general information about specific others. The result of this cognitive framing process is the formation of our emotional reactions, and behavioral expectations regarding the leader in our minds.
Leadership Categorization Theory
The central message of this theory relates to the fact that followers have schemas of what a prototypical leader should be. Most significantly, this enables followers distinguish leaders from non-leaders by means of assimilating their unique experiences with what they hold as general knowledge in their minds. These learned experiences (Lord, Foti, and Phillips, 1982; Lord and Maher, 1991; Lord et al., 1984) are used during the information processing so that individuals who have similar attributes to a perceivers expectations can be classified as leaders and be distinguished from all others Hence, leadership categorization is actually a pattern matching experience in which the external stimuli (e.g. leadership behaviors) are evaluated regarding a pattern (e.g. prototype) that defines a category for the perceiver. This process generally results in: a) classification as a leader and b) a pattern matching completion process whereby external stimulus are complied with the prototypes of the categorized individual. Importance of our categorical mind sets is that it allows us to access our ILTs that contain general knowledge about leaders, which can then guide our behavioral expectations, sense making, memory and associations we make with unique individual behaviors (Shondrick and Lord, 2010)
The matching process between our cognitive categories and external stimuli can lead to negative consequences for researchers because followers may access to certain categories in their minds and remember prototypical behaviors. In most cases, leaders may be credited for below expected performance of teams because the ILTs held on leaders could be biased towards holding leaders responsible from general performance (e.g. Brown et al., 2004) which may not necessarily be the case.
20
In same vein of battery, perceivers do not have unitary constructs in their minds. Rather, followers process multiple and contextual schemas of leaders (Lord et al., 1984, 1982) which implies that there could be voluminous numbers of prototypical representative of leaders in minds of followers. As argued by Solano (2006), followers could prefer different types of leaders in different contexts. This recognition based approach acknowledges that different patterns of leader behaviors or characteristics can be classified as effective or non-effective (Smith and Medin, 1981).
Emphasis on prototypes as defining characters of leadership categories is in line with trait research in leadership which has searched for defining traits associated with effective leadership in groups or organizations (Judge, Bono, Ilies and Gerhardt, 2002; Lord, de Vader and Alliger, 1986). A path-defining study was conducted by Offermann et al. (1994) where they identified eight distinct trait-like factors that define ILTs (i.e., sensitivity, dedication, tyranny, charisma, attractiveness, intelligence, strength, and masculinity) that are revealed as general elements regardless of the gender of the perceiver and the stimuli presented. Furthermore, Epitropaki and Martin (2004) also replicated the findings of Offermann et al. (1994), and came up with six of these factors. Additionally, they also validated the stability of ILTs across a one-year period and across different employee settings. In many related studies, similar factor categorizations for effective ILTs were found (Hogan, Raskin and Fazzini, 1990; Judge, Colbert and Ilies, 2004; Morrow and Stern, 1990). In sum, extant literature have revealed that because of unique experiences and motivations perceivers have, development of ILTs is very contextual, culture specific and necessitates across-time and across-group validation. Henceforth, researchers have shown surging interest in arguing whether the content of ILTs is universal and whether leadership perception is similar across different cultures all of which place perceivers in central scholar interest.
In the present paper, we argue that understanding and categorizing behaviors of both followers and leaders are social constructs that change face and phase across several cultures. In other words, this study is one of the first attempts to develop a scale on ILC of employees. Even though there are many studies that validated the cross-cultural similarities in leadership prototypes (Den Hartog, House, Hanges, Ruiz-Quintanilla and Dorfman, 1999), ILTs are still social constructs that are shaped by the focal individuals past interactions, unique personal experiences, motivations, expectations and other behavioral related
21
traits. In line with findings of Gersterner and Day (1994), we expect that cultural and contextual uniqueness help us arrive at different conclusions about the prototypicality of specific attributes of leaders which enabled us to develop a scale for ILC in the context of Turkey.
METHOD General Procedure for Scale Development
In his seminal study, Cabrera-Nguyen (2010) outlined a well-defined and accepted framework for development of scales. Our efforts in the present study were in line with overall procedure suggested by Cabrera-Nguyen (2010) and extant literature (e.g. Canino and Bravo, 1994; Worthington and Whittaker, 2006).
22
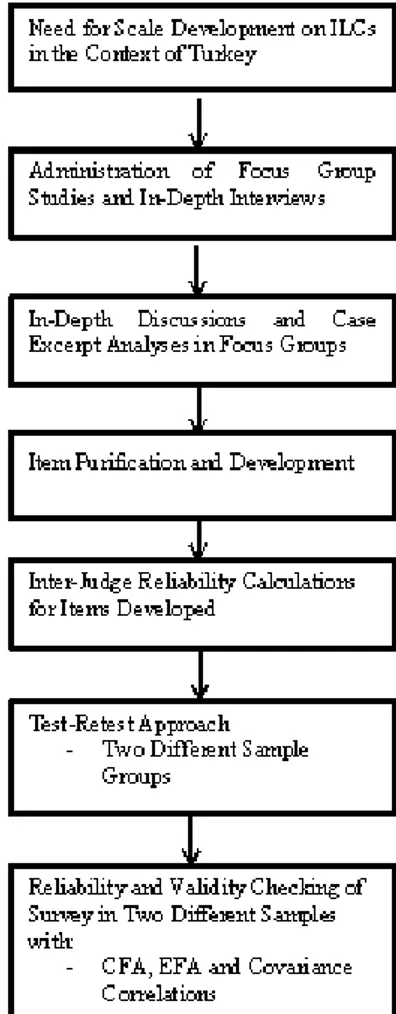
As discussed in extant literature, the first step of scale development is related with the justification of the need for a scale in proposed context which is followed by focus groups, preliminary testing, item development, item purification, scale validation via use of Exploratory and Confirmatory Factor Analyses, and Covariance Correlation Matrices. Please refer to Figure 1 for the overall framework of the study.
Step 1. Need for Scale Development on ILCs in the Context of Turkey
To delineate on this line of thinking, we argue ILCs are culture specific because they represent the perceptions shaped in minds of employees. Starting with efforts of Fiske and Taylor (1984, 2008) and later by plethora of studies in leadership development (e.g. Den Hartog et al., 1999); leadership construct has been associated with local contexts and as reflections of individual perceptions. Recently, GLOBE (House, Hanges, Javidan, Dorfman and Gupta, 2004) project and study of Kabasakal and Bodur (2007) revealed the existence of a different leadership prototype in Turkey which they named as paternalistic leadership. Following these studies, some efforts have been undertaken to empirically test some leadership scales in Turkey (e.g. Paşa, 2000) yet none of these studies aimed at development and validation of a tool on ILC. Empirical studies are conducted with North-American driven scales (e.g. Boyacigiller and Adler, 1991) hence such conclusions pose threats for our generalizations in local contexts. Especially in areas of ILCs where perceptions shape the defining characteristics of leaders, it is imperative to undertake studies with a locally validated scale. Therefore, our core drive was to fill in the need for a local and specific scale on ILCs in the context of Turkish culture.
Step 2. Administration of Focus Group Studies and In-Depth Interviews
As suggested by Canino and Bravo (1994) and Worthington and Whittaker (2006), second step following the justification of the need for a scale is obtaining expert views. We adopted an explorative approach (Whetten, 1989) and conducted two separate focus group in-depth interviews with selected MBA students. They were selected from two largest state owned universities in Istanbul. Participation criteria were multifaceted and included voluntary participation, condition of having taken the management course at MBA level (that was structurally equal in two state universities), and foremost, holding professional jobs for at
23
least two years. Two sets of focus groups were designed, and each group was composed of 7 participants. Researchers administered the in-depth interviews in focus groups and they assumed non-participant roles. Results from focus groups were compiled, content analyzed using NiVO and then were combined into different sets of items.
Participants for this study were 14 employees who held managerial posts and who were prospects for higher status positions in their work environments. Selection criteria were multifaceted and included participation during the lectures, having at least two years of experience in the professional life, and heterogeneity in terms of undergraduate degrees and sectors. All participants volunteered to take part and no rewards were provided in return for their contributions. They were ensured of the confidentiality of their responses. Time allocated for this study was between May-June 2011. Data were collected in two consecutive weeks. Below steps were followed across two focus groups.
1. Semi structured in-depth interviews within each focus group discussion 2. Case excerpt analysis within each focus group
3. Item purification and inter-judge reliability steps on insights gathered from in-depth interviews
4. Efforts of questionnaire development and pre-testing for facial validity
We administered two different focus group studies. Morgan (1997) argues that focus group studies offer advantages for new scale and questionnaire development as each participant breeds from ideas of others in a cohesive and brainstorming discussion environment. Participants were between 22-28 ages and each of the focus groups lasted for about 45-55 minutes, discussions were tape recorded and transcribed manually. This homogeneity observed in both of the groups enabled equal degree of willingness to participation and same level experiences to be shared. Range of professional life experience was between 1 and 4 years which was acceptable. Participants were holding managerial positions with professional industry experience range between 3 and 6 years. Heterogeneity was also observed in terms of industrial backgrounds which is a contribution of this paper. (Eisenhardt, 1989; Yin, 2003)
Step 3. In-Depth Discussions and Case-Excerpt Analyses in Focus Groups
We conducted two focus group studies in two consecutive weeks (May-June 2011). We started in-depth interviews with a general question
24
that aimed to reveal implicit leadership categories in minds of participants. Assuming non-participant role, we asked questions to reveal the implicit leadership schemas of participants. Some examples of the
questions were “Please describe us one of your work related problems
and the reactions of your manager. How did he or she react and according to you, how should he or she have reacted?”
We also asked the same question in an indirect way in order to prevent the orderly way of thinking that may lead to standard and biased answers. Following each answer, participants were asked to provide more specific examples pertaining to solutions of the problem. In order to reveal metaphors related to implicit leadership, participants were asked to write down words –nouns or adjectives- for an effective leader. Metaphors are important and easy to express connotations most people use while describing abstractions. In specific fields of organizational behavior like leadership and team works, use of metaphors is commonsense and a practically used approach. The list of metaphors included terms like “father, brother, basketball coach, story teller, political party governor”. This process lasted for 10 minutes. At the end of in-depth interviews, we exchanged the focus groups and conducted case excerpt analyses with a different group. With this procedure, we aimed to increase objectivity and internal validity of discussions.
Following in-depth interviews with metaphor findings, participants were provided with a very short case describing a business problem and within the case, there were no signs that revealed the gender of the manager, nor were there any leadership connotations. The vignettes were 197 words long, and it described the introduction of a new product into the district of a chosen company. The case does not provide any outcome as performance outcomes are found to affect the leadership ratings. The structural characteristics of the division and the company name were not provided in order not to raise any biases in minds of the respondents. This case has been adapted from the prominent study of Lord et al. (1984). After having had read the case, they were asked to verbalize their thought processes on “the characteristics of an effective leader who would solve the problem”.
Step 4. Item Purification and Development
Discussions in both focus groups were tape recorded and they transcribed. Statements were transcribed first in a word file and then were extracted to NiVO software program for classification. We listed down all the meaningful phrases and sentences. Among a total of 64
25
statements, we derived 34 implicit leadership concepts, phrases and metaphors. The remaining statements had to be eliminated because they were either irrelevant or they were repeated.
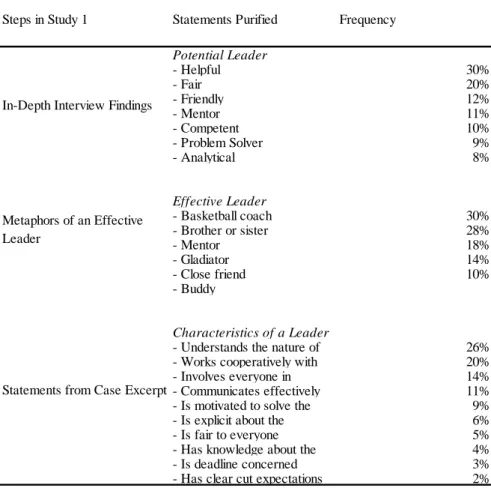
Table 1: Statements Retrieved from Two Focus Groups
Note: Items expressed more than three times were included in each category.
Implicit leadership literature encompasses numerous scales developed. Among these studies, scales offered by Engle and Lord (1997) and Offerman et al. (1994) are among the most comprehensive ones. Engle and Lord’s (1997) scale has 10 dimensions and Offerman et al. (1994) provided an extensive scale that includes 9 implicit leadership concepts. These studies are validated extensively and they are some of the most replicated studies in extant literature (House et al., 2004). Cabrera-Nguyen (2010) argues when items that are derived from focus
Steps in Study 1 Statements Purified Frequency
Potential Leader - Helpful 30% - Fair 20% - Friendly 12% - Mentor 11% - Competent 10% - Problem Solver 9% - Analytical 8% Effective Leader - Basketball coach 30% - Brother or sister 28% - Mentor 18% - Gladiator 14% - Close friend 10% - Buddy Characteristics of a Leader
- Understands the nature of 26% - Works cooperatively with 20% - Involves everyone in 14% - Communicates effectively 11% - Is motivated to solve the 9% - Is explicit about the 6% - Is fair to everyone 5% - Has knowledge about the 4% - Is deadline concerned 3% - Has clear cut expectations 2% In-Depth Interview Findings
Metaphors of an Effective Leader
26
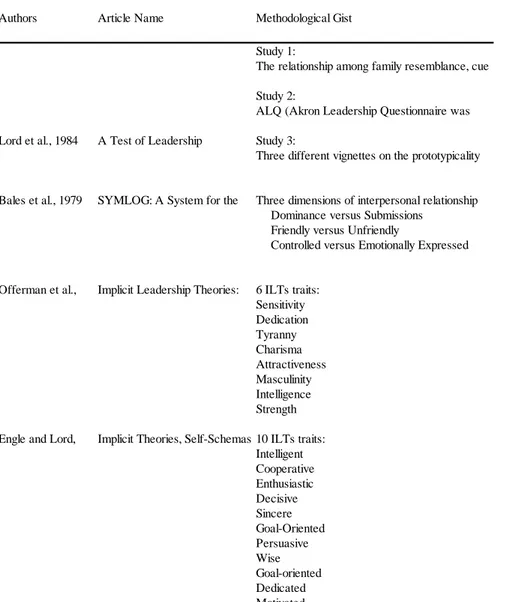
group studies are compiled, most validated and replicated studies should be referenced. Please refer to Table 2 for an overview of selected implicit leadership scales developed in ILT literature.
Table 2: Select Palette of Scales Developed on Implicit Leadership Theories
Based on dimensions of ILC scale items, we categorized our findings into five dimensions. The first dimension is friendliness versus unfriendliness which is about the interpersonal relations of the leader,
Authors Article Name Methodological Gist
Study 1:
The relationship among family resemblance, cue
Study 2:
ALQ (Akron Leadership Questionnaire was
Lord et al., 1984 A Test of Leadership Study 3:
Three different vignettes on the prototypicality
Bales et al., 1979 SYMLOG: A System for the Three dimensions of interpersonal relationship Dominance versus Submissions
Friendly versus Unfriendly
Controlled versus Emotionally Expressed
Offerman et al., Implicit Leadership Theories: 6 ILTs traits: Sensitivity Dedication Tyranny Charisma Attractiveness Masculinity Intelligence Strength
Engle and Lord, Implicit Theories, Self-Schemas 10 ILTs traits: Intelligent Cooperative Enthusiastic Decisive Sincere Goal-Oriented Persuasive Wise Goal-oriented Dedicated Motivated
27
and focuses on the extent to which the leader acts helpful, close and
concerned like a friend. The second dimension which is disciplined versus
undisciplined is about being strict about the outcomes, expectations and
time limits. The third dimension is self-orientation versus team
orientation and it exhibits the degree of cooperativeness, team work support, participation of all the members, coordinative skills, and communication since leading a team requires competency in
interpersonal skills. The fourth dimension is named professional
competency and it concerns knowledge level of the focal leader. The fifth dimension is about the motivations of potential leaders. Besides the focus group interviews, scales from the literature contributed to the efforts of new scale development on implicit leadership. The five categories we developed following our in-depth focus groups were as follows:
Friendliness versus unfriendliness (F Category) Disciplined versus undisciplined (D Category) Self-Oriented versus team-oriented (S Category) Competent versus incompetent (C Category) Motivated versus unmotivated (M Category)
Step 5. Inter-Judge Reliability Calculations for Items Developed
Two independent judges, who were non-participants in this research and who were full-tenured professors in organizational behavior field, were kindly asked to distribute 34 statements into above determined 5 ILT categories. Calculation of inter-judge reliability figures is an important reliability check in qualitative researches because it depicts the agreement rate of categorization among objective key-informants and provides us with some external validity support regarding the categorization process.
Table 3: Inter-Judge Reliability Calculations for Five Implicit Leadership Categories
Note: Diagonal values represent agreement rates among two independent researchers.
Judge 2 Cat. 1 (F) Cat. 2 Cat. 3 (S) Cat. 4 (C Cat. 5 Total Judge 1 Cat. 1 (F) 7 1 0 0 0 8 Cat. 2 (D) 1 7 0 1 0 9 Cat. 3 (S) 1 0 8 0 0 9 Cat. 4 (C ) 1 0 0 3 0 4 Cat. 5 (M) 0 0 0 1 3 4 Total 10 8 8 5 3 34
28
Results indicate that 82.3 % inter-judge reliability is reached between two independent judges. Among 34 statements and concepts, judges have grouped 28 of them within the same category. On category basis, Friendliness versus Unfriendliness has 70 % inter-judge reliability, Disciplined versus Undisciplined has 87.5 % inter-judge reliability, Self-oriented versus Team-Self-oriented has 60 % inter-judge reliability and Motivated versus Unmotivated has 100 % inter-judge reliability. However, when number of categories developed is quite limited, the method proposed by “inter-judge reliability index” becomes an optimum tool to use.
Another reliability check is Inter-judge Reliability Index and it is calculated to be .87. With 95 % confidence interval, the upper and lower limits of the value have been found as 0.888 and 0.862 which is statistically acceptable. Please refer to Appendix for further details on calculation of Inter-Judge Reliability Index.
Step 6. Test-Retest Approach for ILCs
Results of in-depth interviews, focus groups pointed out the existence of five ILTs in mindsets of selected MBA students. In this step, we developed a questionnaire that was composed of five implicit leadership categories. Prerequisite of having a valid scale necessitates internal and external validity of the findings. In order to have face validity of our questionnaire, we asked opinions of five doctoral students in a different university setting. We asked them to complete the surveys and give their opinions about the clarity and ambiguity of statements. Suggestions of participants did not result in significant modifications. Second tool we utilized for face validity is back-to-back translation. Few and minor changes were made in wording of statements.
There is almost agreement among scholars that Cronbachs Alpha is a reliable measure for internal reliability (Cronbach, 1958). It is also a must to see that statements load in their preset factor groups that should be tested via Principal Factor Analyses (EFA) and Confirmatory Factor Analyses (CFA). For external validity, the most consulted approach is test-retest method that includes testing of the instrument in different time settings, across different sample groups both of which work to reduce common-source bias effects. Additionally, we also reported covariance correlation findings discriminant validity and Harmon-one-factor test for common-method bias (Podsakoff and Organ, 1986).
The first set of our select sample group was composed of 114 MBA students of a select state university. Among the respondents, 45.7 %
29
was between 16-25 years old, 53.4 % was female and as expected, 64.3 % held undergraduate degrees. Please refer to Table 3 for demographic characteristics of our Sample 1.
Table 4: Demographic Profiles of Sample 1
N=114
Findings from Confirmatory Factor Analyses
Confirmatory factor analysis (CFA) was conducted by using M-Plus 18. CFA assesses how well the specification of the factors matches the actual data (Byrne, 2001). In that sense, CFA is a powerful statistical tool that enables establishment of construct validity (further elaborated below). Findings are represented in Table 5.
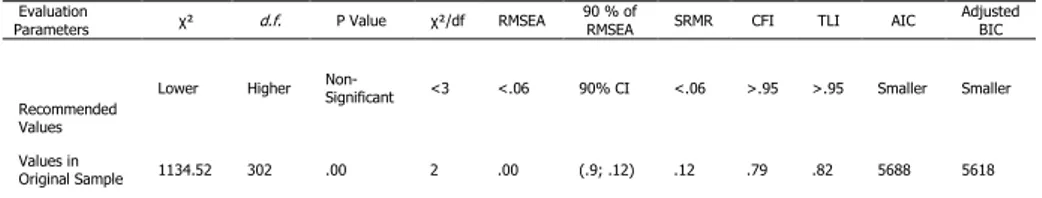
Table 5: Fit Indices for the Present Scale in Sample 1
Evaluation
Parameters χ² d.f. P Value χ²/df RMSEA 90 % of RMSEA SRMR CFI TLI AIC Adjusted BIC Recommended
Values
Lower Higher Non-Significant <3 <.06 90% CI <.06 >.95 >.95 Smaller Smaller Values in
Original Sample 1134.52 302 .00 2 .00 (.9; .12) .12 .79 .82 5688 5618
Note. N= 114. RMSEA= Root mean square error of approximation, SRMR= Standardized root mean square residual, CPI= Comparative fit index, TLI= Tucker Lewis index, AIC= Akaike's information criterion, BIC= Bayesian information criterion.
χ² is significant at p<.001.
Demographic
Categories
Percent
16-25
46%
26-40
41%
41-55
9%
≥ 56
4%
Female
54%
Male
46%
Ph.D. Student
4%
Graduate School
65%
Undergraduate
31%
Age
Gender
Education
30
Factor Name Corresponding Item Factor Value Explanation % Cronbach’s Alpha
Makes decisions by himself 0.89
Values team outputs 0.85
Uses compassion to lead his or her
co-workers 0.82
Competency Understands the nature of the
problems 0.83 22.96 0.74
Is deadline concerned 0.72
Acts arrogant in face-to-face
communication 0.71
Is fair to everyone 0.67
Friendliness Is disrespectful to his or her
co-workers 0.76 19.71 0.62
Is cold when there is need for work 0.75 Works cooperatively with his or her
co-workers 0.61
Acts as a mentor to his or her
co-workers 0.56
66.69 (Total explanation) Kaiser Meyer Olkin Measure of Sampling Adequecy
0.88
Barlett's Test of
Sphericity Chi Square: 327.3
Significance: .000 Team
Orientation 23.99 0.85
In general, the values for the χ²/df and RMSEA (Bentler and Bonett, 1980) met the stringent standards of Hu and Bentler (1999) with all but the CFI (Comparative fit index) and TLI (Tucker Lewis index) that could not met the .95 cut off values recommended (Hu and Bentler, 1999) in extant literature. Fit indices in original and split-sample models were very close. Chi-square (χ²) difference test was conducted to see if one of the models was superior with respect to the other model. Results showed no significant change of model fitness between original sample size and split sample size (p = .14) which provided additional validity for the fitness of the model.
To test internal validity of five implicit leadership categories, we conducted Principal Factor Analysis using Varimax Rotation. All statements in the questionnaire were designed using a five-point Likert-Scale, 1 standing for Totally Agree and 5 standing for Totally Disagree
categories. Validity of factor analyses requires that number of respondents should be at least five times the number of variables in the study. Sample size of the current study meets the requirements.
Findings from Exploratory Factor Analyses
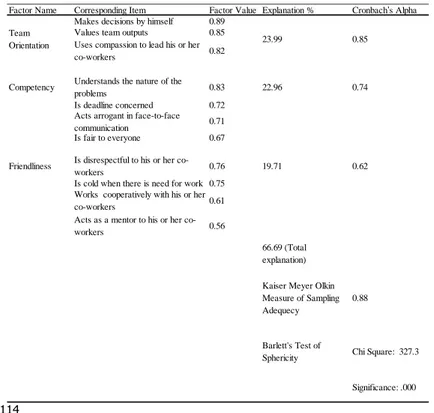
Table 6: Exploratory Factor Analyses Findings from Sample 1
31
The first indicator of fitness of applying exploratory factor analyses is KMO value. It is a measure of sampling adequacy, and in the current study it was revealed as 0.88. Another measure to test the appropriateness of exploratory factor analysis is Barlett’s test of Sphercity which shows the correlations among variables. Level of correlations among study variables should be sufficient and significant to proceed with factor analyses (Hair, Black, Babin and Anderson, 2010). Barlett’s test of Sphercity was significant which validated the use of exploratory factor analyses. Based on Kaiser’s eigenvalue criterion, three factors with eigenvalues greater than one were extracted. Factor groups, factor values, explanation percentages and Cronbach’s Alpha values are depicted in Table 6.
Correlation Covariance Matrices
Aim of reporting correlation covariance matrices are to see whether there is expected degree and direction of correlation among study constructs. It is also a viable tool to see whether study constructs differ from each other (convergent validity) or they almost measure the same construct (Hair et al., 2010). Findings of correlation analyses are reported below.
Table 7: Means, Standard Deviations, and Two-Way Correlations of Study Constructs Means (S.D.) 1 2 3 1 Friendliness 4.15 (0.43) 1 2 Competency 4.35 (0.50) .45*** 1 3 Team Orientation 4.80 (0.35) .51*** .54*** 1 N= 114 * p < .05; ** p < .01; *** p < .001.
Neff (2003) argued that covariance correlations represent important directions about the degree of relationship among study constructs. Furthermore, high correlation levels, as argued by Hair et al. (2010) might signify some problems about the divergence of constructs. In the present study, all correlation values among study constructs are significant and they are in between ranges of .45 (between competency and friendliness) and .54 (between team orientation and competency) which pose no threat for validity purposes.
32
Results of exploratory and confirmatory factor analyses and insights from covariance correlations showed different and reduced number of factor loadings. Total number of items was reduced from 34
to 11 and 3 factor groups were retrieved namely Team Orientation
factor, Competency factor and Friendliness factor. Questions in Team Orientation factor relate to team involvement of the manager. The degree to which team outputs and contributions are appreciated or not and the care shown for team effectiveness tap the viability of this factor group.
As for Competency factor, problems are inevitable in business environments and the success of managers mostly lies in their ability to diagnose the problems and understand the nature of the problematic issue. Even though being deadline concerned does not seem to be directly related with competency, strictness with deadlines can be considered as behavioral reflections of competent managers. Fairness and avoidance to act in an arrogant manner, in the same vein, can also be associated closely with attributes of managers who value competency.
Lastly, respect, cooperation (which can also be a sub dimension of team orientation), mentoring ability and being cold or warm in business related relations are dimensions that capture the extent of a manager’s friendliness. Therefore, the factor loads of these questions are labeled as Friendliness Factor. Dimensions related to motivation and discipline were reduced after item purification because the related questions of these items did not load in appropriate groups and these questions did not have an acceptable level of internal reliability. Possible reasons could be the wording of phrases which might have been biased or which might have implied close meanings to other phrases. Some items of these two dimensions have been retained and were loaded in other groups such as “being deadline concerned” belonged to discipline category however after factor analyses, this question loaded into Competency factor.
Procedure for Sample 2
Validation of a scale developed necessitates across time and across sample testing. Following the findings from sample 1, we re-administered the same questionnaire to 78 MBA students from the second select state university of the study. Demographic profiles of the participant MBA students are shown in Table 8.
33
Table 8: Demographic Profiles of Sample 2
N= 78
Findings from Confirmatory Factor Analyses in Sample 2
In order to test the overall fit between our collected data and theory and confirm it, we conducted Confirmatory Factor Analyses with three factor models. Findings suggest that all values are above cut-off points and represent a good fit (Hu and Bentler, 1999).
Table 9: Fit Indices for the Present Scale
Evaluation
Parameters χ² d.f. P Value χ²/df RMSEA 90 % of RMSEA SRMR CFI TLI AIC Adjusted BIC Recommended
Values
Lower Higher Non-Significant <3 <.06 90% CI <.06 >.95 >.95 Smaller Smaller Values in Original
Sample 987 287 .00 3 .01 (.8; .13) .003 .96 .97 4387 4265
Note: N= 78. RMSEA= Root mean square error of approximation, SRMR= Standardized root mean square residual, CPI= Comparative fit index, TLI= Tucker Lewis index, AIC= Akaike's information criterion, BIC= Bayesian information criterion.
χ² is significant at p<.001.
Demographic
Categories
Percent of
16-25
48%
26-40
35%
41-55
13%
≥ 56
4%
Female
68%
Male
32%
Ph.D. Student
4%
Graduate School
65%
Undergraduate
31%
Age
Gender
Education
34
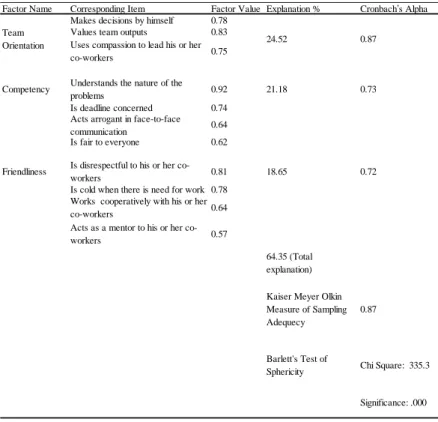
Findings from Exploratory Factor Analyses in Sample 2 Table 10: Factor Analyses Findings from Sample 2
N= 78
Correlation Covariance Matrices in Sample 2
Direction of correlations among study constructs also point out to divergence of constructs. In line with arguments of Hair et al. (2010), study constructs differ from each other as inter-item correlations are significantly different from each other; CFA findings support loadings into single factors and EFA show sufficient degree of variance explained). Range of correlation coefficient values is between 0.51 (team orientation and friendliness) and .27 (between competency and team orientation).
Table 11: Means, Standard Deviations, and Two-Way Correlations of Study Constructs
Means (S.D.) 1 2 3 1 Friendliness 4.26 (0.34) 1 2 Competency 4.65 (0.50) .38*** 1 3 Team Orientation 3.80 (0.22) .51*** .27*** 1 Note. N= 78 * p < .05; ** p < .01; *** p < .001.
Factor Name Corresponding Item Factor Value Explanation % Cronbach’s Alpha
Makes decisions by himself 0.78
Values team outputs 0.83
Uses compassion to lead his or her
co-workers 0.75
Competency Understands the nature of the
problems 0.92 21.18 0.73
Is deadline concerned 0.74
Acts arrogant in face-to-face
communication 0.64
Is fair to everyone 0.62
Friendliness Is disrespectful to his or her
co-workers 0.81 18.65 0.72
Is cold when there is need for work 0.78 Works cooperatively with his or her
co-workers 0.64
Acts as a mentor to his or her
co-workers 0.57
64.35 (Total explanation) Kaiser Meyer Olkin Measure of Sampling Adequecy
0.87
Barlett's Test of
Sphericity Chi Square: 335.3
Significance: .000 Team
35
Results of exploratory, confirmatory factor analyses and patterns among correlation constructs confirmed the existence of three distinctive factors. As evidenced in the first set of MBA samples, re-testing of the questionnaire increased the external validity and explanatory power of our proposed scale. Friendliness, competency and team orientation questions loaded on their presumed latent constructs and the overall explanatory power of three factors is 64 % which is satisfactory. As in the first set of sample, team orientation factor accounted for the highest degree of variance in overall ILTs in the minds of MBA students. Time setting, context of the university and number of participants in both sample groups were different but three underlying factors with same order of explanation power were detected as a result of our validation efforts. Given that sole denominator of two sample sets wad their MBA degrees, findings may shed lights on novel and interesting ILTs for graduate students who hold certain years of professional experience.
DISCUSSIONS
Implicit leadership is a dynamic and interdependent process that integrates mental categories and schemas along with memories, beliefs, expectations and reactions in the minds of followers. As such, implicit leadership theories are diverse and span multiple theoretical perspectives. Research we covered so far shows that much understanding has been reached on understanding implicit leadership theories. Empirical evidence also illustrates that understanding the process of implicit leadership theory development between followers and leaders enhances the quality of mutual interaction and overall effectiveness.
Our investigation of extant studies in implicit leadership showed that the cognitive categories and schemas followers hold regarding the prototypical traits of effective leaders change contextually. Bulk of empirical efforts supported the contingency of leadership. On the other hand, many prominent studies emphasized effective leadership traits that can be cross-generalized. Driven by the opposing views and lack of evidence for a valid scale in the context of Turkey, we attempted to develop an implicit leadership scale using MBA students
In this study, we used both qualitative and quantitative research perspective and conducted two separate focus group studies in different time settings. Use of in-depth interviews and case analyses related to implicit leadership perceptions of participants revealed noteworthy
36
dimensions. After purification and inter-judge agreements, we came up with three different dimensions pertaining to implicit leadership and these were namely Friendliness, Competency and Team Orientation. Our findings are in line with findings from corps of researches that emphasized the interpersonal dimensions of implicit leadership. Even though genesis of leadership studies gained popularity around 80's -that correspond to key points such as the foundation of Leadership Quarterly-implicit leadership theories has gained academic curiosity with advance of psychology and integration of it with organizational behavior.
For long time, there have been ongoing discussions on the extent to which leadership can be generalized and studies such as have revealed that individuals form specific and context based leadership categories in their minds. In other words, one shall not accept that charismatic or transformational leadership attributes are equally effective in all situations. Rise of contingency perspective in implicit leadership theories accompanies many scholarly researchers that attempted to determine implicit leadership scales. Among many of these efforts, studies of Lord et al. (1984), Nye and Forsyth (1991), Offerman et al. (1994), Engle and Lord (1997) proved to be most cited and validated studies. In Turkey, implicit leadership studies were undertaken under the general frame of leadership (e.g. Paşa, 2000; Kabasakal and Bodur, 2007) and with our scale development efforts, we aimed to contribute to the literature especially under Turkish context.
We offered evidence for validation of our three factors via Principal Component Factor Analyses, Confirmatory Factor Analyses and Covariance Correlation Matrices across two sample settings and in different time frames. Hence, test-retest approach of the present study also added to the strength of our findings and factor groups. Factor of friendliness is in line with findings of Engle and Lord (1997). In their study, Engle and Lord (1997) found 10 implicit leadership categories and being sincere, and enthusiastic share same meaning as in our evidenced factor of friendliness. Factor of competency is most similar to dedication dimension found in study Offerman et al. (1994) and to Goal-Oriented dimension found in study of Engle and Lord (1997) though they are not directly the same two dimensions. The last factor validated in present study is team orientation which shares common aspects with Team Oriented dimension (Den Hartog et al., 1999), with Cooperative, Dedicated, and Motivated dimensions (Engle and Lord, 1997) of scales developed in leadership literature. Three factors derived and grounded in the present paper find matching and supporting evidence from extant
37
implicit leadership literature (e.g. Offerman et al., 1994; Engle and Lord, 1997).
This study was exposed to certain caveats and they should be noted. The first inherent limitation was related to administration of two simultaneous focus groups. We tried to compose two heterogeneous groups at different time settings, but demographic profiles of participants were similar due to context-environmental effects. Respondents might have also suffered from social desirability bias when asked for their mental schemas about effective leaders. Age, gender distribution were similar but we could not control for income, occupation and other demographics.
The second limitation worth considering was validity of implicit leadership scale. Scale development is a challenging research that requires very complex sampling procedure and the number of respondents we used to test our scale was quite low when compared to similar studies. We tried to overcome this limitation via employing various validity tools like inter-judge reliability, reliability index and re-test approach. Replication of the findings derived from factor analyses increased external validity of the scale.
Third important caveat that needs attention is about the nature of our samples. We used two different sets of sample including full time working MBA students from two state owned universities. Henceforth, generalizing from our samples posed difficulties. There are many other private universities that have MBA Programs in Istanbul and participation of students from these universities could add to the generalizability of out conclusions.
Cure for most of these limitations will be replication of implicit leadership scale and testing of these findings in a different time, setting and with different samples. Triangulation of research approaches and replication logic will enable us to generalize these findings sooner. This research was an initiation to develop a scale on implicit leadership theories. Guided with lack of research in Turkish context, we hope that this study contributed to our understanding of implicit leadership. Examining for differences in personality, commitment styles and social groups over implicit leadership of individuals offer exciting research avenues for academia.
38
CONCLUSIONSStaying committed to scale development procedure of Cabrera-Nguyen (2010), we attempted to develop a scale on implicit leadership theories in context of Turkey. Triangulation of research from quantitative and qualitative studies was utilized as a methodological framework. Qualitative insights we gathered from two focus groups were subjected to further purification and content analyses by researchers of the focal study. Results were combined into a scale that included the dimensions from our interviews. Staying committed to steps of scale development, we administered our questionnaires to MBA students at different times and in different contexts. Results confirmed the existence of three
distinctive factors namely friendliness, competency and team orientation.
We hope efforts in this study contributed to our understanding of implicit leadership in the context of Turkey and pave paths for further efforts in replicating and generalizing the findings in implicit leadership literature.
REFERENCES
Bentler, P.M. & Bonett, D.G. (1980). Significance tests and goodness of fit in the analysis of covariance structures. Psychological Bulletin, 88, 588-606.
Boyacigiller, N.A. & Adler, N.J. (1991). The parochial dinosaur: Organizational science in a global context. Academy of Management Journal, 16, 262-290.
Brodbeck, F.C., Frese, M., Akerblom, S., Audia, G., Bakacsi, G., Bendova, H., et al. (2000). Cultural variation of leadership prototypes across 22 European countries. Journal of Occupational & Organizational Psychology, 73(1), 1-29.
Brown, D.J., Scott, K.A. & Lewis, H. (2004). Information processing and leadership. In: J. Antonakis, A.T. Cianciolo & R.J. Sternberg (Eds.), The nature of leadership (pp. 125-147). London: Sage Publications.
Byrne, B.M. (2001). Structural equation modeling with AMOS: Basic concepts, applications, and programming. Mahwah, NJ: Lawrence Erlbaum Associates, Inc.
Cabrera-Nguyen, P. (2010). Author Guidelines for Reporting Scale Development and Validation Results in the Journal of the Society for Social Work and Research. Journal for Social Work and Research, 1(2), 99-103.
Canino, G. & Bravo, M. (1994). The adaptation and testing of diagnostic and outcome measures forcross-cultural research. International Review of Psychiatry, 6(4), 281-286.
39
Cronbach, L.J. (1958). Proposals leading to analytic treatment of social perception scores. In: R. Tagiuri & L. Petrullo (Eds.), Person perception and interpersonal behavior (pp. 353-379). Stanford, CA: Stanford University Press.
Den Hartog, D.N., House, R.J., Hanges, P.J., Ruiz-Quintanilla, A. & Dorfman, P.W. (1999). Culture specific and cross-cultural generalizable implicit leadership theories: Are attributes of charismatic/transformational leadership universally endorsed? Leadership Quarterly, 10, 219-256.
Eden, D. & Leviatan, U. (1975). Implicit leadership theory as a determinant of the factor structure underlying supervisory behavior scales. Journal of Applied Psychology, 60, 736-741.
Eisenhardt, K.M. (1989). Building theories from case study research. Academy of Management Review, 14, 532-550.
Eisenhardt, K.M. & Graebner, M. E. (2007). Theory building from cases: Opportunities and challenges. Academy of Management Journal, 50, 23-32.
Ensaria, N. & Murphy, S.E. (2003). Cross-cultural variations in leadership perceptions and attribution of charisma to the leader. Organizational Behavior and Human Decision Processes, 92, 52-66. Engle, E.M. & Lord, R.G. (1997). Implicit theories, self-schemas, and leader–member exchange. The Academy of Management Journal, 40, 988-1010.
Epitropaki, O. & Martin, R. (2004). Implicit leadership theories in applied settings: Factor structure, generalizability, and stability over time. Journal of Applied Psychology, 89, 293-310.
Fiske, S.T. & Taylor, S.E. (1984). Social cognition. Massachusetts: Addison-Wesley Publishing Company.
Fiske, S.T. & Taylor, S.E. (2008). Social cognition: From brains to culture. New York: McGraw-Hill.
Gersterner, C.R. & Day, D.V. (1994). Cross-cultural comparison of leadership prototypes. Leadership Quarterly, 5, 121-134.
Hair, J.F., Black, W.C., Babin, B.J. & Anderson, R.E. (2010). Multivariate Data Analysis. Seventh Edition. Upper Saddle River, New Jersey: Prentice Hall.
Hogan, R., Raskin, R. & Fazzini, D. (1990). The dark side of charisma. In: K.E. Craik & M.B. Clark (Eds.), Measures of leadership (pp. 343−354). West Orange, NJ: Leadership Library of America. House, R.J., Hanges, P.J., Javidan, M., Dorfman, P.W. & Gupta, V.
(2004). Leadership, Culture, and Organizations: The GLOBE Study of 62 Societies. Sage Publications.
Hu, L. & Bentler, P.M. (1999). Cutoff criteria for fit indexes in covariance structure analysis: Coventional criteria versus new alternatives. Structural Equation Modeling, 6(1), 1-55.
40
Judge, T.A., Bono, J.E., Ilies, R. & Gerhardt, M.W. (2002). Personality and leadership: A qualitative and quantitative review. Journal of Applied Psychology, 87, 765-780.
Judge, T.A., Colbert, A.E. & Ilies, R. (2004). Intelligence and leadership: A quantitative review and test of theoretical propositions. Journal of Applied Psychology, 89(3), 542-552.
Kabasakal, H. & Bodur, M. (2007). Leadership and culture in Turkey: A multi-faceted phenomenon. In: J. Chhokar, F. Brodbeck & R. House (Eds.), Managerial Cultures of the World: A GLOBE Report of In-Depth Studies of the Cultures of 25 Countries. Lawrence Erlbaum Associates.
Kenney, R.A., Schwartz-Kenney, B.M. & Blascovich, J. (1996). Implicit leadership theories: Defining leaders described as worthy of influence. Personality and Social Psychology Bulletin, 22, 1128-1143.
Lord, R.G., Foti, R.J. & Phillips, J.S. (1982). A theory of leadership categorization. In: J. G. Hunt, U. Sekaran, & C. Schriesheim (Eds.), Leadership: Beyond establishment views (pp. 104−121). Carbondale: Southern Illinois University.
Lord, R.G., Foti, R.J. & De Vader, C.L. (1984). A test of leadership categorization theory: Internal structure, information processing, and leadership perceptions. Organizational Behavior and Human Performance, 34, 343-378.
Lord, R.G., de Vader, C.L. & Alliger, G.M. (1986). A meta-analysis of the relation between personality traits and leadership perceptions: An application of validity generalization procedures. Journal of Applied Psychology, 71(3), 402-410.
Lord, R.G. & Maher, K.J. (1991). Leadership and information processing: Linking perceptions and performance. Boston: Routledge.
Morgan, G. (1997). Images in organizations. 2nd Ed. Thousand Oaks, London: Sage Publications.
Morrow, I.J. & Stern, M. (1990). Stars, adversaries, producers, and phantoms at work: A new leadership typology. In: K.E. Clark & M.B. Clark (Eds.), Measures of leadership (pp. 419−440). Greensboro, NC: Center for Creative Leadership.
Neff, K.D. (2003). The Development and Validation of a Scale to Measure Self-Compassion. Self and Identity, 2, 223-250.
Nye, J.L. & Forsyth, D.R. (1991). The effects of prototype-based biases on leadership appraisals: A test of leadership categorization theory. Small Group Research, 22(3), 360-379.
Offermann, L.R., Kennedy, J.K. & Wirtz, P.W. (1994). Implicit leadership theories: Content, structure, and generalizability. Leadership Quarterly, 5, 43-58.
Paşa, S. (2000). Turkiye ortamında liderlik özellikleri. İçinde: Z. Aycan (Ed.), Türkiye’de yönetim, liderlik ve insan kaynakları uygulamaları (pp. 225-241). Ankara: Türk Psikologlar Derneği Yayınları.
41
Phillips, J.S. & Lord, R.G. (1986). Notes on the practical and theoretical consequences of implicit leadership theories for the future of leadership measurement. Journal of Management, 12, 31-41. Podsakoff, P.M. & Organ, D.W. (1986). Self-reports in organizational
research: Problems and prospects. Journal of Management, 12(4), 531-544.
Rosch, E. (1978). Principles of categorization. In: E. Rosch & B. Lloyd (Eds.), Cognition and categorization (pp. 27-48). Hillsdale, NJ: Lawrence Erlbaum.
Scandura, T. & Dorfman, P. (2004). Leadership research in an international and cross-cultural context. Leadersh. Q., 15(2), 277-307.
Shamir, B. (1992). Attribution of influence and charisma to the leader: The Romance of leadership revisited. Journal of Applied Social Psychology, 22, 386-407.
Shamir, B. (2007). From passive recipients to active co-producers: Followers' roles in the leadership process. In: B. Shamir, R. Pillai, M. C. Bligh & M. Uhl-Bien (Eds.), Follower-centered perspectives on leadership (pp. ix−xxxix). Greenwich, CT: Information Age Publishing.
Shondrick, S.J. & Lord, R.G. (2010). Implicit leadership and followership theories: Dynamic structures for leadership perceptions, memory, and leader-follower processes. In: G.P. Hodgkinson & J.K. Ford (Eds.), International Review of Industrial and Organizational Psychology (pp. 1−33).
Smith, E.E. & Medin, D.L. (1981). Categories and concepts. Cambridge, MA: Harvard University Press.
Solano, A.C. (2006). Motivacion para liderar y efectividad del lider. Revista de Psicologia General y Aplicada, 59, 563-577.
Whetten, D. (1989). What constitutes a theoretical contribution? Academy of Management Review, 1989, 14(4), 490-495.
Worthington, R. & Whittaker, T. (2006). Scale development research: A content analysis and recommendations for best practices. Counseling Psychologist, 34 , 806-838.
Yin, R. (2003). Case study research: Design and methods. Newbury Park, CA: Sage Publishing.
42
APPENDIX 1Phrases of Dimensions Developed or Borrowed for the Questionnaire
CODE DIMENSION SOURCE
Makes jokes F Friendliness v. Unfriendliness Lord et al. (1984) Is deadline concerned D Disciplined v. Undisciplined Qualitative Study Rewards suggestions S Self-Oriented v. Team-Oriented Den Hartog et al. (1999) Shows care for personal problems of
colloquies F Friendliness v. Unfriendliness Engle and Lord (1997) Is driven to carry out M Motivated v. Unmotivated Qualitative Study Makes decisions by himself S Self-Oriented v. Team-Oriented Den Hartog et al. (1999) Values team outputs S Self-Oriented v. Team-Oriented Den Hartog et al. (1999) Has clear-cut expectations of
performance expectations D Disciplined v. Undisciplined Qualitative Study Has knowledge about the task to be
performed C Competent v. Incompetent Qualitative Study Understands the nature of the problems C Competent v. Incompetent Qualitative Study Does allocation of tasks according to
competencies of colloquies C Competent v. Incompetent Qualitative Study Uses compassion to lead his or colloquies F Friendliness v. Unfriendliness Bales et al. (1979) Tries to accomplish the task under any
constraints M Motivated v. Unmotivated Engle and Lord (1997) Works cooperatively with his or her
colloquies S Self-Oriented v. Team-Oriented Qualitative Study Is stressed in work environment M Motivated v. Unmotivated Qualitative Study Involves everyone in decision making S Self-Oriented v. Team-Oriented Qualitative Study
43
Communicated effectively S Self-Oriented v. Team-Oriented Qualitative Study Is fair to everyone S Self-Oriented v. Team-Oriented Qualitative Study Is over competitive M Motivated v. Unmotivated Qualitative Study Is careless about the work to be done D Disciplined v. Undisciplined Qualitative Study Is cold when there is need for work
related helps F Friendliness v. Unfriendliness Qualitative Study Acts arrogant in face-to-face
communication F Friendliness v. Unfriendliness Qualitative Study Has sufficient competency for any conflict
among team members C Competent v. Incompetent Qualitative Study Is disrespectful to his or her colloquies F Friendliness v. Unfriendliness Qualitative Study Acts as a mentor to his or her colloquies F Friendliness v. Unfriendliness Qualitative Study Does not have an analytical perspective
for any problems in work setting C Competent v. Incompetent Qualitative Study
Case Excerpt used in Focus Groups
X is a district manager for a large company that specializes in one product. X has been with the company for 8 years and supervises 12 stores. Twice a year the company alters the product. Several months in advance, as one part of his job, X sends a long letter he composes himself to the store managers. In addition, X spends 3 days at each store before the proposed change is made. X provides information to the store managers about the changes, emphasizing goals for each stage involved in marketing the new product. If necessary, X will also demonstrate the appropriate handling and display of the new product. Once the improved product is being sold, X returns to each store and makes a routine inspection; he also talks frequently with the managers. These talks enable X to specify problems that may exist within the company or a single store. After visiting all 12 stores, X makes use of the information by writing detailed reports concerning his suggestions to X’s superior. These reports generally take X a week to write, and they are read carefully by X's supervisor, since they are frequently used for making future product changes.
44
APPENDIX 2Inter-Judge Reliability Calculations
IR= {[(F/N) – (1/k)] [k/(k-1)]}.5
IR: Inter-Judge Reliability Coefficient
F: Number of mutual agreements concerning concepts and phrases in each category
N: Number of total phrases and concepts evaluated
k: Number of categories
When F= 28, N= 34 ve k= 5:
IR= {[(28/34) – (1/5)] [5/(5-1)]}.5
IR= .875
Limit = IR + Zc [IR (1-IR)/N] .5 Zc: %c confidence interval with Z value as;
Zc = 1.96
Ir = .875 N = 34
Limit = .875 + 1.96 [.875 (1-.875)/34] .5