i
TURKISH-GERMAN UNIVERSITY INSTITUTE OF SOCIAL SCIENCES INTERNATIONAL FINANCE DEPARTMENT
THE SHORT-TERM EFFECT OF PAYMENT METHODS IN M&A’S
FOR ACQUIRING AND TARGET FIRMS: EVIDENCE FROM BORSA
ISTANBUL
MASTER’S DEGREE THESIS
Enes Güven
ADVISOR
Prof. Mehmet Şükrü TEKBAŞ
ii
ACKNOWLEDGEMENT
I would like to thank my supervisor Prof. Dr. Mehmet Şükrü Tekbaş for his guidance and advices.
iii
TABLE OF CONTENTS
ACKNOWLEDGEMENT ... i
TABLE OF CONTENTS ... iii
ÖZET ... v
ABSTRACT ... vi
LIST OF ABBREVIATIONS ... vii
LIST OF TABLES ... viii
LIST OF FIGURES ... ix
CHAPTER 1 ... 1
1. INTRODUCTION ... 1
1.1. Payment Methods in M&As ... 1
1.2. M&A Waves in the World and Turkey ... 3
1.2.1. Recent M&A Waves in the World ... 3
1.2.2. Recent M&A Waves in Turkey ... 5
1.3. Historical Development of Method of Payment ... 6
1.4. Determinants of Method of Payment ... 8
1.4.1. Corporate Structure ... 8
1.4.2. Information Asymmetry ... 12
1.4.3. Tax Considerations ... 14
1.4.4. Size of the Deal ... 16
1.4.5. Synergy Opportunities ... 18
1.4.6. Market & Business Cycle ... 19
1.4.7. Free Cash Flow & Financial Leverage ... 20
CHAPTER 2 ... 21
2. LITERATURE REVIEW ... 21
2.1. Return to Shareholders of Acquiring and Target Companies ... 22
2.1.1. Examples from the World ... 22
2.1.2. Examples from Turkey ... 33
CHAPTER 3 ... 35
3. DATA & METHODOLOGY ... 35
iv
3.2. Methodology ... 36
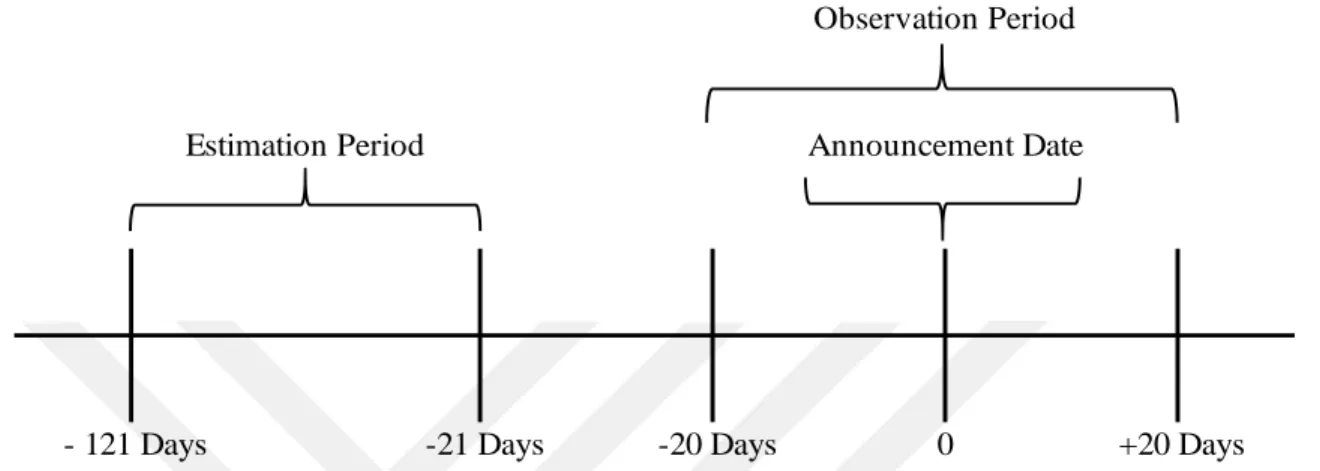
3.3. Event Window ... 39
3.4. Summary of Hypothesis ... 40
CHAPTER 4 ... 41
4. TEST RESULTS: EMPIRICAL FINDINGS ... 41
4.1. The Return of Target Companies ... 41
4.2. The Return of Acquiring Companies ... 46
FINAL CHAPTER ... 51
5. CONCLUSION ... 51
5.1. Further Research ... 54
LIST OF REFERENCES ... 55
v
ÖZET
Şirket birleşme ve devralmalarda kullanılan ödeme metotlarının alıcı ve
hedef şirketlerin hisse fiyatlarına kısa vadede etkisi; Borsa Istanbul’dan
örnekler
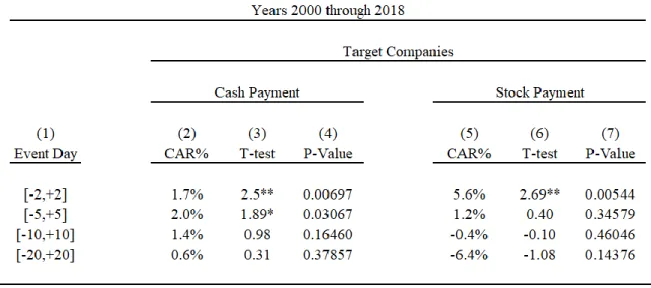
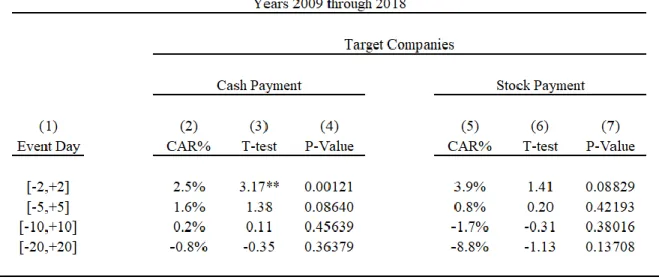
Bu çalışma 2000 – 2018 yılları arasında birleşmelerde ve devralmalarda kullanılan farklı ödeme metotlarının, Borsa İstanbul’da işlem gören alıcı ve hedef şirketlerin işlemi açıkladıklarında hisse fiyatlarına olan kısa vadeli etkisini araştırmıştır. Toplam örneklem 304 tamamlanmış birleşme ve devralmadan oluşmakta olup, nakit ödeme ya da hisse takası türlerinde olan ödeme metotlarına göre kategorize edilmiştir ve olay çalışması yöntemi ile incelenmiştir. En geniş olay penceresi işlem açıklanmadan önceki 20 iş günü ile açıklandıktan sonraki 20 iş günlük periyodu kapsamaktadır. Açıklama günü çevresindeki günlük anormal getiriler ve farklı olay pencerelerine göre kümülatif anormal getiriler analiz edilmiştir. Günlük anormal getirilerde istatiksel olarak anlamlı getiri bulunmamıştır. Ancak kümülatif anormal getirilerde istatistiksel olarak anlamlı getiriler bulunmuştur. İşlemlerde hisse takası yöntemini tercih eden alıcı şirketler, incelenen olay penceresinde nakit ödemeyi tercih edenlere göre istatiksel olarak anlamlı ve yüksek getiri sağlayabilmiştir. Ancak, 2009 – 2018 yılları arasındaki işlemlerde, alıcı şirketler hisse takası yerine nakit ödeme metodunda istatiksel olarak daha fazla getiriye sahip olmuştur. Hedef şirketlerde ise en kısa olay penceresi olan [-2, +2]’de her iki ödeme metodunda da istatiksel anlamlı getiriler bulunmuştur. Olay penceresi uzatıldığında, sadece nakit ödeme metodunda istatiksel olarak anlamlı getiriler bulunmuştur. 2009 – 2018 yılları arasında ise, yine sadece nakit ödeme yönteminde istatiksel olarak anlamlı getiriler bulunmuştur.
Anahtar Kelimeler: Birleşme ve Devralma, Ödeme Metodu, Anormal Getiriler, Kümülatif Anormal Getiriler, Alıcı Şirket, Hedef Şirket, Olay Penceresi
vi
ABSTRACT
The short-term effect of payment methods used in mergers and
acquisitions on the share prices of acquiring and target companies:
Evidence from Borsa Istanbul
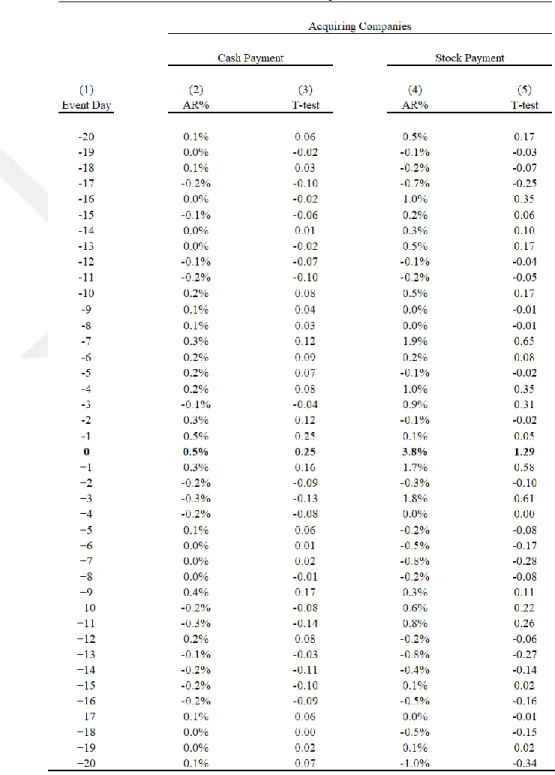
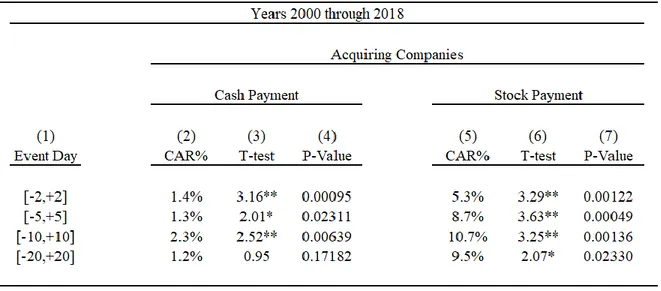
This study has analyzed the short-term effects of different payment methods used in mergers and acquisitions between 2000 and 2018 on the share prices when acquiring and target companies listed on Borsa Istanbul announced the transaction. The total sample has consisted of 304 completed mergers and acquisitions, categorized based on payment methods which are the types of cash payment and stock exchange, and examined by event study methodology. The largest event window covers the period of 20 trading days before and 20 trading days after the announcement date. Daily abnormal returns around the announcement date and cumulative abnormal returns in different time intervals are analyzed. No statistically significant returns have founded in daily abnormal returns. However, in cumulative abnormal returns, statistically significant returns have founded. The acquiring companies which have preferred share exchange method in the transactions, have provided statistically significant and high returns in the observed event window compared to those which preferred cash payment. Nevertheless, in the transactions between 2009 and 2018, the acquiring companies have had a statistically higher return on the cash payment method rather than stock exchange. In target companies, statistically significant returns have found at both payment methods in [-2, +2], which is the shortest event window. Between 2009 and 2018, again statistically significant returns have found only in cash payment method.
Key Words: Merger and Acquisition, Payment Method, Abnormal Returns, Cumulative Abnormal Returns, Acquiring Company, Target Company, Event Window
vii
LIST OF ABBREVIATIONS
AIM : Alternative Investment Exchange AMEX : American Stock Exchange
AR : Abnormal Return
BHAR : Buy and Hold Abnormal Return CAR : Cumulative Abnormal Return CAPM : Capital Asset Pricing Model
CRSP : Center for Research in Security Prices GDP : Gross Domestic Product
LSE : London Stock Exchange M&A : Merger and Acquisition
NASDAQ : National Association of Securities Dealers Automated Quotations System NYSE : New York Stock Exchange
OLS : Ordinary Least Square
UK : United Kingdom
US : United States
USA : United States of America USD : United States Dollar USM : Unlisted Securities Market WLS : Weighted Least Square
viii
LIST OF TABLES
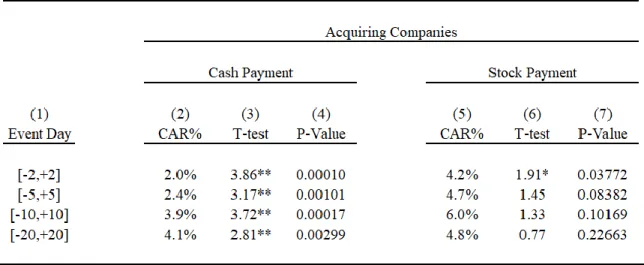
PAGE NO Table 1.1: Breakdown of Turkey’s announced M&As between 2000 and 2018 based on payment method ... 8 Table 3.1.2: Event Window Regarding to M&A Announcement Date ... 40 Table 4.1.3: Daily Average Abnormal Return (AR%) of One Hundred Twelve Target Companies in Cash Payment, and Thirty-Five Target Companies in Stock Payment Method, and T-test Results for Each Day, from Twenty Trading Day before and Twenty Trading Day around the Announcement (Day Zero) of M&As ... 43 Table 4.2 : Cumulative Abnormal Return (CAR%) of Target Companies Based on Cash and Stock Payment Method and T-test & P-Value Results for Cumulative Days with Regard to Different Time Intervals of M&As ... 44 Table 4.3.5: Cumulative Abnormal Return (CAR%) of Target Companies Based on Cash and Stock Payment Method and T-test & P-Value Results for Cumulative Days with Regard to Different Time Intervals of M&As for The Period of 2009 and 2018 ... 45 Tablo 4.4.6: Daily Average Abnormal Return (AR%) of One Hundred Fifty Acquiring Companies in Cash Payment, and Thirty-Two Acquiring Companies in Stock Payment Method, and T-test Results for Each Day, from Twenty Trading Day before and Twenty Trading Day after the Announcement (Day Zero) of M&As ... 47 Table 4.5.7: Cumulative Abnormal Return (CAR%) of Acquiring Companies Based on Cash and Stock Payment Method and T-test & P-Value Results for Cumulative Days with Regard to Different Time Intervals of M&As ... 48 Table 4.6.8: Cumulative Abnormal Return (CAR%) of Acquiring Companies Based on Cash and Stock Payment Method and T-test & P-Value Results for Cumulative Days with Regard to Different Time Intervals of M&As for The Period of 2009 and 2018 ... 49
ix
LIST OF FIGURES
PAGE NO Figure 1.1 : JP Morgan’s Global M&A Volumes 2002 – 2018 (USD Trillion) ... 4 Figure 1.2 : JP Morgan’s Global M&A Volumes (Number of Deals) ... 4 Figure 1.3. : Deloitte's 2018 Annual Turkish M&A Review Report ... 6
1
CHAPTER 1
1. INTRODUCTION
Merger and acquisition (M&A) is a combination of two different concepts. A merger means two different companies reach a consensus and decide to continue their operation in one company. While acquisition means one company decides to purchase another company’s all of the shares or some part of it. In recent times, M&As have become one of the most vital corporate strategies in order to survive in competitive sectors. A rapid change in economic and business environments pushes companies to growth inorganic way especially through merger and acquisition transactions. For this reason, every internal and external factor is a significant decision-making process in those kinds of transactions for both acquiring and target companies and one of the factors which need to be mentioned is that determining the correct payment method. The executive managers consider different payment methods in the transactions for the sake of company and stakeholders. Apart from that, the external investors who trade in security markets may react to M&A announcements in a positive or negative manner while considering the payment method of the transaction as well.
1.1. Payment Methods in M&As
According to Depamphilis (2010), there are two types of payment method in mergers and acquisitions; cash payment and non-cash payment. Cash is the most preferable and easy method of payment in M&As. In this method, the total consideration of agreed purchase price is transferred from acquirer to target company through cash payment. One of the benefits of this payment method is the ownership structure of the bidder company and return on equity do not change. Non-cash payment method can be in the form of the stock exchange (equity financed) which means that some part of the shares in acquiring company is transferred to the target’s shareholders, therefore shareholders of target company become acquiring companies’ shareholders. This result calls as a dilution in the management, in which some cases shareholders of acquiring company do not want such circumstances because of decreasing their shareholdings in the management and risk of losing voting rights. On the other hand, target company’s management may prefer cash payment which increases their
2
wealth and liquidity position immediately or they can prefer stock exchange if they see a huge opportunity for getting stake at the acquiring company. As a result, both parties’ perspectives, enthusiasm and strategies may affect the determination of payment methods in the transaction.
In more detail, Barbopoulos and Sudarsanam (2012) summarized various factors which may be important for determining the payment method such as government rules and regulations, cost of capital, transaction cost, target company’s willingness, liquidity position, risk leverage, capital structure, tax implication, dividend policy, market to book value, premium value, market price of share, ownership structure, profit level, free cash flow, equity flow, return on equity and debt flow. Company management considers all kinds of factors when deciding the payment methods.
After determining the payment method according to the factors above, there is another crucial impact of it on shareholder’s return of both parties – acquiring and target company - and external investors. If the acquiring or target company is publicly traded in the stock exchange and announce the transaction to the public, the investors and other stakeholders may trade the related parties’ stocks by taking into consideration of payment method as well. This may affect firms’ short- and long-term stock price performance with regard to valuation perspective, which in turn induce shareholder’s wealth as well. There has been extensive empirical and theoretical literature about the performance of both acquiring and target companies’ stock price performance throughout the announcement period in different time perspectives especially for the USA and UK companies. However, barely any study focus on the Turkish security market for this kind of research especially considering the payment methods in M&A deals.
For this reason, I have decided to research and calculate the short-term return of target and acquiring companies in the Turkish security market when M&A announcement made with regard to different payment methods and see how investors and stakeholders react to payment methods in a short-term interval. Therefore, I documented a sample of 304 mergers and acquisitions between January 1, 2000 and December 31, 2018 from Turkish security market. All of deals are completed and either acquiring or target company or both of them were listing in the stock exchange by the time deal announced. In the total sample, cash
3
payment deals are about 87% of total deals, while stock payment deals are 13%. In cash payment methods, the total number of companies from both target and bidder side is 266, whereas, in stock payment methods, the number is 38. Some of the deals, only the target or bidder company is publicly listed. The purpose of this study is due to a lack of previous studies, to analyze the impact of the payment methods on stock prices of both bidder and target companies at the announcement of M&A transactions in a short time interval at Turkish security market.
Before analyzing the impact of payment methods, I try to summarize in the next session, recent M&As waves from the World and Turkey to see total scale of M&As, its materialization intervals and nominal dollar terms in recent times.
1.2. M&A Waves in the World and Turkey
M&As take an important place when considering nominal magnitude of transactions regarding to global value in most recent years. It is difficult to distinguish the situation in Turkey from the world and under these circumstances, it can be seen that huge values of M&A activities attract more investors and related stakeholders to get excess returns during the M&A announcements. Following sections highlight recent M&A waves in the world and Turkey.
1.2.1. Recent M&A Waves in the World
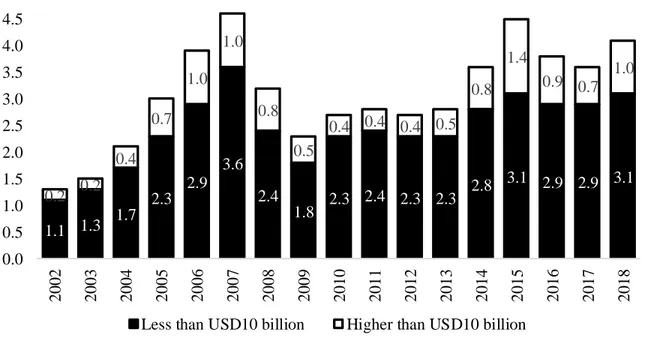
M&A activities volume over the years has been accounted for as trillion dollars. According to JP Morgan’s 2019 Global M&A Outlook, total volume of M&As in 2018 remain strong and grow year-over-year 16%, reaching $4.1 trillion in announced volumes and number of deals greater than $250 million are 2,298 throughout the year. The previous year, the total volume is $3.6 trillion and number of deals greater than $250 million is 2,151 (Figure 1 & 2). Considering the years between 2002 and 2018, the peak point of M&As that occurred in 2007 is around $4.6 billion right before the 2008-2013 financial crises started in the USA and followed by the European debt crisis then spread all over the world. Similar results can be found for mega deals as well. The number of deals greater than $10 billion in 2007 is 46, however, the numbers again decreasing during the crises period. Afterward, in
4
most recent years mega deals increase and reach almost the same level before the crises began.
Figure 1.1 : JP Morgan’s Global M&A Volumes 2002 – 2018 (USD Trillion)
1.1 1.3 1.7 2.3 2.9 3.6 2.4 1.8 2.3 2.4 2.3 2.3 2.8 3.1 2.9 2.9 3.1 0.2 0.2 0.4 0.7 1.0 1.0 0.8 0.5 0.4 0.4 0.4 0.5 0.8 1.4 0.9 0.7 1.0 0.0 0.5 1.0 1.5 2.0 2.5 3.0 3.5 4.0 4.5 5.0 2002 2003 2004 2005 2006 2007 2008 2009 2010 2011 2012 2013 2014 2015 2016 2017 2018 Less than USD10 billion Higher than USD10 billion
Figure 1.2 : JP Morgan’s Global M&A Volumes (Number of Deals)
9 9 15 33 48 46 34 23 16 20 18 19 35 55 35 32 44 939 991 1,333 1,678 2,230 2,765 1,893 1,293 1,7891,8451,8431,9122,108 2,2932,1642,1512,298 0 500 1,000 1,500 2,000 2,500 3,000 2002 2003 2004 2005 2006 2007 2008 2009 2010 2011 2012 2013 2014 2015 2016 2017 2018 Number of deals greater than $10bn Number of deals greater than $250mn
As a result, the strong acceleration of M&A activities in recent years is also a driver of upcoming trends when taking into consideration of cyclical and current macro-economic
5
developments. If we take into consideration gross domestic product (GDP) of the world, according to World Bank, World’s 2018 GDP is around $86 trillion and deal volume to GDP ratio become 5% in 2018 which is again important measurement to understand and see the full impact of M&As as investment factor. The next session covers recent status in Turkey about M&A activities to find out total impacts and volumes.
1.2.2. Recent M&A Waves in Turkey
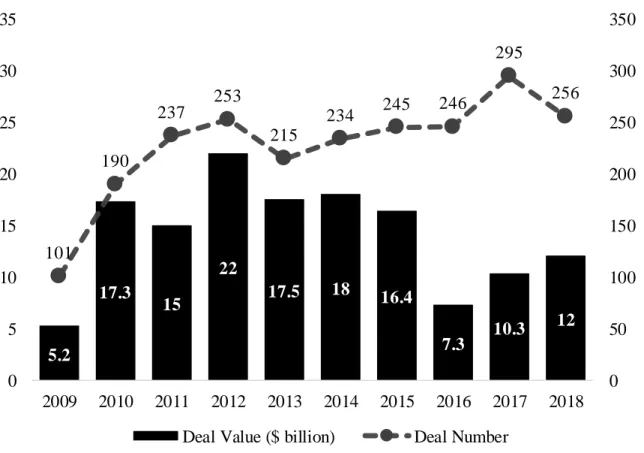
Turkey’s M&A outlook is similar to World’s path but much more volatile due to country based serious economic and political challenges such as currency volatility, borrowing costs, corporate debt levels, inflation factor and often election events due to change in regimes and other factors. Nevertheless, investors and managers pursue opportunities and carry out M&A activities across industries and sectors. According to Deloitte’s Annual Turkish M&A Review, the total volume of M&As in 2018 was $12 billion through more than 250 deals. Although the deal number is decreased compared to one year before at 13%, year over year growth is 17% based on nominal value (Figure 3).
As can be seen that, after the 2009 crisis, the total volume of M&As is increasing in Turkey as well, up until 2016 then the macroeconomic and political problems in Turkey cause a sharp decrease in M&As and start to increase following two years.
The percentage of 2018 annual M&A’s volume to Turkey’s GDP ratio is around 1.5% which is far below the World’s average, shows a huge potential upside for Turkey. Thus, Turkey looks in a recovery situation compare to World and rising expectations for the Turkish market attracts more investors for earning excess returns during the M&A news.
6
Figure 1.3. : Deloitte's 2018 Annual Turkish M&A Review Report
5.2 17.3 15 22 17.5 18 16.4 7.3 10.3 12 101 190 237 253 215 234 245 246 295 256 0 50 100 150 200 250 300 350 0 5 10 15 20 25 30 35 2009 2010 2011 2012 2013 2014 2015 2016 2017 2018
Deal Value ($ billion) Deal Number
In the next session, I explain when the method of payment starts to differentiate in M&As in the World and Turkey historically. Due to a lack of previous studies covering Turkey, I used my findings to see recent trends in Turkey.
1.3. Historical Development of Method of Payment
Over time of periods, different authors analyzed and published so many M&A transactions with different samples and time intervals. Measures of M&As activities displayed varieties over the years and especially from the beginning of the 1970s. Although there were not so many researches regarding the method of payments in M&As, more recent and comprehensive research published by Andrade, Mitchell, and Stafford (2001), explored the proportion of cash and stock payment method used in M&As from 1973 to 1998 in the USA. They divided those years into three categories: 1973 – 1979, 1980 – 1989 and 1990 – 1998. In the first decade, the proportion of cash financed deals was 38%, while stock financed deals were 37% and the rest was the mixed payment method. In the next decade, stock and
7
mixed payment method’s proportions decreased compared to the previous decade. Numerically, the stock payment proportion was 33%, while the mixed payment method was 22% and the rest was the cash payment method. Mitchell and Mullerin (1996) linked this situation in a way that the 1980s were huge redistribution of assets through mergers and acquisitions and almost half of all large-scale and known US companies have received a deal offer with a cash-based payment. In the last decade, the stock payment method increased dramatically and reached 58%, while the cash payment method was 27% and the rest was the mixed payment method.
Another seminal contribution made by Boone, Lie and Liu (2014), who analyzed time trends of method of payments from 1985 to 2013 and analyzed more than 2,500 transactions with cash, stock, and mixed payment method and their results were similar to Andrade, Mitchell and Stafford. They argued share payments made their peak point in the 1990s and constitute more than 60% of the total sample; however, it declined under 20% of takeovers in recent years. Nevertheless, cash-based deals represented 25% of sample in the late 1990s, but they increased their share in the 2000s and reached more than 50% in the total sample. At the same time mixed payment, which was comparatively unusual in the 1980s, increased its popularity in the 1990s and reached a steady level at the beginning of the new century. In other words, mixed payment’s share in total deals approximately on average was 10% in the 1980s and 1990s and triple to around 30% at the beginning of the 2000s.
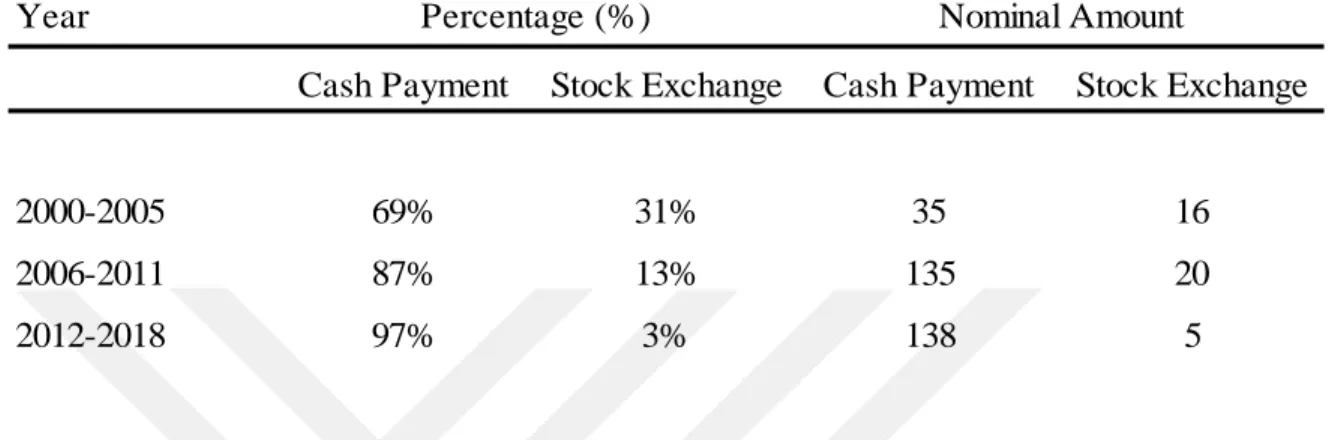
For Turkey, based on my knowledge, there is no such paper examines the payment methods. For this reason, I used my unfiltered samples to see how payment methods in Turkey evolve from the beginning of 2000 to end of 2018 with a total sample of 349 takeovers. Although most of the deals were made by the cash payment method, in some years the tendency to use stock payment reached its own peak points. I created three sub-groups based on years: 2000 – 2005, 2006 – 2011 and 2012 – 2018. In the first 6-year period, the proportion of stock payment method was 31% (which is the peak point) and the rest was cash payment, whereas the following two periods: 2006 – 2011 and 2012 – 2018, the proportion of stock payment method was decreasing gradually to 13% and 3% respectively. It can be seen that the companies started to use more cash financing in their takeover activities in
8
recent years and also mixed payment method was not used in Turkey at least in disclosed deals (Table 1.1).
Table 1.1: Breakdown of Turkey’s announced M&As between 2000 and 2018 based on payment method Year
Cash Payment Stock Exchange Cash Payment Stock Exchange
2000-2005 69% 31% 35 16
2006-2011 87% 13% 135 20
2012-2018 97% 3% 138 5
Percentage (%) Nominal Amount
Consequently, the tendency to use stock payment was decreasing gradually in Turkey. The rationale behind this situation is ambiguous but in the next session, I explained which factors are considered when deciding payment methods in M&As from both acquiring and target firms’ perspectives in a broad sense.
1.4. Determinants of Method of Payment
The determinants of a payment methods in M&As depend upon more than one factor. Prior researches based on empirical and theoretical workings focused on the reasons behind the payment method and found the reasons such as corporate structure, information asymmetry, tax considerations, size of the deal, synergy opportunities, market & business cycle, and financial leverage & free cash flow. All of them influences payment method choice in takeovers.
1.4.1. Corporate Structure
Payment method preferences in M&As may be related to the ownership structure of both parties. In a broad sense, ownership structure means that the percentage of equity held by shareholders in the company’s total equity. It is commonly known that the greater shareholder’s percentage in the ownership of acquiring firm, the more possibly the cash is used in a transaction. In other words, acquiring company’s management offer cash-based
9
payment with the purpose of not diluting their existing shares after the deal closed. However, in stock-based deals, the acquiring company offers a stock exchange to exercise control over the target’s business and in such circumstances, the decision can cause dilution of acquiring company’s ownership structure in the management, which in turn decreases oldest shareholder’s stakes in the ownership structure.
There exists a considerable body of literature on managerial ownership, for example, Stulz (1988) explored the connection among method of payment in M&As and bidder companies’ ownership structure. They found that, if the acquiring firms’ managers have large blocks in the management of the company, they most likely choose cash offer instead of share exchange. Besides, they also added if the target company’s managerial stake is enough to control company, the likelihood of hostile takeovers is low, because the target with a higher percentage may request more shares in the acquiring company in the negotiation phase.
Moreover, Amihud, Lev and Travlos (1990) looked at 209 transactions in the USA between 1981 and 1983 in Fortune 500 companies and found that cash offers have priority when the bidder company’s managerial ownership has higher fraction on whole shares, the more probably they select cash instead share payment. Managers who have a large block holder in the management, they are unwilling to dilute their shares and increase loss over the control risk because of stock-based payment. Numerically, in cash-based transactions, the firm’s top five equity holders hold almost 11% of total equity. However, in stock-based deals, their percentage is less than 7%. This study at one-degree links to Martin’s (1996) paper, they explained there is a nonlinear relation among bidder company’s share owners and the probability of stock-based deals. If company management has an ownership percentage between 5% and 25%, the probability of stock-based payment occurrence is low. Because the share owners are concerned about dilution of their shares. Under other conditions, managerial ownership at very low and very high levels probably prefer stock-based payment methods due to a lack of dilution problem.
Another research published by Song and Walkling (1993) used 306 sample companies consist of 153 target and 153 non-target companies which relate to acquisition announcement in the USA between 1977 and 1986. They analyzed two intriguing perspectives; first, the correlation among ownership percentage and possibility of becoming
10
a target company; second, the impact of ownership percentage on target company shareholders’ value.
First, they calculated the median and mean of the managerial structure of the target firms, randomly selected non-targets and industry-matched non-targets in the total sample. Their results were target firms’ managerial structure is significantly lower than industry-matched non-targets, which means that those which became the target company; their management has a lower ownership percentage in management compare to non-target industry-matched companies. They also studied contested deals as well. In contested deals, the average managerial ownership percentage of target firms is around 6.4%, which is significantly different from the average level of 18.7% for the industry-matched non-targets. This means that a target company with a lower percentage of equity stake has a higher chance to become a contested target in M&A transactions. On the other hand, in uncontested deals, they outlined the average percentage of ownership in the management for successful deals is around 15.2%, which is significantly higher than the 8.6% of unsuccessful deals. As a result, target firms, which have strong controlling ownership structure are most likely to be attempted by the bidders who adopt an uncontested way of transaction.
Also, they studied the influence of target’s ownership percentage on probability of takeover attempt using logistic regression and found there is an inverse correlation among ownership percentage and likelihood of becoming a target company. If firm’s managers have higher managerial ownership in the management the less likely they may become a target and try to be acquired from other companies.
Second, they tested target company shareholders’ abnormal return in the short-term interval -5 to +5 day including announcement date and their equity percentage in the management. According to their results, when the target’s equity percentage is low, the average abnormal returns are 29.5% in successful takeovers, while if the management holds a higher percentage in the management, their average abnormal returns are 5.2% in unsuccessful takeovers. They explained this result by regressing cumulative average abnormal returns on ownership percentage and other variables. So, the regression results showed that there is a vastly positive relationship between the target company with a higher ownership percentage and abnormal returns in contested deals, eventually accomplished
11
deals. In all uncontested and contested offers but not successful acquisitions, the relationship seems insignificant. To summarize, the results of Song and Walkings indicated that the probability of becoming a target company and the success of acquisitions is associated with the percentage of ownership in the management.
Ghosh and Ruland (1998) also approved the matter related to the constructive relationship between the bidder’s ownership percentage and method of payment. They investigated 212 samples of successful acquisitions in the USA between 1981 and 1988. They divided the entire sample into three different groups – cash, stock, and mixed offers. Their results show that target companies’ average managerial ownership is significantly larger in stocks, whereas acquirers’ average managerial ownership is relatively high in cash offers. Accordingly, the cash is chosen rather than stock when acquirers’ managerial ownership is relatively high. In targets, they most probably to choose stock if they still request voting right in the merged firm. They also applied logistic regression to analyze the effect of managerial ownership on the probability of stock payments. First, they sub-grouped the bidder’s managerial ownership percentage to into three categories to be able to adjust their logistic model. These percentages are 0% - 3%, 4% - 25% and above 25%. The same percentages are applied for the target firms as well, but the cutoff point at 3%. The results have confirmed their propositions, which are the managers who have large ownership percentage in the target firm prefer stock-based payment to protect their position in consolidated company, while the managers who have sizable ownership in the acquirer firm reluctant to use stock-based payment because of a diluting problem in their shareholdings.
Yook, Gangopadhyay and McCabe (1999) analyzed all delisting companies and their ownership structure from 1979 to 1988. The reason for delisting activities was proxy of thereafter acquisition event. They only looked at stock and cash payment methods of 309 events during the observed time interval, and their results were supportive to Amihud, Lev, and Travlos (1990) which was cash-payer companies have significantly higher shares in the management than stock-payer companies.
12 1.4.2. Information Asymmetry
Information asymmetry is known as where unequal information distribution between parties. That is to say, if the bidder firms’ management has significant insider information of target firm, this affects their choice regarding the payment methods in the transaction. Several authors reported in the literature to address this issue. For instance, the following study conducted by Myers and Majluf (1984) explained information asymmetry in M&As and concluded that favorable insider relating to bidder firm performance lead to stock-based payments. Given asymmetric information, company management has more knowledge regarding the target firm’s value and opportunities than external parties, they will eventually issue a share if and only if the project has positive results. Because, if they do this, although some of the issue stocks over or underpriced, the share eventually priced on average at an equilibrium level.
However, if the managers of a company have insider information about the target company which is so favorable to the management, they may have an interesting path to follow – if they act in the interest of old stockholders, they may deny issuing new shares to target company's stockholders even if it means missing a good opportunity. In other words, the cost to old stockholders of issuing new shares is so high and may outweigh the opportunity of M&A. So, the outside investors aware of information asymmetry and they will deduce that the news contains good news or at least less good. Then they are willing to give a buy order for the stock.
Another seminal contribution has been made by Hansen (1987) explained the transaction process based on the choice of payment methods. They re-examined Carleton’s (1983) study and added 61 more takeovers from 1978. Their total sample covered 106 takeovers for the period between 1976 and 1978. They created “lemons” problem. In cash based deals, when the acquired company has insider knowledge about its business, a “lemons” issue shows up; the target company will accept the offer if company’s value is lower than the binding offer according to its own valuation. Because of this adverse selection, the bidder company will protect itself while making its offer based on expected value conditions. However, the target firm uses its own information and may not always accept the
13
offer made, so the transaction is not always finished. To be able to continue to deal process, the bidding firm can offer share payment instead of cash. The share has unforeseen pricing impact, in which can promote the target firm to welcome the received offer if they would believe it is equal to cash offer.
A further scenario was “double lemons” problem, which means that permitting the bidder company to have restrictive knowledge about its value as well. In that case, the stock offer will not be an option when the acquired company extenuate the value of the proposal (for instance, when the bidder firm has a notion that its possession is worth more than the acquired company deem). Due to adverse selection and signals of not offering stock offer, the target company should decrease further its estimation about the value of bidder’s stock. Hansen highlighted an equilibrium point where the bidder company offers stock when it is “overvalued” and propose cash if assumed “undervalued”, thus the acquired company deduces the magnitude of any stock offers as a signal of bidder firms own valuation. Besides, the bidder ideally embraces the optimal size of stock and cash offer to the target firm.
Furthermore, Travlos (1987) substantially looked at the deals between 1972 and 1981 by conducting an event study and study importance of market reaction when there is asymmetric information. According to their study, they concluded that if the asymmetric information is valid, the payment method may signal crucial information to the market regarding merger and acquisition news and cash payment methods mean which bidder firm is undervalued in stock exchange, whereas stock payment method is the opposite case. This has also been explored in prior study by Fishman (1989), created a model where preemptive bids to analyze the information asymmetry hypothesis. Their findings confirmed Travlos’ (1987) and indicated that cash-based payments in takeovers contain good news in the matter of valuation of bidder’s asset. Hereof, the target company’s managers probably reject such an offer including share exchange or potential competitors prevent cash offers, in which compared with share exchange.
Finally, another promising line of research would be Cornett and De (1991) found different results compare to other authors with regard to asymmetric information approach. They examined inter-state bank M&As in USA from period of 1982 to 1986, and concluded that abnormal returns for bidder companies’ equity holders are positive for cash, stock, and
14
mixed financed deals. The result was obviously contrary to other researches findings and appeared inconsistent with the asymmetric information. To address the result outlined above, according to authors, the possible explanation is in banking firms, information asymmetry might have less effect compare to non-banking firms regarding undervaluation or overvaluation. In other words, asymmetric information does not have a significant role in inter-bank M&As than those of non-bankings. Moreover, they demonstrated that bidder firms carried off positive signals to the market via stock-based payment, because of various regulatory rules and processes. As such, the stock-based payment announcement in the merger by bidder company indicates that, they have met required conditions of regulatory bodies. Within this framework, in baking takeovers, stock payments include positive information about the bidder companies.
In case of complete market, shareholders of both parties would be indifferent in case of payment methods in M&As using information asymmetry. However, capital markets include spoils of asymmetric information. The information regarding the payment method that is released by both parties, has therefore significant effect on value of the companies.
1.4.3. Tax Considerations
It is of interest to understand whether there is a connection between choice of payment and tax considerations in M&As. In the accounting standards, any capital earnings must be realized for the tax payments. The medium of exchange is taxable effectively in cash payment; however, in stock payment, it is deferrable until the share eventually sold by the shareholder. Thus, any target firm who subject to acquisition attempt may end up with higher and extra tax burdens compare to previous periods depends on tax treatments, and shareholders of the target company must know this and request compensation for their extra tax cost. In other words, the bidder company must make a higher acquisition price offer if the offer is cash based in order to reimburse for tax cost of acquired firm’s equity holders. This is widely reported and extensively explored in the literature.
The tie of tax and payment methods is also studied by Wansley, Lane and Yang (1983) in the acquisitions. They analyze the effect of payment methods of target companies’ cumulative average abnormal returns (CARs) preceding two months following deal
15
announcement. They found that CARs are 33.54%, 17.47% and 11.77% when the transaction made via cash, stock, and mixed payment respectively. Reason for the significant discrepancy among cash and others is explained by the authors through taxation implication theory. It is concluded which there are higher returns to acquired firm’s shareowners albeit the payment made via cash offer, means that the bidder firm must compensate further tax cost of shareowners of acquired company in this kind of circumstance. In respect to this, the tax burden is postponed until the share is sold in share exchange offers.
Huang and Walking (1987) published similar results as Wansley, Lane and Yang from acquired company’s viewpoint post-acquisition share performance. They investigated 204 mergers and acquisitions between 1977 and 1982 and found that cumulative average abnormal return for cash, stock, and mixed payments are 29.3%, 14.4%, and 23.3%, respectively. They interpreted their results similar to Wansley, Lane and Yang in terms of taxation implication theory.
Another paper is written by Harris, Frank and Mayer (1987), who examined 2500 M&A sample in UK and USA between 1955 and 1985 based on tax consideration of both parties in the transaction. They found that it is a general phenomenon that the offers constitute all-cash or all-share payment methods at those times in both countries. The reason for this situation is shareholders of target companies, who care additional tax burden due to capital gains, will be most likely to choose share exchange, while those who do not care and do not want a share from acquiring company will be glad to accept cash offers. They called this indication as tax and transaction cost efficiency. However, they verified that there is no clear evidence showing cash used acquisitions arise regarding capital gain taxes. The two reasons behind this explanation are; it is a large sample of study constitutes a thirty-year duration and there were major amendments in tax and accounting standards in both countries. For example, the UK introduced capital gain taxes in 1965 and the study showed that cash payment methods decline 18.6% from 1965 to 1969 when compare it with the previous period from 1960 to 1964, which is 29.2%. Yet, in the following period from 1975 to 1979, the proportion of the cash payment method increased to 33.6%. Due to different kinds of findings, it is confirmed there is no empirical evidence indicate strong connection between cash payment methods as a medium of exchange and capital gain taxes. Finally, their
16
empirical study demonstrated the bidder firm’s post-acquisition performance is better in cash payment methods compare to share exchange payment methods, that is coherent with information asymmetry proposition of acquirer’s overvaluation as previously discussed.
Lastly, Brown and Ryngaert (1991) explored tax effect in the mergers and acquisitions through a model in which payment method incorporates consistency with the USA tax code. Their model predicted that the offers ought to be cash, mixed or stock payment where less than half of stakes acquired with cash. They collected 342 M&As from the Center for Research in Security Prices from period of 1981 to 1986 and filtered the results while excluding if the target or bidder is not a US exchange listed company or the bidder already have majority control over the target company. In the sample, they found that low valuation bidder companies prefer an offer which contains at least 50% share exchange. Whereas, highly valued bidder companies choose cash payment offers. They offer cash because they avoid issuing undervalued stock of their own company and target company’s shareholders choice will be cash as well due to their additional tax cost. Lastly, low valuation bidders offer stock payments to defer tax burden, which is also consistent with other authors’ results.
1.4.4. Size of the Deal
A series of recent studies has not reached a consensus on the acquired company’s relative size effect compare to acquiring for implementation of different payment methods. Some prior researches view that the bidder company is more likely to prefer share exchange if acquired company’s size is relatively high to bidder in mergers and acquisitions; whereas some other authors reject this hypothesis.
Extensive prior research published by Grullon, Michaely and Swary (1997); they created multinominal logistic model to interpret predictive factors of method of payments. Their total sample was 146 USA banking sector takeovers between 1981 and 1990. Logistic regression testable variables are merged banks’ equity positions, acquired’s relative size, and both parties’ return on equity. Their result showed stock and mixed payments are more likely to be prefered in takeovers where the acquired company has superior resources positions in their equity compare to acquiring which contended with a higher ratio of share to cash and the combination to cash positions which are 2.12 percentage and 1.87 percentage respectively. For targets’ relative size,
17
they found that mixed and stock payments are more likely used in M&As if the target firms’ relative size are high compare to acquiring company; which is also confirm their hypothesis which is target companies’ relative size is assertively relevant to payments methods in mergers and acquisitions.
Whereas Ghosh and Ruland (1998) studied the relative size of deals for the payment methods in takeovers. Their findings are contrary to Grullon, Michealy and Swary. This study did not find a significant relation between the payment methods and relative size of deals using a logit regression model. They explained this result with regard to the attitude of both parties in the negotiating process. If the acquired companies’ size is comparably high to the acquiring, shareholders of target company most likely desire share payment so as to have an influence on management of combined firm; on the other hand, shareholders of bidder company do not want to dilute their shareholdings in the management. For this reason, the motivation of both parties in the negotiation affects the payment methods. Thus, there is no significant linkage among
payment methods and deals’ relative size. These findings also support Martin’s (1996) paper,
who did not determine any relation among two of them. Their findings showed that the relative size, which calculated with the ratio among acquisition price and market capitalization of the target company as of twenty trading days before the announcement of acquisition made, is not significant at the 5% in their regression models. This means that there is no significant relation between target companies’ relative size and method of payments in mergers and acquisitions.
Another seminal contribution published by Faccio and Masulis (2005) and their results are contrary to Martin, Ghosh and Ruland; they outlined a significant relevance between the deal size and method of payments. They analyzed European deals over the period from 1997 to 2000 and conclude that average deal size, which is one of the variables in their regression model, is significant at the 1% level and its coefficients are all of the anticipated signs. Numerically, average deal size for the stock financed deals is seventeen times larger than cash financed transaction, also average relative magnitude of the acquired company to the acquiring is much higher in stock financed transactions at around 18%, whereas it is lowest in cash financed deals at a 7%. For the mixed payment deals, relative size is around
18
16%. As a result, they argued the relative and average magnitude of acquired company to acquiring has a crucial influence on method of payments in M&As.
The paper of Swieringa and Schauten (2007) showed same results as Faccio and Masulis. They reviewed 227 M&As during the 10-year period from the period of 1996 to 2005 in the Netherlands. They found that, in stock payment deals, the bidders have the largest relative deal size with 18.9% and in mixed payment deals, the percentage is 17.9; whereas, in cash payment deals, the bidder has the smallest relative deal size with 9.7%. This showed that, on average, cash payment methods are used in relatively small targets. They also looked nominal value of the deals and indicate that in stock-based payments, the deal size is approximately 9 times larger than cash financed deals, and 3 times larger than the deal value of mixed payment methods. As a result, they concluded which there is a significant non-positive relationship among cash-based payments and relative transaction size in mergers and acquisitions.
1.4.5. Synergy Opportunities
Synergy is a well-known concept in M&As, and refers that the value of combined company after the deal should be greater than the sum of acquiring and target firm’s value separately. Synergy classifies as a goal, in which the accelerated growth of the combined company’s financial and operational performance. Moderately, payment types in M&As rely on bidder company’s growth opportunities. One of the most extensive research written by Martin (1996), who analyzed the relation among blooming opportunities of companies and method of payment in M&As.
Martin analyzed 846 USA takeovers sample between 1979 and 1988, and calculate CARs of three payment methods. They applied the traditional market model using variables such as leading economic indicators and institutional ownership of shares and found that the variables are not statistically different at 10%. This means that the variables do not significantly affect payment types in M&As. Moreover, Martin applied multinominal logistic regression to examine same effect as well. Tobin’s q-ratio is used, in which market value ratio to the current replacement cost for the measurement of company’s growth opportunity. In Tobin’s q-ratio, if q is above one, company has a motivation to make capital expenditures,
19
if not the situation is opposite case. Their model regressed the growth opportunity of a company via Tobin’s q-ratio and stock-based payments and their results showed coefficients on Tobin’s q-ratio are significant and positive in the model. Thus, they confirmed that stock exchange is most likely used in the acquisitions when the bidder company has greater growth bopportunities after the takeover. According to the author, one possible reason behind this result because of the high growth opportunity, the bidder company needs more cash to make more capital expenditures.
Faccio and Masulis (2005) analyzed growth opportunities as well. They used Tobit regression to predict over payment methods on explanatory variables such as growth opportunities, which describe as a ratio of bidder company’s market-to-book ratio and they indicated target company’s equity holders were more likely to prefer stock of bidder company when a bidder has promising growth opportunities. The results also similar to Martin’s findings, which were higher than the ratio, the more likely share exchange is preferred in transactions. Statistically, there is a significant relation at 1% level. They also added that in domestic acquisitions, the stock is more presumably frequent, whereas, in cross-border acquisitions, the cash is more preferable – in which the targets are inclined to inspect acquirer’s market value as a vague.
Lastly, a recent study conducted by Alshwer, Sibilkov and Zaiats (2011), studied extensive 3335 mergers and acquisitions from the USA between 1985 and 2007. They also found similar result like previous authors, which is stock financing is most likely used in M&As when the bidder company has high growth opportunity.
1.4.6. Market & Business Cycle
M&As timing is one of the significant factors, which considered by equity holders of bidder company due to the target company’s future potential and its existing performance in stock exchange. There is a general customary view that share-based compensation is preferred in M&As when target company has a relatively low share price compared to its peer groups.
Kusewitt (1985) who studied 128 companies that involve mergers and acquisitions activities from 1967 to 1976 in the USA. They measured the acquisition timing regressing
20
the monthly average of Standard and Poor 500 index performance between 1950 and 1977. Timing measure is a ratio, which Standard and Poor 500 average value of quarter before the acquisition announcement to trend value of acquisition month. They discovered more mergers and acquisitions happen when the timing measure ratio is high, and vice versa. Eventually, their findings showed cash-based payment is more likely preferred when timing measure ratio is low. In other words, there is a positive correlation among timing measure ratio and share-based payment.
Another paper conducted by Martin (1996) as explained before, also analyzed the influence of business cycle on payment structures in M&As. They defined business cycle as fluctuation at Standard and Poor 500 index, eleven significant economics key performance indicators, industrial production, and bond yields of Moody’s BAA. Their results showed that only Standard and Poor 500 index is a significant impact on stock-based payments. However, other variables have a negative sign on payment structures. Consequently, they stated that if the stock market shows high performance overall, bidder companies are more probably exercise share-based payment in M&As.
1.4.7. Free Cash Flow and Financial Leverage
Free cash flow is after a company pays its operational costs and capital expenditures, the remaining cash generally names as free cash flow. In M&As, the management of bidder company considers available cash level for potential cash financing methods. Jensen (1986) approached this matter from agency problem and states that mergers and acquisitions are both evidence of agency problem between shareholders and management of bidder company, and also it is a solution to the issue. M&A is certain option to allocate available cash versus distributing to share owners. So, according to theory, management who has vacant borrowing competence and available cash flows can prefer cash payment even if M&A is value-destroying possibilities for the company. They also argued that stock financing methods generate less benefit those accomplished through the cash financing method. Because stock financing methods are generally utilized in case of large growing opportunities of acquired firm and lack of free cash flow.
21
Martin (1996) supported Jensen’s arguments through their logistic regression analysis. They used the cash value variable to evaluate the bidder company’s capability to proceed cash for acquired company. Calculation of cash value is the cash level plus bonds in year-end balance sheet divided by total purchase price paid. Their result showed that cash-value variable is significant at 5% level in their regression for cash payments which means that if cash level at acquiring company compare to acquisition amount is high, bidder company’s management reluctant to use share exchange for the acquisition.
Another concept is financial leverage, refers to buying an asset through debt financing. High financial leverage means using more debt to finance the acquisition, however, it also has a risk of failure in case of an excessive amount of leverage. In cash-based acquisitions, cash transaction is generally funded via debt, which tends to increase financial leverage, whereas, in stock-based acquisitions, the transaction tends to decrease financial leverage.
Trifts (1991) observed the impact of financial leverage on payment methods in transactions. They examined a total of 122 samples of completed acquisition from 1970 to 1985 in the USA with regard to all cash and all stock payment deals. Their results showed that as the expected high proportion of cash payment acquisitions (two-third of the cash samples) decrease financial leverage and the majority of stock-based payments increase leverage (three out of five).
A more recent and supportive study published by Uysal (2011) who analyzed the relation between acquisition payment methods and corporate leverage levels. They defined overleveraged as the firm has an excessive debt level, whereas underleveraged is just the opposite of low debt level in the firm. They found that overleveraged bidder companies have lower premiums and reluctant to propose cash in acquisitions and prefer stock exchange, while underleveraged companies are more likely to offer cash, and avoid share exchange.
CHAPTER 2
2. LITERATURE REVIEW
Most of the papers in the literature have focused stock performance of both acquiring and target firms when they announce M&As based on payment method especially for the
22
USA and UK. For Turkey, I could not find related papers analyzing the impact of method of payments in M&As, instead I decided to cover the papers regarding to abnormal returns when M&A announcement made in more general perspectives, regardless of payment method.
2.1. Return to Shareholders of Acquiring and Target Companies
Next section, I have tried to summarize different aspects, which analyzed and implemented by different authors at different timelines about how payment methods affect related parties’ stock performance in M&As from the USA and UK.
2.1.1. Examples from the World
Huang and Walking (1987) researched target firms’ return following the transaction announcement made. They analyzed the deals between April 1977 and September 1982 from the USA with a total sample of 204 regarding acquisition types and form of payment. They created three-section, and each of them included three or four more subsections as well. They defined acquisition types as a merger, tender offer and not disclosed; method of payments as cash, mixed, stock, and not disclosed and lastly target management’s attitude as resisted, friendly and not disclosed. Their time interval was from -50 day to +50 day around the announcement date. They found that in the cash payment method, the target firm’s average cumulative abnormal return is 29%, whereas share payment return is almost half of the cash payment return. For the mixed payment, the return is 23%. Besides, they argued that when the parties do not disclose their payment methods, the average cumulative abnormal return of acquired companies is around 15%, that is the almost same level as the stock payment method. They also showed the abnormal return differences among cash and share is 12.2%, and t-statistics is significant 3.97. Finally, they concluded that the cash-based deals provide more return to acquired firm’s equity holders against other payment methods.
Travlos (1987) analyzed 167 deals in the USA from 1972 to 1981. All deals are divided into three categories according to payment methods. Transactions are fully financed by either exchange of cash, stock or mixed payment. They calculated average daily and cumulative abnormal returns of acquiring firms for the period between -10 to +10 days in accordance with announcement day. It is appeared that there is not positive impact if stock
23
financing preferred. Abnormal return one day before the announcement is -0.78%, which is significantly different from zero at 1% level, and on the announcement day, the abnormal return is again -0.69%, which is again is significantly different at the same level. Whereas, acquiring companies which prefer cash, experience average normal returns. For instance, average abnormal return is 0.29% on announcement day, that is statistically insignificant at 5% level. On the other hand, average abnormal return is -0.05% one day before announcement, that is again insignificant.
They also looked at the relationship between merger proposals and tender offers while comparing each other when there is a different payment method in the transaction. Tender offers differentiate itself from merger proposals through the acquiring company directly reach out to shareholders of the acquired firm and propose an offer to the shareholders instead of reaching the target’s management. In this way, purchasing stock directly from shareholders provide a shortcut in such bypassing executive management and board of directors of acquired firm. They found that stock exchange offers in both merger proposals and tender offers associated with negative abnormal returns. The daily mean of average abnormal returns for -1 day to 0 is -0.82% and -1.02% respectively in a combination of cash and stock payment method, which are significant at 1% level. Moreover, daily mean of average abnormal returns for a combination of payment methods is 2.88% in tender offers, which is significant at 1% level in the same time period, with a z-score of 4.34. These results show that different results occur in different payment methods for mergers and tender offers.
The final study conducted by them was about a comparison of successful and unsuccessful takeover bids with regard to different payment methods. They distinguished unsuccessful bids through if the acquired company survives as a separate entity and bidder firm abandons its takeover bids and fails to acquire an interest in the target company’s equity (more than 20%) for one-year period following the initial offer. They analyzed 64 unsuccessful takeover attempts for the period 1973 to 1982. While 47 of the total sample was cash payment, 12 stock payment and the rest were the combinations of both. They looked at -5 to +5 day around the announcement day. In unsuccessful bids and stock payment method, abnormal return on the day prior to the announcement of takeover attempt is -1.92%, which is significantly different from zero at the 1% level and z-score is -3.74. Moreover, on the
24
announcement day, abnormal return is -2.09%, which is again significant at the 1% level and z-score is -3.69. On the other hand, for the same periods in cash offers, corresponding average abnormal returns are 0.14% and z-score is 0.22, and 0.31% and z-score is 1.09 respectively, which are also insignificant at different levels. Consequently, apart from successful takeovers, in stock payment methods, the abnormal returns are associated with negative results compare to cash payment methods.
Another research published by Wansley, Lane and Yang (1983), who researched transactions between January 1970 and December 1978 and analyzed 203 acquiring firms in corresponding dates. They looked not only payment method in M&As but also merger types as well. They defined merger types in three different forms; nonconglomerate, pure conglomerate and other conglomerate. Conglomerate means a corporation, which has unrelated business operations to each other. It holds controlling stakes of smaller companies, which operate different sectors. They specified their time intervals -40, +40 days around the announcement date. They only evaluated cash payment method when comparing merger types, find that pure conglomerates perform better than other types at announcement and following day. Numerically, abnormal return of announcement effect of pure conglomerates is 14.16%, whereas, nonconglomerates perform 10.22%. However, in each scenario, the findings are not significant at 1% level.
They also assessed different payment methods in conglomerate M&As. In cash-financed M&As, cumulative average abnormal return is 33.54%, that is significantly greater than share exchange (17.47%) and mixed payment methods (11.77%). They pointed out that, the performance of cash-financed exceeds others. T-statistic for daily mean differences is 2.49 and 1.84 for stock and mixed payment respectively, which are statistically significant at 1% and 5% level.
Andrade, Mitchell, and Stafford (2001) published the research which constituted 3,688 transactions from the period 1973 to 1999 in the USA. They analyzed the impact of the method of payments in three-day announcement periods. In stock finance deals, bidder firms have negative cumulative abnormal returns of -1.5%, but, the firm which prefers cash financing in the transactions, have cumulative abnormal returns of 0.4% which is statistically insignificant. Thus, target firms perform better in cash financing methods compare to stock
25
financing. They observed that CAR for acquired is 20% in cash financing. However, in stock financing deals, the return decrease to 13% and both are statistically significant at the 5% level.
Another three-day CAR calculation for payment methods is published by Fuller and Glatzer (2003). They collected a total sample of 328 takeovers from the USA between January 1, 2005, and December 31, 2001. They reviewed cross borders deals, in which bidder firms originated in the USA and listed on NYSE, NASDAQ or AMEX and acquired firms are from the rest of the world. Some deals are chosen where bidder company buys at least half of target companies’ stakes and pays 1 million US dollars or more for corresponding shares. They grouped payment methods and listing positions of target companies into two or three categories: cash and stock, and public, private and subsidiary of main entity respectively. They found that bidder companies that acquire public targets, experience statistically negative CAR of 0.54% for 3-day period around the announcement date, whereas, statistically positive of 0.71% and 1.67% for private target companies and subsidiaries respectively regardless of payment method. However, if the acquired company is listed and cash is used, acquiring’s returns are insignificant. In the stock payment method, the return is negative and significant 1.51%. CAR is positive and significant 1.38% when the cash payment method is used for private target firms and negative and insignificant -0.22% for stock payments. In addition, in subsidiary acquisitions, the acquiring firms’ returns performed positive significant return of 2.07% when cash used however insignificant and negative return -0.21% for stock payment methods. They also applied multivariate regression and confirm that bidder firms that offer stock payment in M&As have significantly lower returns compared to the other companies which prefer cash payment.
On the contrary, Chang (1998) found different results from the above authors. They analyzed USA bidding firms, which paid at least 10 million US dollars for the purchase price to the target company and did not operate in financial sectors. They created subgroups based on publicly traded situation of acquired company and divide them based on public and private situations. Their sample was 281 takeovers in which consist of 131 cash, 50 mixed and 100 stock based payments for private target companies between 1981 and 1992. For public target companies, 255 merger proposals were collected, 101 of mergers were cash payments and
26
the rest were stock payments. There were no mixed payments in public target companies. They analyzed average abnormal return for acquiring companies’ return from one day earlier to announcement and observed statistically significant at 5% level and found that for private target companies and cash payment method, bidder companies earn 0.09% average abnormal return (t statistics = 0.34), which is statistically insignificant. However, in stock payment, bidders have a statistically significant return of 2.64% (t statistics = 7.49). In addition, the cash and stock bidders’ median abnormal returns are -0.18% and 0.89% respectively.
Other than private companies, they probed the abnormal return of bidder firms when they acquire public companies. Thus, in cash payment method, the bidder performs insignificant average abnormal return of -0.02% (t-stat = -0.06) and for stock payment, acquiring companies earn a significant -2.46% average abnormal return (t-stat = -9.85). Cash and stock bidders’ median of abnormal returns are -0.17% and -2.02% respectively.
Correspondingly, Draper and Paudyal (2006) published similar research like Chang’s (1998) study. They analyzed the payment method’s impact and target companies’ status in M&As for bidder firms. Their sample was completed deals among 1981 and 2001 in the UK, both bidder and acquired companies was domiciled, and publicly traded in UK stock exchange (London Tech, AIM, USM and LSE). In their sample, cash financing bids were 4,663 and stock financing bids were 726. They researched buy-and-hold excess returns using two asset-pricing models, which are the capital asset pricing model (CAPM) and Fama-French three-factor model (3-factor) and analyze 5% and 10% significant levels. They also divided holding periods into four category, pre-event (-2, -20), around event (-1, +1), post-event (+2, +20) and entire post-event (-20, +20).
In all bidders (which acquired listed and private target firms), pre-event and entire event returns are equal to 1.29% and 2.93% respectively and statistically significant in share payment method compare to cash payments. However, around the event period, cash returns are higher and significant at 5% level. For listed target firms, bidder companies’ pre-event returns 2.13% much higher in stock exchange and statistically significant at 5% level. Nevertheless, acquiring’s returns are negative and insignificant in the rest of holding periods. On the other hand, all holding period returns are sensitive and insignificantly negative in cash payment method. In bidders for private target firms, the returns of both cash and share