щ
α ψ
S f ^ ^ c V í ^ LШ Ь
C R O S S-S.-
2C~T-JL^^^:,A /^LY S!S
t o£S1ΓAІ.^0Ê/2JL STOvci
— «vOî . RàCST'
ж~^ a
li'¿\£€Q 'u-w u n « -, 'o-’U u Ù 4¿i it Û
APPLICATION OF SPECTRAL AND CROSS-
SPECTRAL ANALYSIS TO ISTANBUL STOCK
EXCHANGE MARKET
A Thesis
Submitted to the Departments of Economics
and the Institute of Economics and Social Seciences of
Bilkent University
MASTER OF ARTS IN ECONOMICS
Cüneyt Altan ERİGÜÇ
September 1995
Hß
e > 5 ^ З Ь 5
I certify that I have read this thesis and in my opinion it is fully adequate, in scope and quality, as a thesis for the degree o f Master o f Arts in Economics.
Assist. Prof Dr. Faruk Selçuk
I certify that I have read this thesis and in my opinion it is fully adequate, in scope and quality, as a thesis for the degree o f Master o f Arts in Economics.
Assist. Prof Dr. Os
I certify that I have read this thesis and in my opinion it is fully adequate, in scope and quality, as a thesis for the degree o f Master o f Arts in Economics.
r
Assist. Prof Dr. Erol Çakmak
ABSTRACT
APPLICATION OF SPECTRAL AND CROSS-SPECTRAL
ANALYSIS TO ISTANBUL STOCK EXCHANGE MARKET
Cüneyt Allan ERİGÜÇ
MA in Economics
Süpervisor: Assist. Prof. Faruk Selçuk
September 1995
In this study, stock exchange index and selected four securities Ege Gübre, Bağfaş, Adana Gübre and Tüpraş from Istanbul Stock Exchange Market were analyzed with spectral and cross-spectral methods. Consumer price index was used to find the real values o f securities. First o f aU, spectral analysis was apphed to be able to find periodicity o f securities and significant periodicities were foimd for these four o f them. Cross-spectral analysis was then apphed between stock exchange index and four o f these securities, each pair displayed statistically significant coherencies, the lead and lag relationships o f certain frequencies were found from phase difference values o f significant coherencies.
Key Words
! Time Series and Spectral Analysis, Seasonahty, Econometric Methods; Single Equation Models:Time Series models. Periodicity, Cross-spectral Analysis.ÖZET
İSTANBUL MENKUL KIYMETLER BORSASI’NA
SPECTRAL ve CROSS-SPECTRAL ANALİZLERİNİN
UYGULANMASI
Cüneyt Altan ERİGÜÇ
Yüksek Lisans Tezi, iktisat Bölümü
Tez Danışmanı: Doç. Dr. Faruk SELÇUK
Eylül 1995
Bu çalışmada, borsa endeksi ve İstanbul Menkul Kıymetler Borsası’ndan seçilen dört hisse senedi, Ege Gübre, Bağfaş, Adana Gübre ve Tüpraş olmak üzere, spectral ve cross- spectral metotlarıyla analiz edildi. Hisse senetlerinin reel değerlerini bulmak için tüketici liat endeksi kullanıldı. Önce hisse senetlerinin periyodunu bulabilmek için spectral analiz uygulandı ve dört hisse senedinin anlamh periyotlan bulundu. Daha sonra borsa endeksi ve dört hisse senedi arasmda cross-spectral analiz uygulandı, her çift istatistiksel olarak anlamlı tutarhlıklar gösterdi ve her bir hisse senedi ile borsa endeksi arasmdaki faz farklan bulundu.
A n a h t s r K e lİ m e İ6 r ! Zaman Serileri ve Spectral Analiz, Cross-spectral Analiz,
ACKNOWLEDGEMENTS
I am grateful to Assist. P rof Dr.Faruk Selçuk for his supervision and guidance throughout the development o f this thesis and would like to thank Assist. P ro f Osman Zaim and Assist. P rof Dr. Erol Çakmak for their valuable comments and suggestions which contributed to the improvements o f this study.
I finally and especially would like to thank my dear w ife, F. Meltem Erigüç for her helps and encouragements.
CONTENTS
1. Introduction
2. Theory o f Spectral and Cross-spectral Analysis
2.1. Origin o f Spectral Analysis
2.2. Periodogram Methods
2.3. Cross-spectral Analysis
2.4. Test o f Significance
2.4.1 Test o f Significance o f Jumps (W hittle-Fisher Test)
2.4.2 Test o f Significance o f Coherence (Fuller Test)
3. A pplication o f Spectral Analysis and Cross-spectral A nalysis to the
Istanbul Stock Exchange Market
3.1. Data
3.2. Empirical Results o f Periodogram Analysis
3.3. Empirical Results o f Cross-spectral Analysis
3.4. Results o f Significance Tests
3.4. Results o f Significance Tests
4. C onclusion
APPENDICES
A PPEN D IX A
I. N om inal Prices o f Selected Securities and Index
Graph 1. Nominal Istanbul Stock Exchange Index (18.09.90 - 31.10.94)
Graph 2. Nom inal Prices o f Egegübre (18.09.90 - 31.10.94)
Graph 3. N om inal Prices o f Bağfaş (18.09.90 - 31.10.94)
Graph 4. Nom inal Prices o f Adana Gübre (18.09.90 - 31.10.94)
Graph 5. N om inal Prices o f Tüpraş (03.06.91 - 31.10.94)
II. Real Prices o f Selected Securities and Index
Graph 6. Real Istanbul Stock Exchange Index (18.09.90 - 31.10.94)
Graph 7. Real Prices o f Egegübre (18.09.90 - 31.10.94)
Graph 8. Real Prices o f Bağfaş (18.09.90 - 31.10.94)
Graph 9. Real Prices o f Adana Gübre (18.09.90 - 31.10.94)
Graph 10. Real Prices o f Tüpraş (03.06.91 - 31.10.94)
A PPE N D IX B
I. Spectral Plots o f Selected Securities and Index (Nom inal)
Graph 11. Spectral
Graph 12. Spectral
Graph 13. Spectral
Graph 14. Spectral
Graph 15. Spectral
Graph 16. Spectral
Graph 17. Spectral
512/7
Graph 18. Spectral
Graph 19. Spectral
P eriod:512/l
Graph 20. Spectral
Plot o f Index in the log scale.
Plot o f Ege Gübre in the log scale.
Plot o f Bağfaş in the log scale.
Plot o f Adana Gübre in the log scale.
Plot o f Tüpraş in the log scale.
Plots o f Index and Sine Wave w ith Period: 1024/14
Plots o f Ege Gübre and Sine Wave w ith Period:
Plots o f Bağfaş and Sine W ave with Period: 512/7
Plots o f Adana Gübre and Sine W ave with
1
Graph 23. Time Domain graph o f Bağfaş and Sine Wave with
Period; 512/7
Graph 24. Time Dom ain graph o f Adana Gübre and Sine W ave with
Period: 512/11
Graph 25. Time Domain graph o f Tüpraş and Sine W ave with
Period; 512/8
I. Spectral Plots o f Selected Securities and Index (Real)
Graph 26. Spectral Plot o f Index in the log scale.
Graph 27. Spectral Plot o f Ege Gübre in the log scale.
Graph 28. Spectral Plot o f Bağfaş in the log scale.
Graph 29. Spectral Plot o f Adana Gübre in the log scale.
Graph 30. Spectral Plot o f Tüpraş in the log scale.
Graph 31. Spectral Plots o f Index and Sine Wave with Period: 1024/14
Graph 32. Spectral Plots o f Ege Gübre and Sine Wave with
Period; 1024/14
Graph 33. Spectral Plots o f Bağfaş and Sine Wave with Period: 1024/14
Graph 34. Spectral Plots o f Adana Gübre and Sine Wave with Period:
1024/13
Graph 35. Spectral Plots o f Tüpraş and Sine Wave with Period; 851/13
Graph 36. Time Domain graph o f Index and Sine W ave with
Period: 1024/14
Graph 37. Time Domain graph o f Ege Gübre and Sine W ave with
Period: 1024/13
Graph 38. Time Dom ain graph o f Bağfaş and Sine Wave with
Period: 1024/14
Graph 39. Tüne Dom ain graph o f Adana Gübre and Sme W ave with
Period: 1024/13
Graph 40. Tüne Domain graph o f Tüpraş and Sine Wave with
Period; 851/13
APPENDIX C
Graph 41. Coherence o f Ege Gübre and index with real prices
Graph 42. Coherence o f Bağfaş and index with real prices
Graph 43. Coherence o f Adana Gübre and index with real prices
Graph 44. Coherence o f Tüpraş and index with real prices
Graph 45. Phase difference o f Ege Gübre and index with real prices
Graph 46. Phase difference o f Bağfaş and index with real prices
Graph 43. Coherence o f Adana Gübre and index with real prices
Graph 44. Coherence o f Tüpraş and Index with real prices
Graph 45. Phase difference o f Ege Gübre and Index with real prices
Graph 46. Phase difference o f Bağfaş and Index with real prices
Graph 47. Phase difference o f and Adana Gübre índex with real prices
Graph 48. Phase difference o f Tüpraş and index with real prices
a p p e n d i x
D
Graph 49. Spectral Plots o f K oç H olding and Sine W aves with
Periods:566/8 and 566/22
Graph 50. Time Dom ain graph o f K oç H olding and Sine W ave w ith
Period:566/8
Graph 51. Time Dom ain graph o f K oç H olding and Sine W ave w ith
Period;566/22
1. Introduction
Stock exchange market has an important role in tlie process o f distribution o f capital to different agents and capital allocation in tlie economy. With the stock exchange market, the ones who need capital can supply their needs by issuing secmities and the ones who has capital try to be a partner o f the firms by buying seciuities o f these firms.
In the stock exchange market, prices o f securities are formed with the demand and supply o f investors. For that reason, prices are not stable and they are oscillating ui the form o f cycles according to demand and supply. Some o f the investors, called speculators, try to create benefits fi'om these oscillations. Their main aim is to buy securities with decreasing price trend and sell securities with increasing price trend in the short run. So that, they automatically prevent the high increases and decreases in the market by equilibrating demand and supply.
Therefore, cycles o f the prices o f securities, due to the demand and supply o f equihbrating forces are inevitable. Cycles o f different periodicities can be identified in the stock exchange market. Sometimes, these cycles are in the form o f seasonal cycles in the long run for som e securities o f the firms related with some special products, such that their consumption (e.g. beer, fertilizers, iron, cement) sensitive to seasons (then- price generally increases in the summer and decreases in the winter) . Some cycles represent more effects o f large financial firms in the short run relative to seasonal cycles, and finally the most important, some o f them occurs just because o f the general trend o f stock exchange market. For example, in 1994, with the financial crisis and reccesion, index o f the stock exchange which reflects the general trend was the decline.
In this paper, with the spectral analysis methods, frequency domain analysis are employed to find periodicities o f the prices o f securities, coherence and phase difference o f the securities with the index. We can take this analysis as a kind o f technical analysis dealing with price movements o f the securities.
Sumlar methodological approaches have also been apphed by other authors. Some examples o f spectral analysis are: Bartels, Booleman, Peters (1977) about spectral analysis o f regional unemployment series, Rosenthal (1986) about cross- spectral analysis o f regional house price interactions in the UK, Dunn (1982a, 1982b) about spectral analysis geographical studies o f local unemployment and Barras and Ferguson (1985) about spectral analysis o f building cycles. However, there is no paper about spectral analysis o f securities and stock exchange markets in the hterature.
The paper starts with a brief explanation o f two spectral analysis methods, periodogram analysis and cross-spectral analysis in the section 1. In the section 2 o f the paper, w e will discuss the data and methodology adopted in the study. In the section 3 and 4, w e will see the empirical results o f the periodogram analysis and cross-spectral analysis, and finally section 5 will be the conclusion part.
2. Theory o f Spectral and Cross-spectral A nalysis
2.1. Origin of Spectral Analysis
The Fourier theory o f sine wave analysis o f functions has its origins in two fields o f investigation into the nature o f physical world: acoustical/optical wave phenomena and astronomical and geophysical periodicities. These two fields have furnished the primary stimuh from the natural sciences to the classical study which extends into the first half o f the twentieth century o f spectral analysis. The motions o f the planets, the tides and irregular recurrances o f weather with their hidden periodicities and disturbed harmonics, form a counterpart o f vibrating string in acoustic and phenomena o f hght in optics. Although the concept o f sine wave analysis has very early origins, the first important studies did not occur until the eighteenth century, with the work o f Leonhard Euler (1707-1783) and Joseph Louis Lagrange (1736-1813) in Astronomy.
The concept o f statistical spectral analysis developed with the early studies o f hght, begiiming with Isaac Newtons prism experiment in 1664 which led to the notion that white hght is simply an additive combination o f homogenous monochromatic vibrations. The developing wave optics ideas, together with developing ideas fi'om meteorology and astronomy, led Sir Arthur Schuster (1851-1934) to the invention o f the periodogram for apphcation o f the problem o f hidden periodicities in random data (Schuster 1894, 1897, 1898, 1900, 1904, 1906, 1911). The periodogram denoted by Sxi (f) is simply the squared magnitude o f the Fourier transform o f a finite segment o f data, xt normalized by the length , T, o f the data segment.
xi{f) =
f
xr(t)exp(-j2Tcft)dt, -^/2where xx(t) is taken to be zero for |t| > ^/o. If a substantial peak occured in the periodogram, it was beUeved that an underlying periodicity o f the j&equency at which the peak occured had been detected . As a matter o f fact, this idea preceded Schuster in the work o f George Gabriel Stokes (Stokes 1879) and related approach to periodicity detection developed for meteorology by Christoph Hendrik Buys-Ballot preceded Stokes (Buys-Ballot 1847). The first general development o f the periodogram is attributed to Eugency Eugenevich Slutsky (Slutsky 1929, 1934).
Another approach to detection o f periodicities being used in m eteorology in the early part o f the twentieth century was based on the correlogram, (Clayton 1917; Alter 1927; Taylor 1920, 1938) whose earhest known use (Hooker 1901) was motivated by the studies in econom ics o f John Henry Poynting (Poynting 1884). The correlogram, denoted by Rxt(t) is simply the time average o f products o f time shifted versions o f a finite segment o f data.
RXt~ Vt
f
XT(t"tV2) XT(t-V2)dtBut since xi(t + V2) and Xjit -V2) is zero for t + V2 and t - V2 outside [ -^/2, ^/2 ] , we obtain
Cr-M)/2
Rxt=
V
t/ Xr(t+V2) XT(t-72)dt. -Cr-№/2If an oscillation with t occured in the correlogram, it was beheved that an underlying
The discovery o f the periodogram-correlogram relation (Stum pf 1927; Wiener 1930) revealed that these tw o methods for periodicity detection were, in fact the same. The relation, which is a direct consequence o f convolution theorem, Sxt(.) and Rxt(.) are a Fourier transform pair,
S xT (f) = F { R x x ( t ) }
The developments in the area o f spectral analysis continued with a new smoothing and averaging technics by Albert Einstein (Einstein 1914), Norbert Wiener (Wiener 1930) and later by Farcy John Daniel (Daniel 1946), Maurice Stevenson Bartlett (Bartlett 1948, 1950), Jolm Wilder Tukey (Tukey 1949), Richard W esley Hamming and Ralph Beebe Blackman (Blackman and Tukey 1958).
Then, the development o f statistical mechanics and the studies o f Henri Leon Lebesque around the turn o f centuiy, led ultimately to the probabhstic theory o f stochastic processes. This theory includes a probablistic counterpart to Wieners theory o f generaUzed harmonics analysis, in which infinite time averages are replaced with infinite ensemble averages. It greatly enchanced the conceptualization and mathematical modelling o f erratic data sources and the design o f statistical data processing technics such as spectral analysis. The theory o f * (for discreate time processes) originated in the work o f Aleksandr Iakovlevich Khinchin during the early 1930*s (1934) and was further developed in the early stages by Wold (Wold 1938), Andrei Nikolaevich Kohnogrov (Kohnogrov 1941) and Herald Cramer (Cramer 1940, 1942). The major contributions to the probabUstic theory and methodology o f statistical spectral analysis were made by U lf Grenander and Murray Rosenblatt (Rosenblatt 1953, 1984), Emanual Parzen (Parzen 1957).
A general problem o f spectral estimation is determizing the spectral content o f a random process based on a iSnite set o f observations jfrom that process. Formally, the power spectral density denoted by Pxx(f) o f a complex wide sense stationary (W SS) random process x[n] is defined as ,
oc
Pxx(f) - T j rxx[k]exp(-j27ifk) ‘'/2 < f < '/2 k = -oc
where rxx[k] is the autoconelation function (ACF) o f x[n] defined as, rxx[k] = E (x[n]x[n+k])
As it can be easily seen, the cross spectral density is a sum o f weighted sinusoidal functions called spectral components. Since there is a sumation o f weighted sinusoidal fimctions, w e can find the hidden periodicities in random data. The peak point o f Pxx(f) give us the fi'equencies, where periodicities occur.
In fact, the problem o f studying hidden periodicities in random data motivated the earhest work in spectral analysis and provided with much o f the impetus for developing spectral analysis concepts and methods during the first few decades following Schuster’s pioneering work. However, the fact that most o f the phenomena being studied did not exhibit periodicity, but rather gave a rise to data consisting o f what came to be called disturbed harmonics (which result from subjecting a completely random time series to a narrow-band-pass filter) resulted in a major shift in focus away from hidden periodicity and toward the time invariance. Although existing theory and methods are usually adequate for additive periodic components in random data, this is no generally appropriate theory and method for other types o f hidden periodicity. The
lack o f development o f theory and method for spectral analysis o f such time series was recognized exphcitly by Blackman and Tukey (Blackman and Tukey 1958) who indicated by arguing that no phenomenon is precisely periodic and that existing theory and method appear to be adequate.
However, after Blackman and Tukey, a number o f authors have claimed that many phenomena are indeed appropriately taken as periodic and have contributed to the development o f probabilistic models and methods o f analysis for random data from periodic phenomena o f called cyclostationary stochastic processes, such as research o f Gardner and Franks(1975), Gardner(1978), Boyles and Gardner(1983), Gardner(1985).
2.2 Periodogram Methods
In constrast to recent developments, in this paper, I found the nonprobabilistic approach to be more amenable to the development o f an intuitively satisfying as w ell as comprehensive theory, since it avoids conceptual comphcations due to unnecessary abstractions associated with the probabilistic approach.
In this essay, w e will try to find the estimator o f the power spectrum* o f a random signal using the FFT” method. As w e have seen, there are two basic approaches for estimating power spectrum. The first approach is referred as periodogram analysis and is based directly on direct Fourier transformation o f finite
^ The term power spectrum is commonly used inter changeably the more precise term power density spectrum.
~ DFT is identical to samples o f the Fourier Transform at equally spaced frequencies. Consequently, computation of the N point DFT corresponds to the computation of N samples o f the Fourier transform ay N equally spaced frequencies, w t = n- Collection o f algorithms, that are used for computation of
length segments o f tbe signal. The second approach is to first estimate the autocovarience sequence and then compute the Fourier transform o f this estimation.
In either case, w e are typically interested in obtaining unbiased consistent estimators. There were different types o f periodograms depending on the window apphed, equations derived before represent normal periodogram, infact general formula for periodogram can be written by for discreate data,
1(f) = VL|V(f)|' where
L-1
V (f) = S w[n]x[n]exp(-j27tfk) ‘ V. < f < ‘A.
n = 0
'fhe window w[n] selects a finite length s^ments (L samples) of x[n], which is denoted as v[n], when window w[n] is rectangular window sequence, this estimator for the power spectrum is called the normal periodogram. If the window is not rectangular, it is called the modified periodogram. The periodogram has some o f the basic properties o f power spectrum. Furthermore, it can also be written.
L-1
1(f) =Scw [m ]exp(-jw m ) 'Va < f < '/2 where
m = -(L-l)
L-1
Cw [m] - S w[n]x[n] w[n+m]x[n+m]
m = 0
here, the sequence Cw [m] is the correlation sequence for finite length sequence v[n] = x[n].w[n].
If a random signal has a nonzero mean, its power spectrum has an impulse at zero frequency. If the mean is relatively large, this component will dominate the spectrum estimate, causing low amplitude, low frequency components to be observed
by leakage. Therefore, in practice the mean is often estimated, then resulting estimate is subtracted from random signal before computing the power spectrum estimation^.
Another important thing in the computation o f modified periodograms is the apphcation o f the data windows, in general, without data windowing a lower level signal may be masked by the sidelobes o f a higher level signal if the signals are close in frequency. Data windowing will reduce the magnitude o f the periodogram at frequencies not near signal frequency at the expense o f iacreasing the bandwith o f the mainlobe. Main windows, that is used in this survey, are Bartlett, Hamming and Blackman.
(BA RTLETT or T R IA N G L E W IN D O W )
M'f) =
0, I't I > / 2
(H A M M IN G or R A ISE D C O SIN E ON A PLA TFO R M W IN D O W )
'^rrf T / 0.54
+
0.46 cos(”/
TX
I I -
' 2 h(x) 0,T I > ^ ! 0
(B LA C K M A N W IN D O W ) h(x) = o>rrt 4Trt 0.42 + 0.50 cos( / T ) + 0.08 cos( / jX
TI <! 1
0
,h I >
/ 2
Infact, classical periodogram given the equation ( ) is not consistent estimator since variance o f the periodogram does not asymptotically zero, even window length increased. Tonkins and Watts showed that, over a wide range o f conditions, as the window length increases,
Nonetheless, with some averaging technics, Welch (1970) developed a method with the use o f a data window. In periodogram averaging, a data sequence x[n], 0 < n < Q - l is divided into segments o f length L samples, with a window length L appUed to each, such as
X r[n] = x[rR + n] w[n] 0 < n < L - l .
If R < L segments overlap, and for R = L segments are contiguous. The total number o f segments depends on the values and relationship among R, L, and Q. Specifically, there will be K full length segments where K is the largest integer for which
( K - 1)R + ( L - 1 ) < Q - 1. The periodogram o f the rth segment is Wf) = VL|X,(f)^
X r[n ] = x[rR + n] w[n] 0 < n < L - l .
Each I r ( f ) has the properties o f the periodogram , then average periodogram
consists o f K periodogram estimates Ir(f) and defined as
K-1
1 ( f ) - ‘/kE u i) r - 0
One o f the main advantage o f this periodogram is its variance var[I(f)] = Vk var [I^f)],
even as the value o f K is increased, variance o f the periodogram can be decreased to 0. But in this case, bias o f the estimator increase. In general, there is a trade o ff between variance and bias o f the estimator.
2.3. Cross-spectral Analysis
spectral analysis decomposes single stationary time series into a number o f cycles sinusoidaly depending on time via the autocovariance series. The power o f each frequency band cycle is given by the contribution it makes to the variance o f the original series. Cross spectral and power spectral analysis work with pairs o f variables (in power spectral analysis these variables are the same) and the analysis, carried out in the frequency domain, may be considered as analogous to a number o f regressions run between the same frequency cycles in the two time series.
The cross-spectral representation o f the relationship between two series is summarized at each frequency by three statistics:
(1) Coherence (C“x(f)). which may be viewed as an R" type measure indicating the closeness o f relationship between the two series at each frequency. We can take coherence between two series as an indicator o f periodicity, such that when C“x(f) close to 1 (when random time series are completely coherent containing maximum mount o f second order periodicity) and when C“x(f) close to 0 (when random time series are completely incoherent containing nunimum amount o f second order periodicity).
(2) Phase or phase difference, which give the amount by which the frequency cycle o f one series is leading the other and is related to the time delay between the two series. Phase can be known only up to adding or subracting an integer number o f cycles
o f the given frequency, and this ambiguity may be only partly offset by consideration the phase diagram as a whole. Phase is normally expressed in frequency terms as degrees or radians; but the time domain equivalent may be determined and has been
, phase /
termed x - /
2-nf-(3) Gain, which may be viewed as analogous to the absolute value o f the regression coefficient for each decomposed frequency cycle pair or how one amphtude
is translated into the amphtude o f the other.
We can test relationship between two sequence x(t) and y(t) by coherence measure, limit cross corelations sre defrned
T/2
R“yz('t^) = lint Vt X yit+V:] z[t-V2]. T->oc t = -T/2
T/2
R"z(t) = hm Vt Z zit+V.j zit-V.]. T ^ o c t = -T/2
T/2
R“y(x) = lim Vt Z yit+V.J yit-V.]. T-).oc t = -T/2
Corresponding limit cross spectrums can be obtained such as S“2y(f) = F (R “zy(·)} and
limit spectra o f y(t) and z(t) are S“z(f) = F{R “z(·)} and S“y(f) = F (R “y(.)} then
complex coherence function for y(t) and z(t) is given by.
s zy(f) Czy = ■
[ S z ( f ) S y ( f ) ] 1/2
S“2y(f) “ Ajry(f) + iB2y(f) from this equation phase difference can be found as like
Ozy(f) = tan'
Bzy(f)
for only statistically significant coherencies'*, phase difference is important for us y[n] and z[n] contains corelation if and only if the parameter,
T/2
R"x
(
t)
= R“yz(T) = lim*/
tS y[t+^/2] z[t-V2] exp(-j27tat). T-^oc t = -T/2exists and is not identically zero as a fimction o f
x.
2.4. Test of Significance
2.4.1 Test o f Significance o f Jumps
Various statistics have been suggested for testing the significance o f particular cyclical components identified by spectral analysis. One o f the most commonly used is Fisher’s Kappa Test is derived from the null hypothesis that observations are independent and Gaussian. The Fisher Test is based on ratio o f the maximum value o f die periodogram to its average over all frequencies; the higher the value o f ratio means more likely the alternative hypothesis that a significant cychcal component exist in the series, if w e take the ratio o f the maximum value o f the peridogram to its average as gi, ratio o f the second maximum value o f the periodogram to its average as g2 and so on, w e can order the g ratios as.
'* Since the variance o f the phse difference is proportional to (1- Cyz)/Cyz, where Cyz is the coherency, alow coherency implies a large variance of the phase difference. As a result, the phase difference is only interpretable at high coherencies.
g l > g 2 > g 3 > ... ^ gr ^ ... gm
probability o f gr> x is given as by Whittle^
m! . 1
P( g,> X ) = - - - ( - l y · ' --- ( 1 -jx)'
( i - l ) ! j = r j ( m - j ) ( j - r )
. .m-1
where x is the value o f the jump point that is analyzed over average value o f the periodogram, from this formula, with a given confidence levels such as 95% and 99%, if P( gr > x) < 0. 05 for 95% level or P ( gr > x) < 0.01 for 99% confidence level, significancy o f the peak is satisfied^.
2.4.2 Test o f Significance o f Coherence
As far as cross-spectral anlaysis is concerned, there seems to be more uncertainity about the properties o f the estimators and the most appropriate significance test. However, an F-test proposed by Fuller, related with significance o f the coherence statistics can be used, with 2 and
Ad
degrees o f the form.F
\ ,
-4d C(w) 2 [ 1 - C ( w ) ]
where C(w) is the coherence, and
d
is the spread o f the weighting fimction used to smooth the periodograms.The distribution of the greatest gj was found by Fisher. The derivation for the r th greatest given here is due to Whittle.
3. A pplication o f Spectral A nalysis and Cross-spectral
A nalysis to the Istanbul Stock Exchange Market
3.1. Data
In tliis research, from the EMKB (Istanbul stock exchange market), data o f prices o f four securities and index are used. Securities are Ege Gübre, Bağfaş, Tüpraş and Adana Gübre. For Ege Gübre, Bağfaş and Adana Gübre, prices are selected between 18.09.90 and 31.10.94 (1024 data points for each security). For Tüpraş, price is selected between 03.06.91 and 31.10.94 (854 data points), to make periodogiam analysis, zero padding is apphed (for FFT, powers o f 2 times data such as 256, 512, 1024 is necessary). Spectral analysis method is apphed on both nominal stock exchange prices and real stock exchange prices including nominal and real index values (See the graphs from 1 to 10 in appendix A).
To find real stock exchange prices, consumer price index fi om State Institute o f Statistics (DIE) with the base year 1987 was used, monthly price index values were interploted between the days o f the month linearly, then by dividing nominal price values and stock exchange index with these consumer price index numbers real values were found.
In the data graphs, there are some inappropriate periods, because o f the irregular phase o f the Turkish economy, the first inapproprite period begins with the Iraq-Kuwait War period, in this period volume o f the stock exchange market did not change too much and nominal prices remained nearly stable. The second inappropriate
period occured with 1994 economic crisis and reccesion, in this period, high decreases in the real prices o f securities can be seen from the graphs^. Also the first years o f the Istanbul stock exchange market was excluded fi'om the analysis because o f increasing trend in the prices o f the securities. For these reasons, due to limited available amount o f data, it was very difficult to apply spectral analysis appropriately, for example, to find seasonahty o f the prices o f securities, at least 10-11 years is necessary.
If the mean o f the data has a nonzero mean, its power spectrum has an impulse at zero firequency. Therefore, in the analysis, first o f ah, means o f the securities were estimated, then these means are subtracted fi’om the data. Periodogram analysis and cross-spectral analysis were performed with these data. So that, better estimates o f the frequency domain representatives were found.
The stationarity assumption o f spectral analysis is inJfringed if spectral peak points are formed, this may be because o f several reasons, for example, the data can be characterized by secular trend in the mean or variance. This produces high power at low frequencies, which when smoothing the periodogram can spiU over to distort the spectrum at higher frequencies. In our four examples o f data and stock exchange index, data are oscillating rather than any trend. The stationarity assumption can also be infringed, if strictly periodic components such as seasonal fluctuations are present in the data. This will tend to produce strong peaks in the spectram at certain frequencies which are integer multiples o f the seasonal fi equency.
3.2. Empirical Results of Periodogram Analysis
In the first part o f the research, to prevent the stationarity, at first, means o f the data were found for securities Tüpraş, Ege Gübre, Bağfaş and Adana Gübre and stock exchange index, then by subtracting means fi'om data, original test data were found. With the peridogram analysis, first o f aU, without any fidtering, spectral graphs with logarithmic scaling were ploted against angular frequency. Since side peaks are very high compared the main peaks, to supress side peaks, Hamming, Blackman and Hanning windows were apphed (inside the Welch Algorithm), m value, the number o f lags in the estimated autocovariance function, the spectra o f the prices o f stock exchange securities estimated with m=64, m=128, m=256 and m =128 provides a much finer picture. The improvement in resolution obtained by moving to m =256, is not great, and with m -2 5 6 , the "7t ratio reaches 0,25 and approaches the point at which the variance o f the estimates becomes unconfortably large*. On the basis o f these reasons, m=128 is used for the calculation o f all subsequent spectral and cross-spectral statistics discussed in this paper. With filtering, spectral plots became more smoothed and side peaks were supressed, comparison o f the two spectrum shows that, the spectrum without fidtering contains much less resolution and it appears that, a series problem o f leakage blurs the form o f the spectrum. The filtered, in which the problem o f leakage should be much reduced shows much better resolution and side peaks o f the main peaks are supressed.
Although, the pattern o f statistics across the frequency range is important, most interest is usually placed on the statistics in those fi’equency bands where power is
* With m =128, m/T = 0.125 smaller than the ratio 1024/3 as suggested by Granger and Newbold (1977) for efficient estimation o f power spectrum at the risk of some bias.
concentrated, in most econom ic time series, this will be the lowest frequencies, in our analysis, main peaks also occur at the lowest frequencies. Then from graphs, peak points are selected and graphs o f the peak points in the normal scale was plotted. To find frequency o f the cycles, sinusoidal waves with a formula spectral plots o f sinusoidal waves were plotted on the same graphs, since spectral plot o f sine wave is in the form o f impulse at frequency o f tlie sinus wave in the frequency domara. Main aim was to intersect both peak o f the spectra o f stock exchange signal and sinus wave, so that the frequency o f the intersection point show us the frequency o f the stock exchance cycles. As it can easily seen from spectral graphs, frequency o f the stock exchange securities change between 12 and 14 for 1024 points, so period is between 1024/12 and 1024/14, for Tiipra§, frequency was founded as 8 for 512 data points, then periods were calculated as 512 / 8.
The same procedure also apphed to the reaf stock exchange signals and nearly die same frequencies were found, then in the time domain, stock exchange data and sinusoidal signals with the same frequency were plotted, from these plots, it can be seen that, if the phase o f the sinusoidal waves was arranged suitable, sinusoidal waves would intersect stock exchange data at the same periods with som e neghgable exceptions as shown in the graph 36. Exception points in all the graphs coincided with die time o f Gulf War.
Another important thing, that may be found from periodogram analysis is, in the this part, w e deal with main spectral peak o f eveiy selected security at the spectral plots. Infact, in the logarithmic plots o f the spectra as shown in the graphs numbered from 11 to 40, they are other side peaks, they may show the subperiodicities under
Real stock exchange signal was founded dividing nominal values o f the stock exchange by linearly interploted consumer price index over a month period.
main periodicity, for example, in the spectral plots o f K oç Holding, a very high side peak was appeared with a angular frequency o f (22 / 1266)ti as shown at the graphs 49-52.
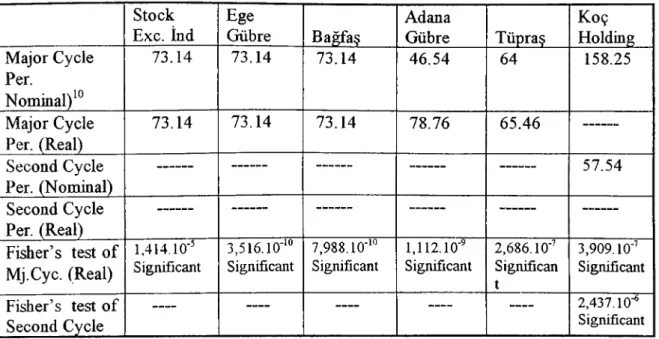
Table 1. Cyclical components identified by periodogram analysis
Stock Exc. ind Ege Gübre Bağfaş Adana Gübre Tüpraş Koç Holding Major Cycle Per. Nominal)'^ 73.14 73.14 73.14 46.54 64 158.25 Major Cycle Per. (Real) 73.14 73.14 73.14 78.76 65.46 Second Cycle Per. (Nominal) 57.54 Second Cycle Per. (Real) Fisher’s test o f Mj.Cyc. (Real) 1,414.10·" Significant ,-10 3,516.10' Significant ,-10 7,988.10 Significant 1,112.10'" Significant 2,686.10·' Signtfican t 3,909.10·' Significant Fisher’s test o f Second Cycle 2,437.10·* Significant
3.3. Empirical Results of Cross-spectral Analysis
In this part, the cross-spectral statistics o f coherence and phase were calculated for each o f the four series against stock exchange index. The value o f m was kept at 128, so that, because o f its large value, significance test o f coherence is automatically satisfied. The coherence statistic provide a measure o f goodness o f fit between prices o f securities and stock exchange index, and the phase statistics indicates the timing o f response. Infact, in the first part, periodicity o f the index and selected securities were found, from the results, it can be said that, periodicity o f the index is close to the securities. For that reason, coherence measure give higher values at some frequencies near to cychcal periods o f securities such as 78 in the Ege Gübre, 39 in the Bağfaş, 78
in the Adana Gübre. Since cross-spectral analysis gives the influence o f the index on stock exchange securities. As would be expected, the strongest relationship as measured by the coherence value are to be found in the Ege gübre, Bağfaş and Adana Gübre with respect to Tüpraş since their frequency o f periodicity is close to frequency o f index periodicity.
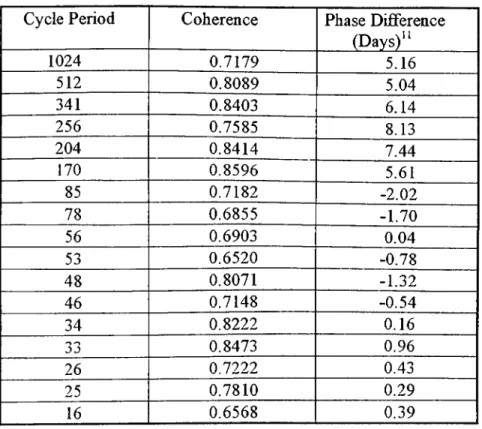
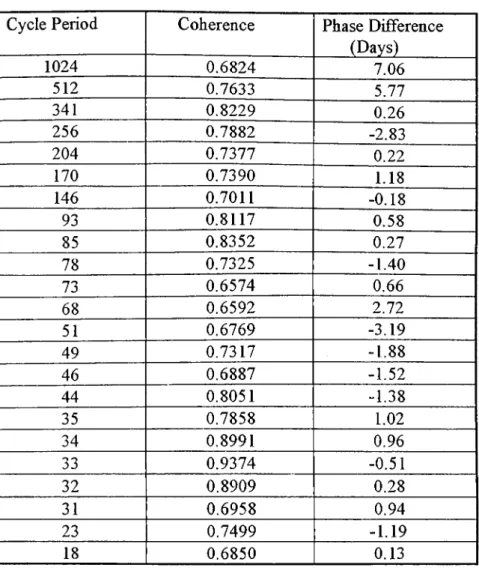
From the tables 2-5, it can be seen coherence and phase difference values o f selected securities, rows o f the tables are selected, if the coherence values are greater than 0.65. If both coherence and phase difference graphs o f Ege Gübre are superimposed on each o th er, it can be seen that, the high coherence values intersects with positive phase difference values at high frequencies, whereas, at relatively low frequencies, it intersects with negative phase difference values, and finally, at very low fr equencies, phase difference is again positive. In the case o f Bağfaş, there are relatively more negative phase difference values at high frequencies and reverse o f this at low frequencies. Since in tlie cross-spectral analysis, high coherence values are important such as C > 0.65, by looking at phase difference o f high coherence values between index and selected securities, it can be decided, whether index lead or lags to the selected securities (L ow frequencies are interpreted as indicating long run relationships and high frequencies are interpreted as indicating short run). For example at high frequencies, in the short run, index lags Ege gübre. In the case o f Adana Gübre, again if phase difference and coherence graphs are superimposed on each other, positive phase difference values intersects with high coherence values at low frequencies (in the long nm), then it can be said that, there is positive time lag between index and Adana gübre, whereas at the low periods such as 44, 46, 49, 51, index leads to the Adana Gübre .
Table 2. Relationship between stock exchange index and Ege Gübre.
Cycle Period Coherence Phase Difiference
(Days)" 1024 0.7179 5.16 512 0.8089 5.04 341 0.8403 6.14 256 0.7585 8.13 204 0.8414 7.44 170 0.8596 5.61 85 0.7182 -2.02 78 0.6855 -1.70 56 0.6903 0.04 53 0.6520 -0.78 48 0.8071 -1.32 46 0.7148 -0.54 34 0.8222 0.16 '·> o J J 0.8473 0.96 26 0.7222 0.43 25 0.7810 0.29 16 0.6568 0.39
Table 3. Relationship between stock exchange index and Bağfaş.
Cycle Period Coherence Phase Difiference
(Days) 1024 0.9476 -0.62 512 0.9318 5.83 44 0.7395 -1.50 39 0.8762 -0.44 38 0.7991 -0.90 36 0.7329 -0.82 35 0.8011 0.05 34 0.7763 -0.15 21 0.7921 0.02 20 0.8739 0.24 19 0.8469 -0.05 18 0.8513 -0.15 15 0.7687 -2.00
Phasing is meassured in terms of days; a negative value means stock exchange index leads selected securities, a positive value means it lags selected securities.
Table 4. Relationship between stock exchange index and Adana Gübre.
Cycle Period Coherence Phase Difference
(Days) 1024 0.6824 7.06 512 0.7633 5.77 341 0.8229 0.26 256 0.7882 -2.83 204 0.7377 0.22 170 0.7390 1.18 146 0.7011 ^ -0.18 93 0.8117 0.58 85 0.8352 0.27 78 0.7325 -1.40 73 0.6574 0.66 68 0.6592 2.72 51 0.6769 -3.19 49 0.7317 -1.88 46 0.6887 -1.52 44 0.8051 -1.38 35 0.7858 1.02 34 0.8991 0.96 33 0.9374 -0.51 32 0.8909 0.28 31 0.6958 0.94 23 0.7499 -1.19 18 0.6850 0.13
Table 5. Relationship between stock exchange index andTüpraş.
Cycle Period Coherence Phase Difference
(Days) 512 0.6965 -6.68 341 0.7784 3.53 256 0.7558 7.79 93 0.6925 -4.76 85 0.7083 -2.61 46 0.7178 0.11 44 0.7548 -1.43 30 0.6956 0.09 27 0.8145 -0.18
By using Fuller test, coherence values can be found to be significant (because o f high m value) at the %95 confidence level by using the F-statistic introduced in section 2.4.2.
Because o f high coherence values at certain frequencies, phasing can be treated with confidence, phasing values shows that, there are some phase difference between index and selected securities.
4. C onclusion
In this paper, spectral analysis methods are apphed to the stock exchange market. In this market, any information associated with the price movements o f securities is evaluated immediately, so information means profit in this busines. For that reason, measures such as periodicity, coherence, phase difference are very important for speculators and the others dealing with stock exchange market. As it can be seen from the Üieoretical discussion and empirical examples, both spectral analysis and cross-spectral analysis are capable o f fibading for these three measure correctly.
First o f all, it must be emphasized that, whether price series are real or nominal, strong cycles (Significant) can be found in certain well defined frequency bands with spectral analysis. Even in some series (i.e. K oç Holding), secondary cycles other than major cycle can be found. Spectral analysis is a broad concept, and it includes different metliods, windowing is one o f them. By using suitable wiudows correctly, desired spectral plots can be obtained.
And also, it should be noticed that, in the process o f estimating the spectrum, several decisions must be taken, which rely on a large degree o f ex'perimentation. For
trend removal, consumer price index is used to obtain real prices o f securities and, to deal with stationary data, mean o f the prices is subtracted from the data.
If the number o f data points available is increased to 4096 data points (at least 12 years data is neccessary), seasonahties can also be found from this analysis. 1024 data point is not enough to fiod seasonahty, w e can not generalize periodicities as seasonahty by looking 5 year data. The periodicities that was found in the analysis is related with the uncertainities o f economic situations. For example, from the graphs numbered from 1 to 10, it can be seen that, period o f last cycles are smaller than the period o f 1990s and 1991s.
With tlie cross-spectral methods, two measure is investigated. Coherence measure is plotted against frequency, and it is founded that, this statistics is statistically rehable measure o f the goodness o f fit. Phase difference is also plotted against frequency and it provides important information on the relationship between index and selected securities, in terms o f the importance o f different wavelengths in the series. By using cross-spectral analysis in the stock exchange market, phase difference o f high coherence values between two security can be found and processed, and by using these statistics forecasting about the future values o f securities can be made by means o f lead or lag relationships between two securities.
The most important difference o f tlie spectral analysis and cross-spectral metliods from the time domain analysis methods (i.e. regression and and correlation) is that , spectral analysis deal with overall shape o f the statistics, plotted against frequency, then on standard significance test. For these reasons, the use o f spectral analysis is less clear cut then the time domain approaches. Nevertheless, the use o f this
procedures may provide important insight in to the properties o f single series, and the relations between series, which are not available using time-domain approaches.
Graph 1. Nominal Istanbul Stock Exchange Index(l 8 .0 9 .9 0 - 31.10.94) 30000 25000 -20000 15000
-10000
— 5000 O O l O C MO J C D C O O r ^ ( N i o c o o c o c o c n ^ T— 'I— -r” T— C\J T t - I - O O I O C M O C D C O T l - r ^ O > C M l O h - O r O CNJOUCVJCOCOCO' ^' ^ o Tİ" 00 LO Osl G i CD CO O r-- 00 LO C\J C7> CD CO o CD 00 tJ- CO (0) C\J r - O CO ID CO T— CO CD G> T— o LD LO ID ID CD CD CD h- CO 00 00 00 CD CD o Time (day)ю σ> 00 о о о о о о о о о о о оо
о
Р 43 :z:о
3 5'о
0> W m 0Q CDО
er
•-I G О)0
юо
Ό 4^G raph 3. N o m in a l P r ic e s o f B a ğ f a ş ( l 8 .0 9 .9 0 - 3 1 .1 0 .9 4 )
CsJ
о со CD
LO CDc\j ю со
CD О т — CO- î t LOh - OOCDOOJ ÇO' ^ tт - ' ^ І ^ О С О С О О С Ѵ і Ю О О CD h- 00 OO СО CD C\J (D CVJ LO 00 СО LO CD N. C D O τ - C O ' ^ Ю C D O O C D Oτ ; ^ r ^ O C 0 C D σ ) ( ^ J Ю0 0 LOCMCNJ OJ OJ CVJ CVJ CMCOCOCOCOCOCOCOCO^Í - ' ^' ^' ^' ^' ^' ^’^
G raph 4. N o m in a l P r ic e s o f A d a n a G û b r e (l 8 .0 9 .9 0 - 3 1 .1 0 .9 4 ) . т і - Г ^ ОС ОС ОО) С \ ] ЮОО 'і“ С \ і ' ^ Ю С О Ь - С Т ) О т - co Tf Ю 00CO œ о C4J cq 'Si:CD σ> CO LO CO CO h- op о^ h- о СОСОО^ООЮООт-co со ю CD h- σ> C ^ C O C \ J C \ J C \ J O J ( M C O C O C O C O C O C O C O C O Time (day) ^ Г ^ О С О С О О ) О О ЮО О О ' Г - С О ' ^ Ю С О О О С З ^ О
і 1 1 -JL го ю 4^ σ> CD о го 4^ (Л CD о о О о о о о О о О о о о о о о о о о О о о о о о о о о о О о
о
P tr о 3 5' Pо
о
со о »-h Н C« о LO bо\
ѴОGraph 6. Real Istanbul Stock Exchange Index(l 8.09.90 - 31.10.94).
h > - C O O ) l O t “ r ^ C O O ) L O ' r - r ^ C O O ) L O * » — C \ J L O h - O C O L n o O O C O C D C O ] r - 2 ^ g ) ^ ; ^ C D C n C M ».vju.il ! ; : ^ ^ . ^ . r - c \ j o j c v j o j c o c o c o c O ' ^ ' ^ ' ^ N - C O O î L O ^ r ^ C O O ^ l D ' r - r ^ C O O m T - r ^ C O O î l O _ T t r ^ 0 5 C \ J L O r ^ O C M l O O O O C O L r ) O O ı r - C O C Û O O T - T t l O L 0 m i O C D C D C D r ^ r ^ h - h > - 0 0 0 0 0 0 C X 5 0 ^ O 5 0 ) 0 ) O Time (day)G raph 7. R e a l P r ic e s o f E g e G ü bre ( 1 8 .0 9 .9 0 - 3 1 .1 0 .9 4 ) . h- CO CJ lO O) h- o
in
'I-CO to COCO CT) LO O CO T- CD h-00 CvJ ‘ ‘ “ CO a> ID T-_ _ _ 1 - CO CD CVJ CM CM CO CO CO CO CO o> ID CO C3^ ID h- CO ID CO CD ID CM 1^ CM ID O CM ID 00 o CO ID 00 1— CO CD 00 1— ID ID LD ID CD CD CD N 00 00 00 00 CD CD CD o Time (day)го со сл сл с» со 3 (D а
0)
<О
о
о
СРω
Ci) 0Q< О )0 ю о 40Graph 9. Real Prices of Adana Gübre(03.06.91 - 31.10.94). Senesi '\v'^ K— A . \ l K
r-CN C O O İ I Dm r ^ O C O L O O O O C O ( 0 0 0 ' t —t— r ^COO) LO' « “ r ^COO>LOT—C O ( 0 0 > T - T j - C D C 3 > C \ | ' ^ I ^ O ) C N J l O h - O C s i l f ) C O O C O l O O O T - c O ( D O O ' « - h ~ C O O > U ^ ^ f ^ C O O > L O ' ^ r ^ C O O ) l O ' T - - h ^ C O O ) L O ’^ r ^ C O O ) L O u^ı ^ ^ ! J ^ ; p : İ f ^ ^ ^ e s i C 0 C 0 C 0 C 0 ^ 4 ^ " ^ L O l O i n i O C D C D C D r ^ r ^ r ^ l ^ C X ) 0 0 0 0 0 0 0 ) 0 ) 0 > 0 > O
ю ω 1 22 43 64 85 106 127 148 169 190 211 232 253 274 295 316 337 358 379 Η 400 i ^2'*
I
442 463 484 505 526 547 568 589 610 631 652 673 694 715 736 757 778 799 820 « a жJ
> -t-сл О) > гг
с" О3
CD P О CD ä Ό О U ) о os 40G raph 11. S p e c tr a l P lo t o f In d e x ( N o m in a l) in th e lo g s c a le
G raph 12. S p ectra l P lo t o f E g e G übre (N o m in a l) in th e lo g s c a le .
G raph 13. S p ectra l P lo t s o f B a g fa § ( N o m in a l) in th e lo g s c a le . CD ID TT-o CO T— CO o 05 CD o ID C\J CD o 00 r--o 00 CO 05 o <35 o ID <M T” CD o COCD ID 05 t— N. ID N 00 T“ CO o CM 00 00 CM COCM ID CM d CD ID CD CM CO s CM CJ5 CD 05 CM ID CM CO 00 CM CO 00 CO CO <35 ID CO ID N CO d CD o 05 CO CO CD o 'M· <35 CM ID N CO COID 00 00 CD "M -00 ■M· d d d d d d d d d d d d d d d d d d d d d d d d d d d d Frequency
G raph 14. S p ectral P lo t o f A d a n a G übre (N o m in a l) in th e lo g s c a le .
G raph 15. S p ectra l P lo t o f Tiipra§ (N o m in a l) in th e lo g s c a le .
G ra p h 19- S p e c tr a l P lo ts o f A d a n a G ü bre (N o m in a l) an d S in e W a v e w ith P e r io d : 5 1 2 /1 1 . CD
ID
o CD CO CO o CD CD oÖ
|_0 00 LO CD CO CD LO -r- 00 LO CD CO 05 lO 1— 00 LO CD CO CD ID T- 00 00 CO CD CM o CD co 00 CM LO 1— CD CM 00 CO CD o CO T— h- co CO 'M-V.VI o T^* LO (V. 00 o 1— CO CD 00 CD T— CM ID CO 05 o CM CO ID CD 00 o o o I— CM CM CM CM CM CM CO CO CO CO d CO "M- 'M- "M- 'M' d d d - d d d d d d d d d d d d d d d d d d d d d dG raph 2 0 . S p e ctra l P lo ts o f TQpra§ (N o m in a l) and S in e W a v e w ith P e r io d :5 1 2 /8 . CD CO O) LO 00 LO CD CO a> lO T- 00 LO CD CO lO "1— 00 "M- LO CD CO CD LO y— 00 LO CD CM 00 CO G> CM O CD T- h- CO 00 CM lO 1— CD CM 00 CO CD h- o CD T-- r^ CO 00 T— CO CD h- G> O 1— LO h- 00 o •T“ CO Q CD 00 CD T— CM 'M- LO CO CD o CM CO LO CD 00 o o o O O O T- c T— T— T— CM CM CM CM CM CM CO CO co CO d CO 'M- "M-CD CD CD CD CD CD d d d d d d d d d d d d d d d d d d d d d d Frequency
Graph 21. Time Domain graph of Index (Nominal) and Sine Wave with Period : 1024/14 -1 2 -- 3 o i c o CM 0 0 ( x i· o C D CM oo Xt o 1 CD CM oo 'M - o CO CM 1■oo 1 X T o CD CM O Q CO ' ^ 0 0 o ; CO P oo — CO CiD 0> 1 r — c o l O) CM x ii h - i O) I D ; r ^ O CM ▼T CM' CM C N 1 CM CO !co 0 1 15 1 CO1 ^1 r i · 11 X f i t o 1 LO1 ID ;1 I D C D i 1 CD 1 Xf o cb CM1 CO Q CD ! CM oO xi* ID oo o CO CD 00 CO 1 CD 00 h- oo 1 ! 1 1 oo ; oo ioo 1 i 1 1 0^ ■O) o5 o 1 ; I I
!
I
i I I I II
II
\
I I!
l 1 Index Sine W ave I I i i Time (day)Graph 24. Time Domain Graph of Adana Gübre (Nominal) and Sine Wave with Period : 512/11
G rap h 2 5 . T im e D o m a in P lo t s o f T u pra§ (N o m in a l) and S in e W a v e w ith P e r io d : 5 1 2 /8 .
G raph 2 6. S p e ctra l P lo t o f In d e x (R e a l) in th e lo g s c a le