i
Region and Sector Specific Labor Productivity Convergence in Turkey
by Bahadır Cem Uyarer
Submitted to the Graduate School Social Sciences in partial fulfilment of the requirements for the degree of
Master of Science in Economics Istanbul Bilgi University
iii
© Bahadır Cem Uyarer 2015 All Rights Reserved
iv ABSTRACT
REGION AND SECTOR SPECIFIC LABOR PRODUCTIVITY CONVERGENCE IN TURKEY
Bahadır Cem Uyarer Master of Economics, 2015
Engin Volkan, Supervisor
Keywords: Economic convergence, regional economics, labor productivity Economic convergence is one of the main subject of vast of the studies. In addition to cross country analysis, in recent years country convergence and in-country regional economic disparities have attracted substantial attention. Specifically, economic disparity across regions of the Turkey has been examined by several scholars. Nearly all of these studies indicate divergent pattern of regions in terms of economic growth. Hence, they reveals that economic disparities across regions are persistent and will grow over time. In this thesis, same as previous literature, we exhibit the economic heterogeneity of regions by descriptive analysis of value added shares, employment shares and productivity levels. Moreover, we have analyzed the growth level of regions via growth decomposition methodology and see the disparity of regions in terms of growth patterns. Then, proceed our analyze with beta convergence analysis and beta decomposition. Here we see that, in aggregate level and each sectors, regions are converging each other in different rates. Beta decomposition shows that, the main driving force of convergence is agriculture sector and the re-allocation of labor force between sectors. In sum, first time we show that disparity across regions diminishing and convergence take place between 2004 – 2011.
v ÖZET
TÜRKİYE’DE BÖLGESEL VE SEKTOREL EMEK URETKENLIGI YAKINSAMASI
Bahadır Cem Uyarer
Ekonomi Programı Yüksek Lisans Tezi, 2014 Engin Volkan, Danışman
Anahtar Sözcükler: Ekonomik yakınsama, Bölgesel iktisat, emek üretkenliği Ekonomik yakınsama bir çok iktisadi çalışmanın temel konularından birisidir. Ülkeler arası çalışmalara ek olarak son yıllarda ülke içi bölgesel iktisadi farklılıklar ve yakınsama konusu geniş dikkat çekmiştir. Türkiye özelinde, bölgesel iktisadi farklılıklar birçok araştırmacı tarafından incelenmiş, bu çalışmaların neredeyse tamamı ekonomik uzaksama sonucunu elde etmiştir. Bu sonuçlar Türkiyede bölgeler arası iktisadi farklılıkların kalıcı ve zaman içinde büyüme eğilimde olduğunu göstermiştir. Biz, bu çalışmada, geçmiş çalışmalara benzer şekilde bölgelerin ekonomik heterojenliğini katma değer dağılımı, istihdam dağılımı gibi değişkenlerin betimleyici analizi ile ortaya seriyoruz. Dahası, bölgelerin büyüme oranlarını ayrıştırma metodu ile inceleyip, büyüme yapılarındaki farklılıkları işaret ediyoruz. Sonrasında, bölgeler arası farklılıkları beta yakınsaması ve ayrıştırma metodu ile inceliyoruz. Bu analiz sonrasında toplamda ve sektörler özelinde bölgelerin birbirine farklı hızlarda da olsa yakınsadığını görüyoruz. Beta ayrıştırma metodu gösteriyor ki yakınsamanın altında yatan temel faktörler tarım sektöründeki verimlilik artışı ve emek gücünün sektörler arasında daha verimli dağılışı. Sonuç olarak, bu çalışmada, biz bölgeler arası farklılıkların 2004- 2011 döneminde azaldığını ve bölgesel yakınsamanın gerçekleştiğini ortaya koyuyoruz.
vi
Table of Contents
Chapter 1 ... 1 Introduction ... 1 Chapter 2 ... 4 Literature Review ... 42.1. Conceptualization, Methods and Findings ... 4
2.2. Studies from Turkey ... 8
Chapter 3 ... 12
Data and Descriptive Statistics ... 12
3.1. Data ... 12 3.2. Regional Productivity ... 18 Chapter 4 ... 25 Analysis ... 25 4.1. Methodology ... 25 4.2. Results ... 29 Chapter 5 ... 35 Conclusion ... 35
1
Chapter 1
Introduction
This thesis studies the aggregate and sector specific economic disparity across regions’ of Turkey between 2004-2011. Our results show that during the period, there is substantial heterogeneity across regions of Turkey, in terms of produced value added, employment shares and productivity performance. Additionally, the pattern of heterogeneity is decreasing over the examined period. This implies that there is labor productivity convergence across regions. This aforementioned result contradicts the literature that studies regional growth and convergence in Turkey during 1990s and early 2000s. The fact that convergence is observed in this paper for the first time, we are the first to study the structure and the determinants of convergence.
Economic performance of regions varies widely in Turkey. This variation is one of the major concerns of policy makers since 1960s (Yavan, 2011) as it not only increases the uneven country/regional income distribution but also accelerates internal migration from East to West, thereby creating vital socio-economic issues. In this respect, policymakers have been studying and designing various economic policies, such as provision of regional subsidies, prioritization of certain regions for investment, establishment of regional development agencies, to incentivize investments in periphery rather than the center and bring the under-developed regions closer to those with higher economic performance in industrial, service, and/or agricultural sectors. Succession of these policies is believed to mitigate the side effects of regional economic disparities that are intensive internal migration from East to West.
2
There is a vast literature on regional economic growth divergence in Turkey. Prior studies, rely on the test of convergence hypothesis between regions and try to understand does –at least- conditional convergence take place across regions? What are the conditions that make convergence possible? Most of them demonstrate that over time, dispersion across regions does not diminish, contrary; for some regions- sectors -time intervals divergence has been indicated. For instance Filiztekin (1997) demonstrates that productivity level of regions diverges between 1975- 1990 period in Turkey. Moreover, in his study, Filiztekin highlighted value added and employment share wise disparities between regions. Temel et. al. (1999) also report evidences about the polarization around industrialized regions, in other words they report massive divergence around superior regions. Some studies focus on West – East dispersion and again divergence or increasing heterogeneity across regions have been figured out. As summarized in literature review section, independent from used methodology and time interval, studies focus on regional development of Turkey come with similar results until 2004.
This thesis differentiates itself from the rest of the literature in three ways. Firstly, it extends the period of study from 2004 till 2011. Secondly, it is the first to find regional convergence for industrial, service, and agricultural sector. Finally, given the aforementioned result, the thesis is the first to study the structure and determinants of productivity convergence. The methodology we apply to further study productivity convergence is shift-share analysis. The advantage of this method is decomposing components of productivity movements, thus convergence to growth effect that indicate in sector labor productivity movement, shift effect that reveal labor productivity movement arise as a consequence of between sectors labor re-allocation and interaction effect that combines shift and growth effect. With the use of this method, we show that regions’ labor productivity performance increase mostly due to in- sector labor productivity improvement and it is one of the major reason behind convergence with shift effect. After shift-share decomposition analysis, when we re-visit the raw data;
3
number of employment in each sector, unemployment rate, number of unemployed people, we see that throughout the period there were massive dismissal of people in agriculture sector and immense unemployment rate increase at regions’ agriculture sector’s labor productivity performance grew tremendously. In other words, job cuts in agriculture sector lift the productivity level in agriculture sector up and it contributed to the both convergence and gross labor productivity significantly. Furthermore, some of the dismissed people from agriculture sector placed more productive service and industry sector; thus labor force re-allocated between sectors in more efficient way and it reflected our analysis as significant total shift effect on convergence across regions.
This thesis is organized as follows. In chapter 2, we provide a detailed literature review. Chapter 3, introduces data and the methodology. In chapter 4, we present and interpret our results. Finally, chapter 5 concludes.
4
Chapter 2
Literature Review
2.1. Conceptualization, Methods and Findings
The literature of economic growth has been asking the question whether productivity performance of countries are converging or diverging over time. In other words, are less productive nations catching up to the most productive ones, and if they are, how quickly and by what means.
After the establishment of Solow’s (1956) and Swan’s (1956) growth theories, economic convergence or -as called as- catch up effect has been one of the most prominent research question in the circle of economic growth literature. According to the Solow growth model, nations with similar rates of population growth and technical progress suppose to follow similar levels of per – capita income in the long run apart from their initial endowment. On the process of steady state adjustment, nations with lower capital stock grow faster compared to nations with higher capital stock. This phenomena known as convergence hypothesis. Although well established theoretical background, there is no empirical consensus on whether nations exhibit convergence in per capita income or not. In other words, the hypothesis can not be validated via data for too large sample of countries.
Apart from theoretical debate of growth literature, most of the empirical studies follow the works of Barro (1991), Barro and Sala-i-Martin (1992), Mankiw, Romer and Weil (1992) that tries to answer the question does convergence take
5
place between countries, and what are the determinants of this convergence if it is exist. In their studies, across taken countries, they cannot find absolute convergence. However, after adding further controls to their analysis they found evidence for convergence. It means, only some of the poor countries can catch up rich club or it is subject to some other conditions. On the other hand, as some other studies done, when sample restricted to a group of countries, such as OECD countries, convergence were demonstrated. It indicates that, convergence is a phenomena that valid for only certain group of countries rather than all of the countries.
In addition to cross country analysis of convergence hypothesis, in country convergence or in other words, across regions/states convergence has been studied by scholars as well. The seminal works of Sala-i-Martin and Barro (1991,1992) concerning convergence hypothesis across U.S. states in terms of income per capita and gross state product per capita initiated the debate on between state convergence. Similar studies were conducted for other countries such as by Shioji (1996) for Japan, Coulombe and Lee (1995) for Europe, and Persson (1994) for Canada. Their findings show that, convergence take place between regions of those examined countries around two percent per year. In terms of sector specific examination, they figure out that convergence is taking place in all sectors, however in some sectors convergence is much more speedy than some others. Bergströn (1998) analyzes the regional convergence hypothesis for Sweden. In his study, Bergströn followed the non linear -convergence model suggested and used by Sala-i-Martin and Barro in their benchmark study. Basically, he examines the questions; does average per capita income in Swedish countries diverge or converge after 1945, and whether Swedish regional policy has affected the process of divergence or convergence of real per capita income among counties? According to Bergströn’s results, real per capita income for Swedish counties has converged each other since 1945, targeted support counties have not grown faster than other counties after the introduction of the regional policy support program
6
around 1970. In sum, he found convergence across Swedish counties, and in-effectiveness of initiated regional policies.
One another study were conducted by la Fuente (2002) for Spanish regions. They developed and estimate a descriptive growth model that allows for factor accumulation, technological diffusion, rate effects from human capital and unobserved regional factors. Their findings indicate catch up, the equalization of educational levels and the redistribution of employment across regions account for most of the observed reduction of regional disparities.
Similar in country convergence analysis were conducted by Kangasharju (1998) for regions of Finland and his study demonstrates that, in Finland across regions convergence takes place. Contrary, Siriopoulos and Asteriou (1998) found that across regions in Greece, convergence does not take place. These studies show that, despite similarity of countries –institutions, development level etc.-, their between region convergence stories will be different. For extensive literature review of European Union countries’ convergence analysis, see the Eckey and Türck (2007) literature report.
In regional convergence analysis, several studies have been made with sector specification. In this way, scholars aim to understand the underlying reasons of heterogeneity across regions in terms of labor productivity, thus individual contribution of sectors to convergence if it exists. In other words, studies try to figure out as a consequence of which sector’s success or failure convergence take place or not. Furthermore, with the use of decomposition methods, each region's sector-specific contribution to the aggregate labor productivity growth and to the convergence can be determined. In this way, as well as factors that cause growth, factors that create convergence will be revealed. In sum, sectoral analysis and decomposition methods, indicate the reasons behind growth and if it is exist, convergence across regions.
In the benchmark study of Bernard and Jones (1996), they analyze the sources of aggregate labor productivity growth and convergence hypothesis for the U.S.
7
states from 1963 to 1989. Their main motivation is pre-found wide variation of the productivity levels of states and sectors. They followed the methodology suggested by Barro (1991), and they use both cross – section and time series analysis. Their findings show the diverse performance of sectors regarding convergence. In terms of sector specific findings, they demonstrate that, there is negative relationship between the initial level of productivity and the subsequent rates of productivity for the manufacturing and mining sector. Also two interesting facts revealed, first; convergence does not take place for all sectors over the examined period and decomposing aggregate convergence into industry productivity gains and changing sectoral shares of output, the manufacturing sector is the reason of convergence across states.
The research question and methodology proposed by Bernard and Jones (1996) had been followed by several scholars. Such as, Gouyette and Parelman (1997) test the convergence phenomenon in service and manufacturing industries by 13 OECD countries over the period 1970 – 1987. They focus on the catch – up process and on the direction between productivity changes and capital intensity variation. Their results show that, in contrast to the manufacturing sector and in spite of very low growth rates, productivity levels converge in service sector. Most recently, one another in-group examination were conducted for BRIC countries (Chansomphou and Ichihashi, 2013). BRIC is a newly coined label for a group countries that are Brazil, Russia, India and China. In this analysis, authors bring together the issue of structural change, labor productivity growth and labor productivity convergence. They imply the shift and share analysis to investigate the contribution of within shift, static shift and dynamic shift effects on growth of labor productivity. In addition, they test convergence hypothesis across BRIC countries within each sector. Their sector specific examination for convergence hypothesis demonstrates that service sector in BRICs have faster catching up rates than industrial sectors, and there is no convergence in agricultural sector across BRIC countries.
8
2.2. Studies from Turkey
Filiztekin (1998) extends the regional convergence literature to regions within developing countries by examining Turkey for the first time. In his study Filiztekin follows the methodologies suggested by Sala-i-Martin and Barro similar to studies examine developed countries. Thus, cross section analysis or in other words convergence were used for period covers 1975-1995. During analysis, he splits examined time period to three sub-periods. His results indicate divergence across regions for all sub-periods. Despite exclusion of top and bottom provinces from study, convergence could not be found. In addition to cross-section convergence analysis, sector specific heterogeneity and evaluation of dispersion of provinces for each sector has been exhibited in this study. The results of sector specific analysis show that, apart from agriculture, all other sectors exhibit divergence. Found negative coefficient of agriculture sector is barely significant hence can not be interpreted as nor convergence neither divergence. As last step, Filiztekin adds cross-country comparison with Southern Europe. In sum, this study initiates the discussion of regional/provincial convergence debate with consideration of sector specific disparities in Turkey. This study is the first to demonstrate the divergence pattern of provinces of Turkey has been demonstrated first time.
Filiztekin added some other regional studies concerns regional heterogeneity of Turkey to the literature. For instance, in “Bölgesel Büyüme, Eş-hareketlilik ve
Sektörel Yapı” (Filiztekin, 2004) he re-examined the regional disparities and again
could not find convergence across regions for years from 1975 to 2000. The main aim of the study was demonstrate the long run and short run growth heterogeneity between regions. His results indicate that, same as before, regional disparities tend to increase, at least did not diminish over the examined period.
One another study stress regional convergence hypothesis for Turkey were conducted by Karaca (2004). The main concern of this study is east - west per capita income disparities of Turkey. In his study, Karaca uses cross section
9
methodology and examines 1975-2000 period and sub periods such as 1975-1980, 1980-1990,1990-2000. Results demonstrate that, between 1975-2000 , provinces exhibit divergence in terms of income per capita. As second step, he adds control for eastern – western provinces to the regression analysis. In this way, he tries to figure out conditional convergence across regions if it is exist. Nevertheless, after adding further controls convergence does not take place yet, previously found divergence disappeared thanks to added control variables. In conclusion, Karaca suggests that, between eastern and western regions there is huge disparity against eastern regions and it is persistent. Inconvenient consequence of this immune disparity were listed such as irregular urbanization, security issues and excessive immigration.
Kırdar and Saracoglu (2007) add one more layer to the discussion of regional convergence in Turkey. They examined the causal impact of migration on regional growth rates thus regional convergence. Their results say that for Turkey which experience high migration rates and persistent regional disparities in per capita income, migration has negative causal impact on growth rates. In addition to that, migration decreases the coefficient of growth equation remarkably. In other words, migration has substantial effect on the speed of convergence. It is not only about the volume of migration but also about the composition of migrants, in Turkey most of the immigrants are less productive workers. That is why, “the
increase in the speed of convergence across regions is reinforces by the fall in average skill level of migrant receiving, initially richer regions.”(Kırdar and
Saracoglu, 2007)
Yıldırım (2007) aims in her study to evaluate the role of initiated regional policies in economic convergence across regions of Turkey for time period 1990-2001. She employ traditional beta convergence analysis which takes the spatial dimension into account. In addition to that, basic insights about the regional policies, provided government incentives and development plans taken to the account. Thanks to provided insight, policy evaluation in terms of regional convergence become possible. Her empirical results of the spatial lag model
10
suggests convergence at the national level, though with insignificant policy variables, suggesting that regional policies has no significant effect on convergence.
In addition to traditional beta - sigma convergence, time series analysis and decompositions some other methodologies had been followed in order to test convergence hypothesis across regions of Turkey. For instance, Tansel et.al. (1999) used non parametric regression for spatial analysis and markov chain procedures. Their results demonstrate that, polarization of provinces getting deeper. In other words, some provinces tend to have high, while some have low productivity. These divergent groups create convergence clubs around the upper and lower tails of the time invariant distribution. These results show the presence of a persistent spatial pattern productivity, indicating concentration around three highly industrialized provinces. Although their previous study (1997) contradict with the Filiztekin (1998) and some other convergence tests for Turkey, in this study their findings are in line with previous literature.
There are some other studies show that Turkey exhibits divergence across regions. For instance, Berber et.al (2000) perform sigma and beta convergence analysis and his results indicate that poorer regions have no tendency to catch up richer regions. Senesen’s (2002) empirical analysis suggests that there has been a polarization process rather than convergence considering the west-coast and east-interior regions. Furthermore, empirical analysis conducted by Gezici and Hewings (2004) confirm the previous findings of literature, it means there is no indication that priority provinces in development grow faster than the developed provinces. In other words, substantial difference between few wealthier provinces and poorer regions of Turkey would be persistent. The list of the studies concern regional convergence in Turkey and find divergence can be extended.
In sum reviewed literature shows that, up until our study, any scholars could not find evidence for convergence hypothesis across regions in Turkey. Despite
11
analyzed wide range of years, followed diverse methodologies and used variables; results are consistent.
12
Chapter 3
Data and Descriptive Statistics
3.1. Data
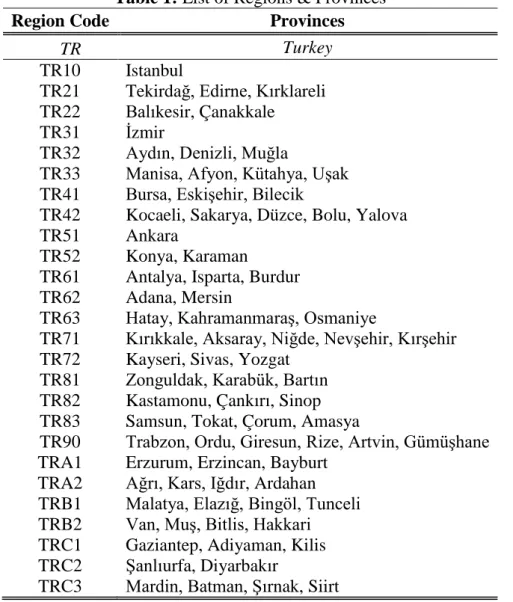
The empirical work for this paper uses data for three economic activities and gross economy for 26 regions of Turkey over the period 2004 - 2011. The regions and their region codes were listed in table 1. The examined economic activities are industry, service and agriculture. We use basic economic activities instead of NACE classified sectors due to data shortage. All used time series are annual. The necessary variables of our analysis are region specific value added in Turkish Lira and number of employment which are available at Turkstat Database. Hence, the fundamental and unique data source of our study is Turkstat.
All of the currencies used in our study are in 2003 Turkish Lira, have been deflated by the producer price index. We construct our labor productivity variable as value added over employee number. In other words, labor productivity is value added per worker for each regions and economics activities.
13
Table 1: List of Regions & Provinces
Source: Turkstat
In order to provide an overview about Turkey in terms of labor productivity, value added and employment structure, in table 2 we provide value added, employment and labor productivity numbers of Turkey at initial – final year and growth (annual average) over examined period.
Region Code Provinces
TR Turkey
TR10 Istanbul
TR21 Tekirdağ, Edirne, Kırklareli TR22 Balıkesir, Çanakkale
TR31 İzmir
TR32 Aydın, Denizli, Muğla
TR33 Manisa, Afyon, Kütahya, Uşak TR41 Bursa, Eskişehir, Bilecik
TR42 Kocaeli, Sakarya, Düzce, Bolu, Yalova TR51 Ankara
TR52 Konya, Karaman
TR61 Antalya, Isparta, Burdur TR62 Adana, Mersin
TR63 Hatay, Kahramanmaraş, Osmaniye
TR71 Kırıkkale, Aksaray, Niğde, Nevşehir, Kırşehir TR72 Kayseri, Sivas, Yozgat
TR81 Zonguldak, Karabük, Bartın TR82 Kastamonu, Çankırı, Sinop TR83 Samsun, Tokat, Çorum, Amasya
TR90 Trabzon, Ordu, Giresun, Rize, Artvin, Gümüşhane TRA1 Erzurum, Erzincan, Bayburt
TRA2 Ağrı, Kars, Iğdır, Ardahan TRB1 Malatya, Elazığ, Bingöl, Tunceli TRB2 Van, Muş, Bitlis, Hakkari TRC1 Gaziantep, Adiyaman, Kilis TRC2 Şanlıurfa, Diyarbakır
14
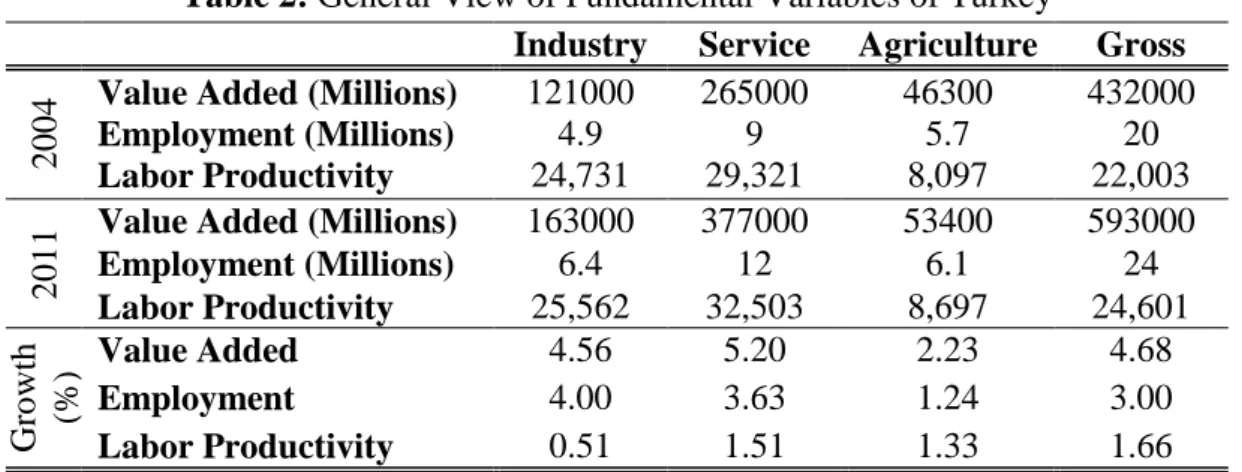
Table 2: General View of Fundamental Variables of Turkey
Industry Service Agriculture Gross
2004
Value Added (Millions) 121000 265000 46300 432000
Employment (Millions) 4.9 9 5.7 20
Labor Productivity 24,731 29,321 8,097 22,003
2011
Value Added (Millions) 163000 377000 53400 593000
Employment (Millions) 6.4 12 6.1 24 Labor Productivity 25,562 32,503 8,697 24,601 Gr owth (%) Value Added 4.56 5.20 2.23 4.68 Employment 4.00 3.63 1.24 3.00 Labor Productivity 0.51 1.51 1.33 1.66 Source: Turkstat
Table 2 stands for summarizing the used data, it reports average annual growth rates of value added, employment and labor productivity by economic activity for the 2004-2011period. Basic insights about the sector specific structure of Turkey can be obtained from that table. For instance, it indicates that in Turkey, service sector produces substantial share of total value added both in 2004 and 2011. In 2004, 61 percent; in 2011, 63 percent of the total value added produced by service sector. Moreover, it is growing faster than compared sectors over the examined period. In both years, industry sector produces nearly 27 percent, and agriculture sector produces approximately 10 percent of total value added.
On the side of employment, 46 percent of employed people work in service sector in 2004 and this number is growing; at 2011 it becomes nearly 50 percent. The second job provider sector is agriculture sector and covers 29 percent of total employment in 2004. The share of industry sector in total employment is 25 percent in same year. Yet, in 2011 the order has changed, agriculture losses her importance in terms of employment provision and industry sector becomes second. Industry covers 26 percent of total employment in 2011, agriculture sector’s share decreases to 24 percent in 2011.
In terms of labor productivity, most productive sector is service and least productive one is agriculture. It is in line with expectations because as all we know agricultural production demands more labor force than other sectors and
15
create lower value added, especially in Turkey as a consequence of lack of mechanization in agriculture.
When we analyze labor productivity growth of each economic activities, we see that industry sector exhibits lowest growth performance compared to service and agriculture. Service sector’s annual average growth is 1.51 percent between 2004-2011 yet, industry only grow 0.51 percent over same period. This portrait indicates that productivity level of industry sector is on average stagnant compared to service and agriculture sector.
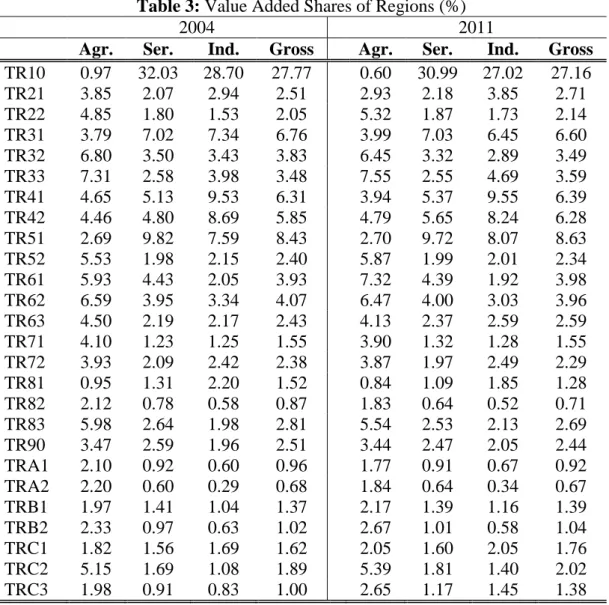
In table 3 we provide gross value added and sector specific value added shares of regions for 2004 and 2011 years. The aim of this table is indicating substantial differences between regions’ value added shares. For instance, from table 3 we see that Istanbul (TR 10) covers more than one fourth of the gross value added at both in 2004 and 2011. The share of Istanbul in total value added of Turkey is more than sum of bottom 16 regions’ share in 2004. This distribution does not change when we come to 2011. It means, the density of Istanbul on production of value added is persistent over 2004- 2011 period.
When we look specifically to service and industry sectors, the share of Istanbul covers more than one forth of Turkey’s values added at those sectors. In service, Istanbul produces more than one third (32 percent) of the produced value added by Turkey. This share decreases to 30 percent when we come to 2011 but it is still tremendously high.
In industry sector, although the share is lower than service sector, again it is tremendously high. Istanbul produces one fourth of the produced value added by industry sector. Istanbul’s share on total value added produced by industry sector is higher than sum of bottom 18 regions’ share. Yet, in terms of agricultural value added share, we cannot see any superiority of Istanbul. It produces only 1 percent of produced total value added by agriculture sector in 2004. When we come to 2011 the share of Istanbul decreases to 0.6 percent in agriculture sector.
16
The leader value added producer in agriculture sector is TR33 coded Manisa, Afyon, Kütahya and Uşak region. It covers nearly 8 percent of the total value added produced by agriculture sector in Turkey both in 2004 and 2011. In contrast to gross, service and industry value added shares, in terms of agriculture we cannot see substantial disparity among regions. In other words, value added produced in agriculture sector distributed among regions more homogeneous compared to value added produced by service and industry sectors. For further queries see table 3.
Table 3: Value Added Shares of Regions (%)
2004 2011
Agr. Ser. Ind. Gross Agr. Ser. Ind. Gross TR10 0.97 32.03 28.70 27.77 0.60 30.99 27.02 27.16 TR21 3.85 2.07 2.94 2.51 2.93 2.18 3.85 2.71 TR22 4.85 1.80 1.53 2.05 5.32 1.87 1.73 2.14 TR31 3.79 7.02 7.34 6.76 3.99 7.03 6.45 6.60 TR32 6.80 3.50 3.43 3.83 6.45 3.32 2.89 3.49 TR33 7.31 2.58 3.98 3.48 7.55 2.55 4.69 3.59 TR41 4.65 5.13 9.53 6.31 3.94 5.37 9.55 6.39 TR42 4.46 4.80 8.69 5.85 4.79 5.65 8.24 6.28 TR51 2.69 9.82 7.59 8.43 2.70 9.72 8.07 8.63 TR52 5.53 1.98 2.15 2.40 5.87 1.99 2.01 2.34 TR61 5.93 4.43 2.05 3.93 7.32 4.39 1.92 3.98 TR62 6.59 3.95 3.34 4.07 6.47 4.00 3.03 3.96 TR63 4.50 2.19 2.17 2.43 4.13 2.37 2.59 2.59 TR71 4.10 1.23 1.25 1.55 3.90 1.32 1.28 1.55 TR72 3.93 2.09 2.42 2.38 3.87 1.97 2.49 2.29 TR81 0.95 1.31 2.20 1.52 0.84 1.09 1.85 1.28 TR82 2.12 0.78 0.58 0.87 1.83 0.64 0.52 0.71 TR83 5.98 2.64 1.98 2.81 5.54 2.53 2.13 2.69 TR90 3.47 2.59 1.96 2.51 3.44 2.47 2.05 2.44 TRA1 2.10 0.92 0.60 0.96 1.77 0.91 0.67 0.92 TRA2 2.20 0.60 0.29 0.68 1.84 0.64 0.34 0.67 TRB1 1.97 1.41 1.04 1.37 2.17 1.39 1.16 1.39 TRB2 2.33 0.97 0.63 1.02 2.67 1.01 0.58 1.04 TRC1 1.82 1.56 1.69 1.62 2.05 1.60 2.05 1.76 TRC2 5.15 1.69 1.08 1.89 5.39 1.81 1.40 2.02 TRC3 1.98 0.91 0.83 1.00 2.65 1.17 1.45 1.38 Source: Turkstat
17
In table 4 we exhibit employment shares of regions for each sector in 2004 and 2011. Very similar to distribution of value added shares, in terms of employment Istanbul (TR10) has enormous share. Istanbul holds nearly 18 percent of the total employment of Turkey. The share of Istanbul does not change when we come to 2011.
Sector specific examination shows that, nearly one third of the employment in service sector located in Istanbul. This share decreases to 27 percent when we come 2011. Employment share of Istanbul in industry sector is 22.17 percent in 2004 and decreases to 21.63 percent at the end of 2011. Although Istanbul seems like job provider of Turkey in service and industry sector, in agriculture sector TR90 (Trabzon, Ordu, Giresun, Rize, Artvin, Gümüşhane) and TR83 (Samsun, Tokat, Çorum, Amasya) regions hold superiority. Sum of those regions’ employment share is 20 percent in agriculture sector.
18
Table 4: Employment Shares of Regions (%)
2004 2011
Agr. Ser. Ind. Gross Agr. Ser. Ind. Gross TR10 0.28 30.64 22.17 17.84 0.36 26.56 21.63 17.55 TR21 3.08 2.78 2.24 2.62 2.00 3.81 2.29 2.64 TR22 4.52 1.72 2.20 2.76 3.71 1.67 2.08 2.40 TR31 1.98 7.89 6.06 5.10 2.90 6.77 6.91 5.85 TR32 6.62 4.21 4.00 4.82 6.51 3.34 4.10 4.60 TR33 8.79 3.74 3.55 5.10 7.76 3.64 3.08 4.60 TR41 3.87 8.91 4.38 5.61 2.44 8.38 4.77 5.01 TR42 1.58 5.37 4.24 3.75 4.25 6.47 4.64 5.01 TR51 0.72 5.62 9.29 6.12 1.25 5.50 9.52 6.27 TR52 3.85 2.61 2.56 2.95 4.18 2.80 2.65 3.10 TR61 4.24 2.64 4.76 4.07 5.65 1.95 4.84 4.18 TR62 3.90 4.09 5.08 4.49 6.10 3.78 5.40 5.01 TR63 2.98 2.51 3.22 2.98 4.96 3.28 3.24 3.71 TR71 3.66 0.96 1.62 2.05 2.77 1.33 1.89 1.98 TR72 3.52 2.41 2.42 2.74 4.85 3.00 2.19 3.10 TR81 1.70 1.76 1.41 1.58 2.93 1.41 1.28 1.74 TR82 1.17 0.67 0.92 0.93 2.83 0.67 0.93 1.35 TR83 10.06 2.43 3.85 5.10 7.37 2.73 3.18 4.16 TR90 11.90 1.88 3.59 5.61 9.03 2.39 2.85 4.18 TRA1 4.85 0.31 1.12 2.00 2.57 0.64 1.09 1.36 TRA2 3.31 0.31 1.05 1.52 3.12 0.73 0.91 1.44 TRB1 2.24 1.04 2.05 1.86 3.14 1.59 1.95 2.17 TRB2 3.33 0.63 1.49 1.81 3.42 1.31 1.75 2.08 TRC1 1.77 2.78 2.61 2.41 2.10 3.19 2.15 2.43 TRC2 3.41 1.33 2.49 2.47 2.78 1.77 2.80 2.54 TRC3 2.71 0.78 1.65 1.74 1.01 1.28 1.91 1.53 Source: Turkstat
3.2. Regional Productivity
This study fundamentally aims to figure out the movements of labor productivity across 26 regions and three economic activities in Turkey through 2004 -2011 period. With respect to this aim, as its pointed several times by regional studies from Turkey, we would like to re-visit the regional disparities. Above tables stand in order to show the disparity of the ingredients of our measure, labor productivity. Briefly we see that, in both value added and employment shares across regions there are substantial disparities, mainly led by Istanbul. In addition, reviewed literature that concerning same question shows above found disparities
19
are persistent and ancient, thus it can be labeled as structural rather than temporary or cyclical.
In this section we try to examine the labor productivity levels of three economic activities of 26 regions and Turkey. We aim to understand heterogeneity of labor productivity levels across regions and see the evolution of heterogeneity throughout the examined period. Here, during our analysis ,as same as before, we analyze each sector individually.
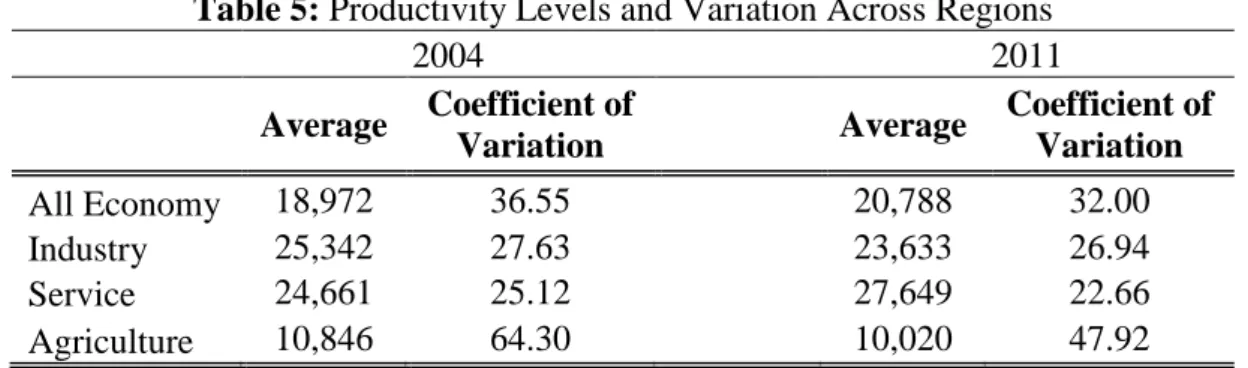
In table 5 we summarize our data by providing insight about the average labor productivity levels of gross economy and economic activities. Also we report variation across regions in order to point out the labor productivity dispersion across regions for each sector.
Table 5: Productivity Levels and Variation Across Regions
2004 2011 Average Coefficient of Variation Average Coefficient of Variation All Economy 18,972 36.55 20,788 32.00 Industry 25,342 27.63 23,633 26.94 Service 24,661 25.12 27,649 22.66 Agriculture 10,846 64.30 10,020 47.92
Note: Numbers are calculated by standard deviations and means of productivity levels.
As expected, in agriculture sector, average labor productivity is substantially lower than industry and service sector. Moreover, the variation of labor productivity across regions are tremendously higher than industry and service sector in agriculture sector. One of the explanation for this fact will be different mechanization levels of regions. Because, in more developed western regions such as TR10 (Istanbul) and TR21(Tekirdağ, Edirne, Kırklareli) agricultural productivity level is remarkably higher than poorer eastern regions.
20
In addition, we see that on average labor productivity level in industry and service sector is very similar. Furthermore, in these sectors, across regions variation is significantly lower than agriculture sector and similar to each other.
When we compare 2004 and 2011, we see that in all sectors and in total economy, labor productivity variation across regions diminishes. Especially in agriculture sector, we found significant recovery in terms of dispersion across regions. Yet, still variation is 47 percent.
In service and industry sectors, although labor productivity variation across regions diminishes, the movement is very slight. In industry sector measured dispersion is 26 percent and in service sector it is 23 percent in 2011.
The interesting fact that captured from table is changed ranking between sectors in terms of average labor productivity. Despite superiority of industry sector in terms of average labor productivity, when we come to 2011, on average, service sector seems more productive than industry. Agriculture is persistent at the bottom of the list.
In table 6 we provide all economy and each sectors labor productivity growth rates for comparison. Moreover, thanks to provided labor productivity growth numbers of regions, we will see the dispersion across regions in terms of labor productivity growth. Also, sector specific dispersion in terms of growth rates will be captured from table 6.
21
Table 6: 2004 – 2011 Labor Productivity Growth Rates (Gross) Industry Service Agriculture All Economy
TR 3.36 10.85 7.42 11.81 TR10 12.91 10.33 -48.28 12.27 TR21 -1.40 14.08 25.86 20.73 TR22 19.65 22.03 43.38 34.76 TR31 5.78 -2.45 -22.87 -0.60 TR32 9.63 2.96 3.58 8.57 TR33 24.76 26.75 25.61 33.73 TR41 9.94 6.74 44.25 18.27 TR42 -18.65 19.22 -57.21 -10.50 TR51 12.13 5.76 -38.21 5.07 TR52 -9.55 8.05 4.88 4.48 TR61 30.35 8.00 -0.58 7.82 TR62 0.92 5.68 -32.53 -5.12 TR63 -5.45 19.25 -40.99 -4.13 TR71 -23.46 1.73 34.83 16.35 TR72 -14.41 15.38 -23.16 -4.67 TR81 8.21 1.77 -44.52 -14.43 TR82 -7.23 -9.66 -61.60 -36.22 TR83 -1.20 28.22 35.84 37.16 TR90 -15.24 33.16 40.05 40.96 TRA1 -44.97 12.51 71.28 59.75 TRA2 -49.41 38.28 -5.06 16.53 TRB1 -25.17 15.11 -15.68 -1.95 TRB2 -54.80 -1.73 19.74 0.09 TRC1 9.07 38.16 2.02 21.16 TRC2 0.76 5.94 37.64 17.14 TRC3 9.54 23.67 286.70 77.63
Previously indicated dispersion across regions in terms of labor productivity levels, employment shares and value added shares becomes more apparent when we examine productivity growth rates. In addition, we see that growth rates vary widely between sectors as well as regions. For instance, service sector has grown 10.85 percent throughout the 2004- 2011 period. But, industry sector has grown only 3.36 percent during same period in Turkey.
22
If we focus on regions as individuals, growth rates indicate further dispersion. For instance, despite 12.91 percent growth in industry sector in Istanbul, agriculture sector shrink more than 48 percent.
The most striking growth dispersion between sectors exhibited by TRC3 (Mardin, Batman, Şırnak, Siirt). In terms of gross economy it’s growth rate is 77.12 percent which is significantly higher than average of regions (13.58), specifically in agriculture sector 286.70 percent growth rate has been reported. It is 1300 times more than TRC3 excluded average labor productivity growth in agriculture sector. Found interesting numbers force us to examine growth level of regions more caution. Henceforth, we analyze the number of unemployed people, unemployment rate and number of employed people in 2004 and 2011. These tables can be found at annex. According to our deeper examination tremendous tremendous labor productivity growth in agriculture sector in TRC3 arise as a consequence of massive dismissal of labors. According to employment statistics, number of employed people in agriculture sector decreases 60 percent from 2004 to 2011. Moreover, in this regions, unemployment rate increases a hundred person when we come to 2011 (from 6.06 percent in 2004 to 12.68 percent in 2011). Thus found amazing labor productivity growth is consequence of fail of agriculture sector in terms of employment rather than increase of output throughout the examined period. In addition, we see that in general structure of the found labor productivity growth in agriculture sector is same as TRC3 region. Regions that exhibit progress in labor productivity performance in agriculture sector face with higher unemployment rate and lower number of people in agriculture sector.
Also there is some regions that do not follow the same growth pattern with gross economy. For instance, against 11.81 percent gross growth during period, TR82 (Kastomonu, Çankırı, Sinop) 36.42 percent, TR81 (Zonguldak, Karabük, Bartın) 14.43 percent shrink in same period.
23
Furthermore, TRA1 (Erzurum, Erzincan, Bayburt), TRA2(Agri, Kars, Igdır, Ardahan) regions’ labor productivity level in industry sector shrink nearly 50 percent despite 3.36 percent gross growth in this sector. The interesting point is TRA1 regions’ total labor productivity growth is nearly 60 percent which is substantially higher than average growth of Turkey.
In above part of our analysis, we try to show the dispersion between both regions and sectors in terms of value added shares, employment shares, labor productivity levels and labor productivity growth rates over examined period. Our descriptive examination shows that in Turkey between regions there is substantial heterogeneity in terms of number of employment and value added production. Istanbul has substantial shares in this two variables. And the burden of Istanbul is persistent over 2004-2011 period. In addition to that we try to examine labor productivity heterogeneity across regions and sectors. It shows that, especially in agriculture sector across regions there is tremendous variation in terms of labor productivity level. Although, it diminishes over time, the final level is high enough to stress it out. In addition, for other sectors again variation across regions diminish but compared to agriculture sectors the movement is very slight. As last step of our analysis we exhibit the labor productivity growth rate of regions and sectors. Here we appeal striking disparity of regions in terms of growth rates. As last step of our analysis, we try to understand the underlying reason of diminished variation of labor productivity across regions. Do less productive regions grow faster and it diminished variation? In order to answer this question we draw scatter plot diagrams.
In these diagrams, logarithm of initial labor productivity levels reported at X-axis, and growth rates reported at Y-axis and then we draw a linear trend line. In this way, we aim to investigate the association direction between initial labor productivity levels and growth rates. Negative association means less productive regions grow faster than more productive regions, positive associations means, more productive regions grow faster than less productive regions.
24
Graph 1: Service Sector Graph 2: Agriculture Sector
Graph 3: Industry Sector Graph 4: All Economy
Basically, above exhibited graphs show that, in total economy and each sectors, less productive regions have grown faster than more productive ones. It will be one of the possible explanation of the found lower variation across regions in terms of labor productivity in 2011 compared to 2004.
Nevertheless, weakness of scatter plots, does not allow us for further interpretation at this step. Henceforth, in proceeding section of our study, we extend our examination with beta convergence analysis, Maddion’s (1952) decomposition analysis and Wei-Kang’s (2006) beta decomposition analysis.
-20 -10 0 10 20 30 40 50 9.5 10 10.5 11 -100 -50 0 50 100 150 200 250 300 350 0 5 10 15 -60 -50 -40 -30 -20 -10 0 10 20 30 40 9.5 10 10.5 11 -60 -40 -20 0 20 40 60 80 100 9 9.5 10 10.5 11
25
Chapter 4
Analysis
4.1. Methodology
In this section of this thesis, we present our methods that used during analysis. In the first part, we explain shift-share growth decomposition methodology. The aim of the decomposition is understanding the effects of three components –an increase in output per worker, change in the structure due to reallocations of workers between sectors or both- on aggregate labor productivity growth. Thanks to established shift-share method, we can see the pattern of structural change in the supply side using our dataset. Moreover, it provides chance to compare regions’ structural change. As second step, we test convergence hypothesis in all economy and each sector. In this part of our analysis, as followed by vast amount of studies, we follow cross section beta convergence methodology. As last step, we decompose the convergence rate and estimate the individual effects of structural changes and sectors on aggregate convergence.
4.1.1. Productivity Decomposition
In this section we want to present followed methodology, as called as shift –share analysis. It stands for decompose the aggregate labor productivity growth of examined regions over examined period to basic components. This decomposition originated in 1942 by Daniel Creamer and has been used by several scholars such as Perloff, Dunn and Lampard (1960), Timmer and Szirmai (2000) and Peneder (2003). Although, it has been used by several researchers, it has been also critized as well. For instance, Houstan (1967) and Stevens and Craig (1980) in their article listed the weakness of the methodology. Despite criticisms, descriptive strength of the decomposition is an agreed matter.
26
The share – shift effect basically can be written as: Or (1) Where;
denotes change, is aggregate labor productivity (here value added per worker), is labor productivity of sector , is initial level of value added, is initial output of sector , and is employment share of sector .
In above section we have exhibit decomposed components of aggregate labor productivity. As we said previously, It has been used as several times during labor productivity growth analysis and in each study the shape of components and the conceptualization of them vary widely between studies. Nevertheless, all shift – share analysis rely on same rationale.
In our study we follow the Wei-Kang’s jargon during establishment of components and conceptualization of him. Respectively, the first, second and third terms of right-hand side of equation (1) will be called as total growth effect, total shift effect and total interaction effect. These effects can be explained as follows:
27
Total Growth Effect: Basically it will be explained as the effect of in-sector productivity improvements on aggregate labor productivity growth, when we hold employment structure of economy as constant. The sub section of total growth effect also captures the effect of each sectors to the total economy, again when we hold labor allocation constant and weight each sector by its initial output share. It was named as “productivity growth rate” by Bernard and Jones and defined as: “captures the contribution of within sector labor productivity growth for state,
using the average sectoral labor shares over the period in question as weights.”
(Bernard & Jones, 1996, p.122)
Total Shift Effect: It stands in order to capture the effect on growth which appears as a consequence of reallocations of labor across sectors, when we hold relative productivity of each sector constant. The sign of total shift effect will be interpreted as follows; positive means sector that are above average in labor productivity are increasing their share; negative sign means sector that above average in productivity decreasing their employment shares in total employment. Total Interaction Effect: This part of the equation captures both increase in employment share and productivity of a sector. Hence will be defined as the covariance of the first two effect. Positive sign of total interaction effect will be interpreted as sectors that increase labor productivity more speedy than average have increasing employment shares, negative sign indicate that those sectors employment share decline over examined period.
4.1.2. Convergence of Labor Productivity
In order to stress convergence hypothesis, several methods have been established. Here, in our analysis we will only use cross section analysis or in other words -convergence. During analysis, below regression equation has been used;
(2)
28
In equation (2) gross growth in labor productivity level over 2004-2011 period is in left hand side in region . is the intercepts, is the coefficient estimate on the logarithm of initial labor productivity level and is an error term. Here, captures the convergence rate, needless to say, it has to be statistically significant and negative when convergence takes place. Positive and significant coefficient indicates divergence across regions. When we regress equation (2) without any control variable we check the absolute convergence hypothesis. 4.1.3. Convergence Rate Decomposition
Wei – Kang (2006) proposes -decomposition to directly decompose pre-found productivity convergence into components. These components are within shift effect, static shift effect, dynamic shift effect. As we explained above those components are decomposed from aggregate labor productivity growth in order to capture effect of change in labor allocation between sectors, labor productivity growth in specific region and both.
(3)
Where;
is aggregate convergence, the coefficient obtained by convergence regression. are the coefficient estimates obtained from regressing the subscripted component on initial labor productivity level. Basically, thanks to equation (3) we can understand which factors contribute to convergence; faster sectoral productivity growth, faster employment flows to the more productive sectors or both.
In this section of our study, we tried to present our methods that we use during our regional labor productivity analysis. In next section, we provide our results for each analysis and interpret the results.
29
4.2. Results
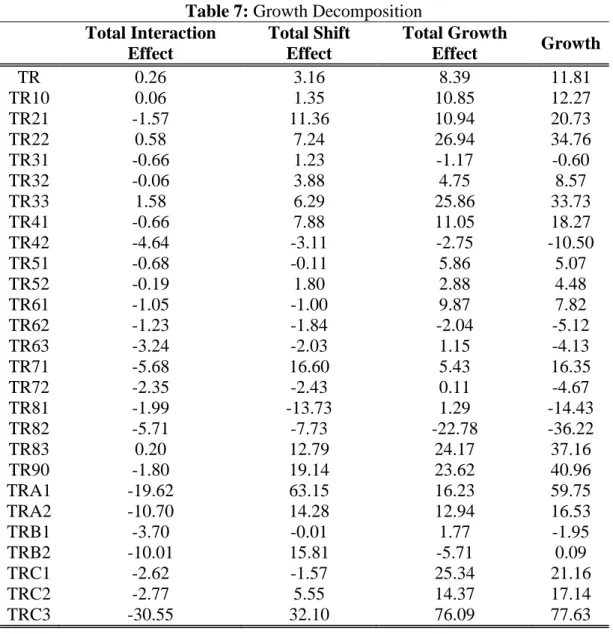
In table 7 we present growth decomposition results of regions and Turkey. Decomposing total labor productivity shows that 71 percent of the aggregate labor productivity comes from total growth effect in Turkey. It means, substantial amount of labor productivity growth emerged as a consequence of increased productivity in sectors rather than more efficient allocation of labor force among sectors. More effective reallocation of labor force contributes 26 percent to gross labor productivity growth in Turkey. Contribution of dynamic effect is only 2.17 percent to the total labor productivity over 2004- 2011 period.
When we analyze regions we see that in most regions main contributor of aggregate labor productivity is total growth effect. Only in six out of 26 regions (TR21, TR31, TR71, TRA1, TRA2, TRB2) total shift effect makes higher contribution to aggregate growth. On the other hand, only in five regions’ in-sector productivity movement is deteriorating aggregate growth, at remaining regions it has positive effect on growth. Henceforth we can say that overall, the main driving force of regional productivity growth is in-sector productivity increase rather than better allocation of labor force between sectors.
In 10 regions, re-allocation of labor force between sectors is deteriorating aggregate labor productivity growth. For instance in TR63 (Hatay, Kahramanmaraş, Osmaniye) despite positive total growth effect, due to negative signs of both total shift effect and total interaction effect aggregate labor productivity shrinks over 2004-2011. It will be interpreted as increasing in-sector labor productivity cannot compensates lowering labor productivity arise as a consequence of inefficient labor force allocation.
Another interesting point is in TRB2 (Van, Muş, Bitlis Hakkari) even though lowering productivity performance in-sectors, due to better allocation of labor force among sectors and higher increase of labor share in faster growing regions aggregate labor productivity has grown. It means even if a low productive sector
30
that shows little productivity movement, it could still contribute to aggregate productivity performance by freeing labor for more productive sector
On the other hand, from decomposition table we capture that in most regions contribution of total interaction effect to aggregate labor productivity is very small or negative. In 22 regions out of 26, total interaction effect is deteriorating aggregate labor productivity. In remaining regions, the size of effect is very slight compared to total growth effect and shift effect. It means, in Turkey, regions are not successful in terms of increasing the employment share of the sectors that improve labor productivity.
Table 7: Growth Decomposition Total Interaction Effect Total Shift Effect Total Growth Effect Growth TR 0.26 3.16 8.39 11.81 TR10 0.06 1.35 10.85 12.27 TR21 -1.57 11.36 10.94 20.73 TR22 0.58 7.24 26.94 34.76 TR31 -0.66 1.23 -1.17 -0.60 TR32 -0.06 3.88 4.75 8.57 TR33 1.58 6.29 25.86 33.73 TR41 -0.66 7.88 11.05 18.27 TR42 -4.64 -3.11 -2.75 -10.50 TR51 -0.68 -0.11 5.86 5.07 TR52 -0.19 1.80 2.88 4.48 TR61 -1.05 -1.00 9.87 7.82 TR62 -1.23 -1.84 -2.04 -5.12 TR63 -3.24 -2.03 1.15 -4.13 TR71 -5.68 16.60 5.43 16.35 TR72 -2.35 -2.43 0.11 -4.67 TR81 -1.99 -13.73 1.29 -14.43 TR82 -5.71 -7.73 -22.78 -36.22 TR83 0.20 12.79 24.17 37.16 TR90 -1.80 19.14 23.62 40.96 TRA1 -19.62 63.15 16.23 59.75 TRA2 -10.70 14.28 12.94 16.53 TRB1 -3.70 -0.01 1.77 -1.95 TRB2 -10.01 15.81 -5.71 0.09 TRC1 -2.62 -1.57 25.34 21.16 TRC2 -2.77 5.55 14.37 17.14 TRC3 -30.55 32.10 76.09 77.63
31
Above table also shows that there is wide dispersion across regions in terms of not only aggregate labor productivity growth level but also in terms of structure of the growth. In other words, the main source of the growth changes region by region. Hence we can say that regions are heterogeneous in terms of both growth rate and in growth pattern; in some regions, change in employment shares leads improvement in aggregate labor productivity, in some others in-sector improvements leads.
Here when we compare the results of growth decomposition with employment statistics (see annex for tables) we realize some interesting points. For instance, as we said, in general, total growth effect dominates the aggregate labor productivity growth of regions. Our examination shows that on average it is a consequence of dismissal of labor force in agriculture sector. The dismissal of employed people increases the labor productivity in agriculture sector thus aggregate labor productivity and total growth effect. The point is if dismissal of labor force in agriculture sector follow increase in number of employed people in more productive sectors such as industry and service, total share effect increase as well. We faced with this situation in TRA1 (Erzurum, Erzincan, Bayburt) region. Here, aggregate labor productivity growth is 59.75 which is substantially higher than Turkey and average of regions. In addition the share effects share on aggregate labor productivity is 63 percent which is again substantially higher compared to remaining regions’ share effects. The underlying reason of jump in aggregate labor productivity growth will be nearly a hundred percent increase in total unemployment rate when we come to 2011 from 2004. Furthermore, in industry sector which is nearly most productive sector, number of employed people increase 130 percent from 2004 to 2011. Henceforth total share effect is that much increased. Basically, dismissal of people in lower productive sector and expansion of employment in industry sector lead both higher share effect and higher aggregate labor productivity growth. This fact that obtained from region level employment statistics basically validate the decomposition model and the suggested interpretation of decomposition results.
32
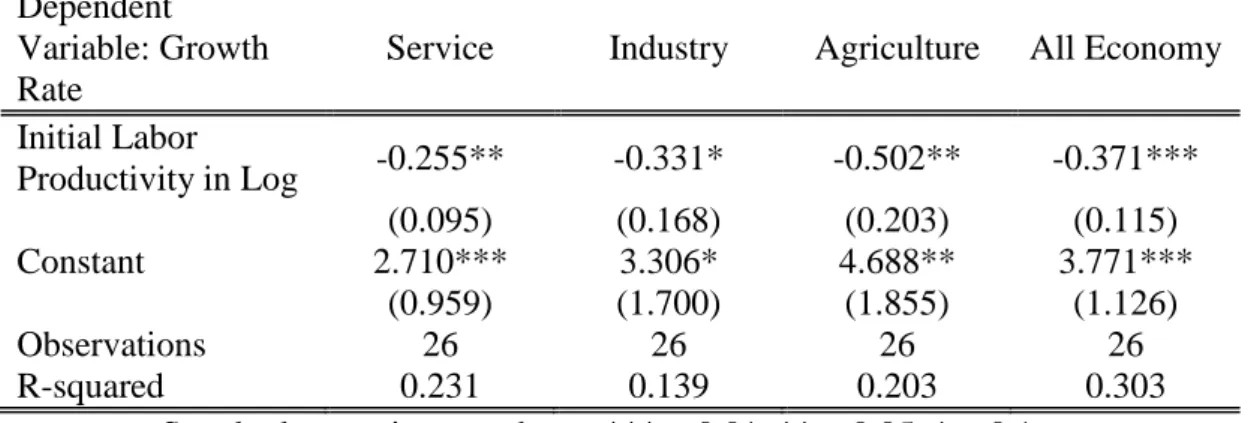
In order to answer the questions “does convergence takes place across regions and what is the rate of convergence?”; we present table 8 which exhibits results of cross section convergence analysis. Our OLS results show that regions are converging each other without any condition. As seen from table 8 that all coefficients are negative and statistically significant. This analysis, validate that convergence hypothesis holds for regions of Turkey.
According to results, in all measures, in aggregate labor productivity, service, industry, agriculture sectors; convergence takes place across regions, but the significance level and the speed of convergence varies across sectors. The most significant coefficient obtained in aggregate level. The coefficient indicates that over 2004-2011 period regions converge each other 37 percent in gross manner. It corresponds to average 4.62 percent convergence for each year. When we compare sectors in terms of convergence speed, agriculture sector seems like leader. It is expected because in coefficient of variation analysis we see that between 2004- 2011 period heterogeneity decreased at most in agriculture sector. Yet, the significance level of agriculture sector is lower than aggregate economy. The difference between coefficient estimates’ of all economy (Coeff= -0.371, SE= 0.115) and agriculture (Coeff=-0.502, SE=0.203) is statistically significant; t(50)=2.8630, p-value=0.001. Over 2004- 2011 period, in agriculture sector convergence rate is 50 percent. It corresponds to on average 6.25 percent convergence per year. As expected, in service and industry sector, convergence rate is lower than agriculture. The difference between convergence speed of service and industry sector is significantly lower than agriculture sector. In service sector convergence rate is 25 percent which corresponds to 3.12 percent convergence per year; in industry sector convergence rate is 33 percent which corresponds to 4.12 percent per year. The difference between coefficients of service sector (Coeff=-0.255, SE= 0.095) and coefficient of industry sector (Coeff=-0.331, SE= 0.168) is not statistically significant; t(50)= 2.001, p-value= 0.0501.
33
Table 8: Convergence Regression Results Dependent
Variable: Growth Rate
Service Industry Agriculture All Economy Initial Labor Productivity in Log -0.255** -0.331* -0.502** -0.371*** (0.095) (0.168) (0.203) (0.115) Constant 2.710*** 3.306* 4.688** 3.771*** (0.959) (1.700) (1.855) (1.126) Observations 26 26 26 26 R-squared 0.231 0.139 0.203 0.303
Standard errors in parentheses ***p<0.01, **p<0.05, *p<0.1
In order to understand the importance of each sectors and growth components on convergence rate, we decompose the coefficient obtained via convergence regression. Our results show that productivity growth in agriculture sector contributes to aggregate convergence 40 percent (0.15/0.37*100). The estimated effect of productivity growth in agriculture sector is statistical significant at %5 level. Productivity growth in services accounted for 0.1 percent point which corresponds 27 percent of aggregate convergence. The effect is again statistically significant. Between sectors, growth in industry sector has smallest contribution to aggregate convergence. In addition, in contrast to other sectors the direction of effect is negative. Yet, the significance level of coefficient is very low, henceforth the result should be interpreted cautious.
Also, effect of in-sector productivity growth on aggregate convergence is 0.20 percent point. It means 54 percent of convergence come from total growth effect. And agriculture sector is the driving force of presented convergence across regions.
The estimated coefficient of shift effect is bigger than any other components but the difference between coefficient of shift effect (Coeff=-0.250, SE=0.069) and coefficient of growth effect (Coeff=-0.208, SE=0.924) is statistically insignificant; t(50)=1.8511, p-value=0.0693. These results show that re-allocation of labor force between sectors and in-sector productivity growth has similar effects on aggregate convergence.
34
It will be interpreted as, the main contributor of the found convergence is agriculture between sectors; between growth components share effect and growth effect make same contribution to the aggregate convergence.
Table 9: Beta Decomposition of Aggregate Convergence During 2004- 2011
Dependent Variable Beta St. Error N R-sq
Productivity Growth in Agriculture Sector -0.150** (0.0717) 26 0.154 Productivity Growth in Service Sector -0.100*** (0.0355) 26 0.249 Productivity Growth in Industry Sector 0.042* (0.0245) 26 0.109 Total Growth Effect -0.208** (0.0924) 26 0.174 Total Shift Effect -0.250*** (0.0691) 26 0.352 Total Interaction Effect 0.087** (0.0363) 26 0.192
Standard errors in parentheses ***p<0.01, **p<0.05, *p<0.1
In this part of our study, we present our growth decomposition results that indicate the roots of aggregate labor productivity growth, results of convergence analysis that shows less productive regions’ labor productivity level growing faster than more productive regions and -decomposition results indicate the importance of the each factors contribute aggregate labor productivity convergence between 2004- 2011 years.
35
Chapter 5
Conclusion
This thesis studies the aggregate and sector specific economic disparity across regions’ of Turkey between 2004-2011. Our results can be highlighted with the following xx points.
Firstly, our descriptive analysis shows that both in value added and employment, Istanbul has the largest share and it leads the heterogeneity across regions. In value added and employment distribution, the density of Istanbul is striking, especially, in the industrial and service sector. On the other hand, in agricultural sector, Istanbul drops to have only a slight share of total value added and employment. Regional distribution of agricultural value added and employment is much more homogenous compared to industry and service sector.
Secondly, we observe productivity performance to vary widely both across regions and sectors. On average across the regions, in 2004 while industry records the highest productivity among the three sectors, it looses its superiority in 2011 to the service sector. During the examined time span, agriculture is the least productive sector. In addition to this, with regards to the disparity of labor productivity across regions, we see that variation across regions is significantly high, however, diminishing over time. Despite the diminishing variation across regions’ productivity performance, in the agricultural sector the disparity persists. Thirdly, we stress the productivity pattern of regions and realize that in most of the regions driving force of productivity improvement is in-sector performance growth. The underlying reason of superiority of growth effect is substantial improvement of labor productivity level in agriculture sector. Bulk labor dismissal in agriculture sector in several regions seems as reason behind that movement. But
36
again, growth pattern of regions are heterogeneous. In some regions, better labor allocation is driving the performance improvements which is consequence of placement of labor force in service or industry sector after dismissed from agriculture sector.
Fourthly, found, diminishing variation in labor productivity levels motivate the idea of convergence. Henceforth, we examine convergence hypothesis and realize that regions are converging each other but between sectors, convergence speed is varying. In addition, owe to beta decomposition we have revealed the contribution of each sectors and growth components to the aggregate convergence. Our results show that the main contributor of the convergence is agriculture between sectors. Contrary, industry sector exhibits negative effect on aggregate convergence. Moreover, we measure the effects of structural changes on aggregate convergence and see that re –allocation of labor force between sectors and growth effect do have significant contribution on aggregate labor productivity convergence. When we combine findings obtained by beta decomposition and employment statistics, we can say that convergence takes place as a consequence of massive labor dismissal in agriculture sector; and the re-allocation of those dismissed labors in service and industry sector.
Overall, we find convergence and diminishing variation across regions. Even though the related literature, whose study periods cover 1975-2004 period, indicates persistent regional divergence, this study is the first to show that regional disparities are diminishing over the period of 2004-2011. Owing to found convergence, it is the first study to underline the reasons behind convergence. Although decomposition results indicate improvements in agricultural labor productivity as a reason behind convergence, we see that above those parameters bulk dismissal of people works in agriculture sector is the key reason of found convergence.