STRONG INCREASES CONTINUE
BOTH IN EMPLOYMENT AND IN LABOR FORCE
Seyfettin Gürsel* Gökçe Uysal∗∗ ve Ayşenur Acar∗∗∗Abstract
According to the labor market data released by TurkSTAT, we observe sizeable increases in non-agricultural employment. However, unemployment on a year-on-year basis increased due to strong increases in labor force. Seasonally adjusted labor market data shows that the monthly unemployment rate has been stagnating. Non-agricultural unemployment rate remains at its previous level in the period of December 2012, i.e. it is still at 11.8 percent. Application per vacancy calculated by using Kariyer.net series indicates that stagnation in the non-agricultural unemployment rate will continue.
LABOR MARKET HIGHLIGHT Boom in Female Employment
A strong increase in female labor force participation is the pushing factor behind the increase in labor force. Parallel to this, we observe increases in both share of female employment in total employment and share of wage-earners in non-agricultural female employment. Despite this, we underline higher decline in female unemployment rate than total unemployment rate. This development shows that the common belief that increasing female labor force participation increases unemployment is unfounded.
Annual increase in non-agricultural labor force has been strengthening
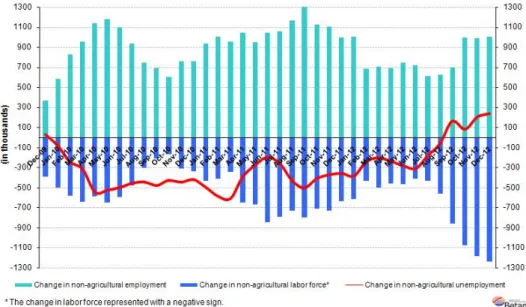
According to the data released by TurkSTAT, non-agricultural labor force increased by 1 million 237 thousand (6 percent), the non-agricultural employment increased by 1 million one thousand (5.5 percent) and non-agricultural unemployment increased by 236 thousand to 2 million 701 thousand persons in the period of December 2012 on a year-on-year basis (Figure 1). Despite an increase of over 1 million in non-agricultural employment, an even stronger increase in the non-agricultural labor force leads to an increase in non-agricultural unemployment.
Figure 1 Year-on-year changes in non-agricultural labor force, employment and unemployment
Source: TurkSTAT, Betam
* Prof. Dr. Seyfettin Gürsel, Betam, Director, [email protected]
∗∗ Yrd. Doç. Dr. Gökçe Uysal, Betam, Vice Director, [email protected] ∗∗∗ Ayşenur Acar, Betam, Research Assistant, [email protected]
Labor Market Outlook:
March 2013
Stagnation in seasonally adjusted non-agricultural unemployment continues
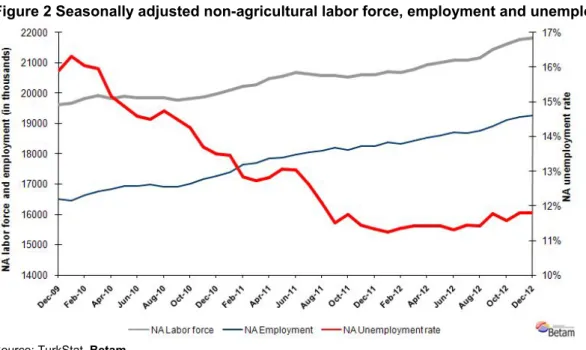
According to seasonally adjusted data, the non-agricultural labor force increased by 50 thousand to reach 21 million 829 thousand in the period of December 2012 compared to the period of November 2012 (Figure 2, Table 1). Non-agricultural employment increased by 44 thousand to reach 19 million 256 thousand. Consequently, the number of persons unemployed in non-agricultural sectors increased by 6 thousand and non-agricultural unemployment rate remained at 11.8 percent.
Figure 2 Seasonally adjusted non-agricultural labor force, employment and unemployment
Source: TurkStat, Betam
According to Kariyer.net data, stagnation in non-agricultural unemployment continues
Application per vacancy calculated by using series released by Kariyer.net indicates that the stagnation in non-agricultural unemployment rate will continue in the period of January 2013.1
Figure 1 Seasonally adjusted non-agricultural unemployment rate and application per vacancy
Source: Kariyer.net, TurkStat, Betam
1 Betam has been calculating application per vacancy using series released by Kariyer.net for a while. Seasonal and calendar adjustment
procedure is applied to application per vacancy series. A decrease in applications per vacancy may be caused by an increase in vacancies or by a decrease in the number of applications. An increase in vacancies signals economic growth while decreasing number of applications indicates a decrease in number of people looking for a job.
Manufacturing employment increased by 37 thousand
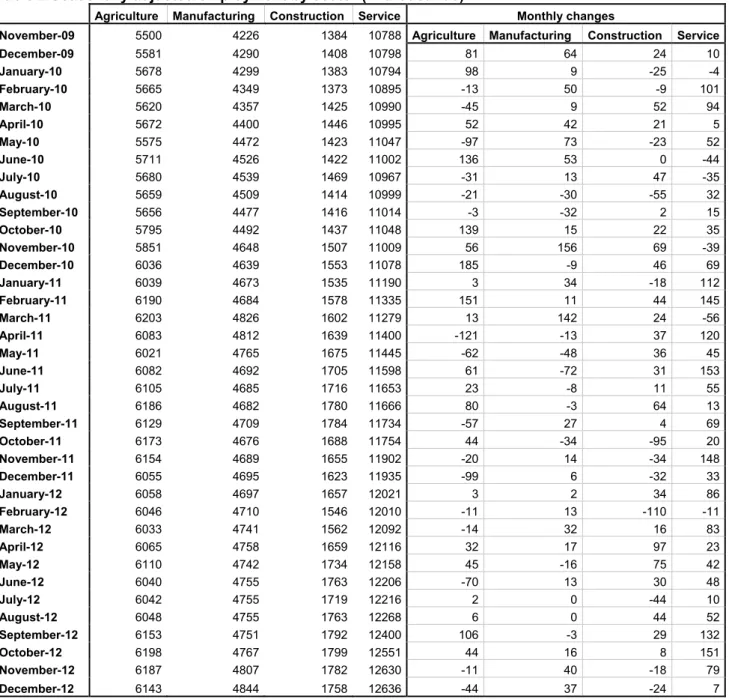
Seasonally adjusted data shows that employment in manufacturing increased by 37 thousand, while employment in services increased only by 7 thousand in the period of December 2012 compared to the period of November 2012 (Table 2, Figure 4).2 Employment in construction decreased by 24 thousand during the same period. When we consider the slight increase in the manufacturing production index, the increase in manufacturing employment is surprising, especially given that it has been stagnating for some time. However, we observe that employment in services stagnated in the period of December 2012. Let us keep a closer watch on this as the increase in services has been strong over a prolonged period.
Stagnation in agricultural employment continues in the period of December 2012. Structural transformation dictates that employment and production both shift away from agriculture towards non-agricultural sectors. We had
observed just the opposite from 2008 to 2011 as both increased. This seems to have stopped two years ago. However, we still do not observe a decline in agricultural employment.
2 Employment in each sector is seasonally adjusted separately. Hence the sum of these series may differ from the seasonally adjusted series of
Figure 2 Employment by sectors (in thousands)3
Source: TurkStat, Betam
LABOR MARKET HIGHLIGHT
Boom in Female Employment
We had observed strong increases in employment due to the high GDP growth rate after the crisis. We also know that the increases are mostly observed in non-agricultural sectors, especially in services. A less known fact is that the increase in female employment is main pushing force behind this development. Female labor force participation in non-agricultural sectors has accelerated after the crisis. Nevertheless, female unemployment rate decreased in line with the total unemployment rate. This shows that common belief that female unemployment increases with female labor force participation is unfounded.
Female labor force and employment have been rapidly increasing for 3 years
Figure A presents the evolution of seasonally adjusted non-agricultural female labor force, non-agricultural female employment and female wage earners from November 2009 to November 2012. Data points to an acceleration in the increase in non-agricultural female labor force. There are substantial increases in total female employment and female wage earners as well.
Figure A Seasonally adjusted female non-agricultural labor force and non-agricultural employment
Source: TurkStat; Betam
Let us examine these increases more closely by creating indices in which November 2009 constitutes the base. According to indices presented in Figure A, increase in employment has been considerably moving over the increase in labor force since the 4th quarter of 2010. While labor force increased by 26 percent in three years, employment increased by 31 percent. In other words, average annual increase in female employment is 9.5 percent, which is considerably higher than that before the crisis.
Another positive development is the increase in the share of female wage earners in total female employment. During the crisis, female employment increased among the self –employed group due to the added worker effect. Surprisingly, the recent increase is among the wage earners. Share of female wage earners in female non-agricultural employment increased from 82 percent in the period of November 2009 to 85 percent in the period of November 2012.
Decreasing trend in female unemployment rate
We underline that decline in female unempoyment rate is due to a higher increase in employment than that in the labor force. Figure B presents the seasonally adjusted female non-agricultural and total non-agricultural
unemployment rates. The data indicates that female non-agricultural unemployment rate decreased from about 21 percent in the late 2009 to about 16 percent in the first half of 2012. However, the decline seems to have stopped in the second half of 2012 and there is a small increase in female unemployment. Looking at monthly data may be misleading, especially if we concentrate on the medium term. However, we should keep an eye on the female unemployment rates in the future.
Figure B Seasonally adjusted non-agricultural unemployment rates
Source: TurkStat; Betam
Employment among uneducated and high educated females has been increasing more rapidly
Figure C presents both employment levels and employment indices based on November 2009 by education level. It is clear that female employment increased for all education levels, but note that the increase is not uniform across different education groups. Employment of university graduate women increased by 40 percent in three years, and this is not surprising. However, the second highest increase is not among women with high school degrees, but among women have less education (an increase by 30 percent). The increase in employment of high school graduate women is 18 percent. Moreover, it has been stagnant for a year. The differences across education levels are important and they should be studied more thoroughly.
Figure C Seasonally adjusted non-agricultural employment by education level
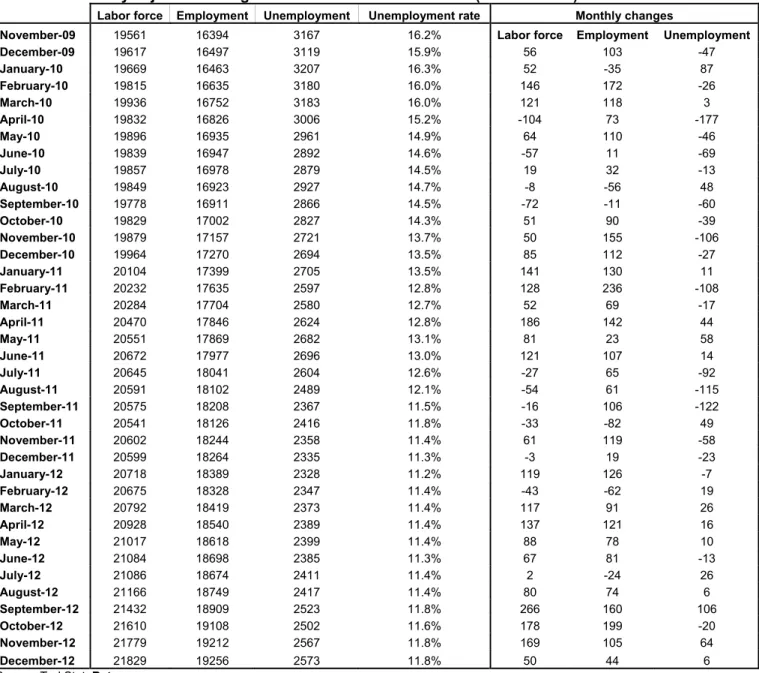
Table 1 Seasonally adjusted non-agricultural labor force indicators (in thousands)
Labor force Employment Unemployment Unemployment rate Monthly changes
November-09 19561 16394 3167 16.2% Labor force Employment Unemployment
December-09 19617 16497 3119 15.9% 56 103 -47 January-10 19669 16463 3207 16.3% 52 -35 87 February-10 19815 16635 3180 16.0% 146 172 -26 March-10 19936 16752 3183 16.0% 121 118 3 April-10 19832 16826 3006 15.2% -104 73 -177 May-10 19896 16935 2961 14.9% 64 110 -46 June-10 19839 16947 2892 14.6% -57 11 -69 July-10 19857 16978 2879 14.5% 19 32 -13 August-10 19849 16923 2927 14.7% -8 -56 48 September-10 19778 16911 2866 14.5% -72 -11 -60 October-10 19829 17002 2827 14.3% 51 90 -39 November-10 19879 17157 2721 13.7% 50 155 -106 December-10 19964 17270 2694 13.5% 85 112 -27 January-11 20104 17399 2705 13.5% 141 130 11 February-11 20232 17635 2597 12.8% 128 236 -108 March-11 20284 17704 2580 12.7% 52 69 -17 April-11 20470 17846 2624 12.8% 186 142 44 May-11 20551 17869 2682 13.1% 81 23 58 June-11 20672 17977 2696 13.0% 121 107 14 July-11 20645 18041 2604 12.6% -27 65 -92 August-11 20591 18102 2489 12.1% -54 61 -115 September-11 20575 18208 2367 11.5% -16 106 -122 October-11 20541 18126 2416 11.8% -33 -82 49 November-11 20602 18244 2358 11.4% 61 119 -58 December-11 20599 18264 2335 11.3% -3 19 -23 January-12 20718 18389 2328 11.2% 119 126 -7 February-12 20675 18328 2347 11.4% -43 -62 19 March-12 20792 18419 2373 11.4% 117 91 26 April-12 20928 18540 2389 11.4% 137 121 16 May-12 21017 18618 2399 11.4% 88 78 10 June-12 21084 18698 2385 11.3% 67 81 -13 July-12 21086 18674 2411 11.4% 2 -24 26 August-12 21166 18749 2417 11.4% 80 74 6 September-12 21432 18909 2523 11.8% 266 160 106 October-12 21610 19108 2502 11.6% 178 199 -20 November-12 21779 19212 2567 11.8% 169 105 64 December-12 21829 19256 2573 11.8% 50 44 6
Table 2 Seasonally adjusted employment by sector (in thousands)
Agriculture Manufacturing Construction Service Monthly changes
November-09 5500 4226 1384 10788 Agriculture Manufacturing Construction Service
December-09 5581 4290 1408 10798 81 64 24 10 January-10 5678 4299 1383 10794 98 9 -25 -4 February-10 5665 4349 1373 10895 -13 50 -9 101 March-10 5620 4357 1425 10990 -45 9 52 94 April-10 5672 4400 1446 10995 52 42 21 5 May-10 5575 4472 1423 11047 -97 73 -23 52 June-10 5711 4526 1422 11002 136 53 0 -44 July-10 5680 4539 1469 10967 -31 13 47 -35 August-10 5659 4509 1414 10999 -21 -30 -55 32 September-10 5656 4477 1416 11014 -3 -32 2 15 October-10 5795 4492 1437 11048 139 15 22 35 November-10 5851 4648 1507 11009 56 156 69 -39 December-10 6036 4639 1553 11078 185 -9 46 69 January-11 6039 4673 1535 11190 3 34 -18 112 February-11 6190 4684 1578 11335 151 11 44 145 March-11 6203 4826 1602 11279 13 142 24 -56 April-11 6083 4812 1639 11400 -121 -13 37 120 May-11 6021 4765 1675 11445 -62 -48 36 45 June-11 6082 4692 1705 11598 61 -72 31 153 July-11 6105 4685 1716 11653 23 -8 11 55 August-11 6186 4682 1780 11666 80 -3 64 13 September-11 6129 4709 1784 11734 -57 27 4 69 October-11 6173 4676 1688 11754 44 -34 -95 20 November-11 6154 4689 1655 11902 -20 14 -34 148 December-11 6055 4695 1623 11935 -99 6 -32 33 January-12 6058 4697 1657 12021 3 2 34 86 February-12 6046 4710 1546 12010 -11 13 -110 -11 March-12 6033 4741 1562 12092 -14 32 16 83 April-12 6065 4758 1659 12116 32 17 97 23 May-12 6110 4742 1734 12158 45 -16 75 42 June-12 6040 4755 1763 12206 -70 13 30 48 July-12 6042 4755 1719 12216 2 0 -44 10 August-12 6048 4755 1763 12268 6 0 44 52 September-12 6153 4751 1792 12400 106 -3 29 132 October-12 6198 4767 1799 12551 44 16 8 151 November-12 6187 4807 1782 12630 -11 40 -18 79 December-12 6143 4844 1758 12636 -44 37 -24 7