published as:
Study of χ_{cJ} decaying into ϕK^{*}(892)K[over ¯]
M. Ablikim et al. (BESIII Collaboration)
Phys. Rev. D 91, 112008 — Published 16 June 2015
DOI:
10.1103/PhysRevD.91.112008
M. Ablikim1, M. N. Achasov9,a, X. C. Ai1, O. Albayrak5, M. Albrecht4, D. J. Ambrose44, A. Amoroso48A,48C, F. F. An1,
Q. An45, J. Z. Bai1, R. Baldini Ferroli20A, Y. Ban31, D. W. Bennett19, J. V. Bennett5, M. Bertani20A, D. Bettoni21A,
J. M. Bian43, F. Bianchi48A,48C, E. Boger23,h, O. Bondarenko25, I. Boyko23, R. A. Briere5, H. Cai50, X. Cai1, O. Cakir40A,b,
A. Calcaterra20A, G. F. Cao1, S. A. Cetin40B, J. F. Chang1, G. Chelkov23,c, G. Chen1, H. S. Chen1, H. Y. Chen2,
J. C. Chen1, M. L. Chen1, S. J. Chen29, X. Chen1, X. R. Chen26, Y. B. Chen1, H. P. Cheng17, X. K. Chu31, G. Cibinetto21A,
D. Cronin-Hennessy43, H. L. Dai1, J. P. Dai34, A. Dbeyssi14, D. Dedovich23, Z. Y. Deng1, A. Denig22, I. Denysenko23,
M. Destefanis48A,48C, F. De Mori48A,48C, Y. Ding27, C. Dong30, J. Dong1, L. Y. Dong1, M. Y. Dong1, S. X. Du52,
P. F. Duan1, J. Z. Fan39, J. Fang1, S. S. Fang1, X. Fang45, Y. Fang1, L. Fava48B,48C, F. Feldbauer22, G. Felici20A,
C. Q. Feng45, E. Fioravanti21A, M. Fritsch14,22, C. D. Fu1, Q. Gao1, Y. Gao39, Z. Gao45, I. Garzia21A, C. Geng45,
K. Goetzen10, W. X. Gong1, W. Gradl22, M. Greco48A,48C, M. H. Gu1, Y. T. Gu12, Y. H. Guan1, A. Q. Guo1, L. B. Guo28,
Y. Guo1, Y. P. Guo22, Z. Haddadi25, A. Hafner22, S. Han50, Y. L. Han1, X. Q. Hao15, F. A. Harris42, K. L. He1, Z. Y. He30,
T. Held4, Y. K. Heng1, Z. L. Hou1, C. Hu28, H. M. Hu1, J. F. Hu48A,48C, T. Hu1, Y. Hu1, G. M. Huang6, G. S. Huang45,
H. P. Huang50, J. S. Huang15, X. T. Huang33, Y. Huang29, T. Hussain47, Q. Ji1, Q. P. Ji30, X. B. Ji1, X. L. Ji1, L. L. Jiang1,
L. W. Jiang50, X. S. Jiang1, J. B. Jiao33, Z. Jiao17, D. P. Jin1, S. Jin1, T. Johansson49, A. Julin43, N. Kalantar-Nayestanaki25,
X. L. Kang1, X. S. Kang30, M. Kavatsyuk25, B. C. Ke5, R. Kliemt14, B. Kloss22, O. B. Kolcu40B,d, B. Kopf4, M. Kornicer42,
W. K¨uhn24, A. Kupsc49, W. Lai1, J. S. Lange24, M. Lara19, P. Larin14, C. Leng48C, C. H. Li1, Cheng Li45, D. M. Li52,
F. Li1, G. Li1, H. B. Li1, J. C. Li1, Jin Li32, K. Li13, K. Li33, Lei Li3, P. R. Li41, T. Li33, W. D. Li1, W. G. Li1, X. L. Li33,
X. M. Li12, X. N. Li1, X. Q. Li30, Z. B. Li38, H. Liang45, Y. F. Liang36, Y. T. Liang24, G. R. Liao11, D. X. Lin14, B. J. Liu1,
C. X. Liu1, F. H. Liu35, Fang Liu1, Feng Liu6, H. B. Liu12, H. H. Liu16, H. H. Liu1, H. M. Liu1, J. Liu1, J. P. Liu50,
J. Y. Liu1, K. Liu39, K. Y. Liu27, L. D. Liu31, P. L. Liu1, Q. Liu41, S. B. Liu45, X. Liu26, X. X. Liu41, Y. B. Liu30, Z. A. Liu1,
Zhiqiang Liu1, Zhiqing Liu22, H. Loehner25, X. C. Lou1,e, H. J. Lu17, J. G. Lu1, R. Q. Lu18, Y. Lu1, Y. P. Lu1, C. L. Luo28,
M. X. Luo51, T. Luo42, X. L. Luo1, M. Lv1, X. R. Lyu41, F. C. Ma27, H. L. Ma1, L. L. Ma33, Q. M. Ma1, S. Ma1, T. Ma1,
X. N. Ma30, X. Y. Ma1, F. E. Maas14, M. Maggiora48A,48C, Q. A. Malik47, Y. J. Mao31, Z. P. Mao1, S. Marcello48A,48C,
J. G. Messchendorp25, J. Min1, T. J. Min1, R. E. Mitchell19, X. H. Mo1, Y. J. Mo6, C. Morales Morales14, K. Moriya19,
N. Yu. Muchnoi9,a, H. Muramatsu43, Y. Nefedov23, F. Nerling14, I. B. Nikolaev9,a, Z. Ning1, S. Nisar8, S. L. Niu1,
X. Y. Niu1, S. L. Olsen32, Q. Ouyang1, S. Pacetti20B, P. Patteri20A, M. Pelizaeus4, H. P. Peng45, K. Peters10, J. L. Ping28,
R. G. Ping1, R. Poling43, Y. N. Pu18, M. Qi29, S. Qian1, C. F. Qiao41, L. Q. Qin33, N. Qin50, X. S. Qin1, Y. Qin31,
Z. H. Qin1, J. F. Qiu1, K. H. Rashid47, C. F. Redmer22, H. L. Ren18, M. Ripka22, G. Rong1, X. D. Ruan12, V. Santoro21A,
A. Sarantsev23,f, M. Savri´e21B, K. Schoenning49, S. Schumann22, W. Shan31, M. Shao45, C. P. Shen2, P. X. Shen30,
X. Y. Shen1, H. Y. Sheng1, W. M. Song1, X. Y. Song1, S. Sosio48A,48C, S. Spataro48A,48C, G. X. Sun1, J. F. Sun15,
S. S. Sun1, Y. J. Sun45, Y. Z. Sun1, Z. J. Sun1, Z. T. Sun19, C. J. Tang36, X. Tang1, I. Tapan40C, E. H. Thorndike44,
M. Tiemens25, D. Toth43, M. Ullrich24, I. Uman40B, G. S. Varner42, B. Wang30, B. L. Wang41, D. Wang31, D. Y. Wang31,
K. Wang1, L. L. Wang1, L. S. Wang1, M. Wang33, P. Wang1, P. L. Wang1, Q. J. Wang1, S. G. Wang31, W. Wang1, X. F.
Wang39, Y. D. Wang20A, Y. F. Wang1, Y. Q. Wang22, Z. Wang1, Z. G. Wang1, Z. H. Wang45, Z. Y. Wang1, T. Weber22,
D. H. Wei11, J. B. Wei31, P. Weidenkaff22, S. P. Wen1, U. Wiedner4, M. Wolke49, L. H. Wu1, Z. Wu1, L. G. Xia39, Y. Xia18,
D. Xiao1, Z. J. Xiao28, Y. G. Xie1, Q. L. Xiu1, G. F. Xu1, L. Xu1, Q. J. Xu13, Q. N. Xu41, X. P. Xu37, Z. R. Xu45,i, L. Yan45,
W. B. Yan45, W. C. Yan45, Y. H. Yan18, H. X. Yang1, L. Yang50, Y. Yang6, Y. X. Yang11, H. Ye1, M. Ye1, M. H. Ye7,
J. H. Yin1, B. X. Yu1, C. X. Yu30, H. W. Yu31, J. S. Yu26, C. Z. Yuan1, W. L. Yuan29, Y. Yuan1, A. Yuncu40B,g,
A. A. Zafar47, A. Zallo20A, Y. Zeng18, B. X. Zhang1, B. Y. Zhang1, C. Zhang29, C. C. Zhang1, D. H. Zhang1, H. H. Zhang38,
H. Y. Zhang1, J. J. Zhang1, J. L. Zhang1, J. Q. Zhang1, J. W. Zhang1, J. Y. Zhang1, J. Z. Zhang1, K. Zhang1, L. Zhang1,
S. H. Zhang1, X. Y. Zhang33, Y. Zhang1, Y. H. Zhang1, Y. T. Zhang45, Z. H. Zhang6, Z. P. Zhang45, Z. Y. Zhang50,
G. Zhao1, J. W. Zhao1, J. Y. Zhao1, J. Z. Zhao1, Lei Zhao45, Ling Zhao1, M. G. Zhao30, Q. Zhao1, Q. W. Zhao1,
S. J. Zhao52, T. C. Zhao1, Y. B. Zhao1, Z. G. Zhao45, A. Zhemchugov23,h, B. Zheng46, J. P. Zheng1, W. J. Zheng33,
Y. H. Zheng41, B. Zhong28, L. Zhou1, Li Zhou30, X. Zhou50, X. K. Zhou45, X. R. Zhou45, X. Y. Zhou1, K. Zhu1, K. J. Zhu1,
S. Zhu1, X. L. Zhu39, Y. C. Zhu45, Y. S. Zhu1, Z. A. Zhu1, J. Zhuang1, L. Zotti48A,48C, B. S. Zou1, J. H. Zou1
(BESIII Collaboration)
1 Institute of High Energy Physics, Beijing 100049, People’s Republic of China
2 Beihang University, Beijing 100191, People’s Republic of China
3 Beijing Institute of Petrochemical Technology, Beijing 102617, People’s Republic of China
4 Bochum Ruhr-University, D-44780 Bochum, Germany
5 Carnegie Mellon University, Pittsburgh, Pennsylvania 15213, USA
6 Central China Normal University, Wuhan 430079, People’s Republic of China
7 China Center of Advanced Science and Technology, Beijing 100190, People’s Republic of China
8 COMSATS Institute of Information Technology, Lahore, Defence Road, Off Raiwind Road, 54000 Lahore, Pakistan
9 G.I. Budker Institute of Nuclear Physics SB RAS (BINP), Novosibirsk 630090, Russia
10GSI Helmholtzcentre for Heavy Ion Research GmbH, D-64291 Darmstadt, Germany
11 Guangxi Normal University, Guilin 541004, People’s Republic of China
12 GuangXi University, Nanning 530004, People’s Republic of China
13 Hangzhou Normal University, Hangzhou 310036, People’s Republic of China
15 Henan Normal University, Xinxiang 453007, People’s Republic of China
16 Henan University of Science and Technology, Luoyang 471003, People’s Republic of China
17Huangshan College, Huangshan 245000, People’s Republic of China
18Hunan University, Changsha 410082, People’s Republic of China
19 Indiana University, Bloomington, Indiana 47405, USA
20(A)INFN Laboratori Nazionali di Frascati, I-00044, Frascati, Italy; (B)INFN and University of Perugia, I-06100, Perugia,
Italy
21 (A)INFN Sezione di Ferrara, I-44122, Ferrara, Italy; (B)University of Ferrara, I-44122, Ferrara, Italy
22Johannes Gutenberg University of Mainz, Johann-Joachim-Becher-Weg 45, D-55099 Mainz, Germany
23 Joint Institute for Nuclear Research, 141980 Dubna, Moscow region, Russia
24 Justus Liebig University Giessen, II. Physikalisches Institut, Heinrich-Buff-Ring 16, D-35392 Giessen, Germany
25 KVI-CART, University of Groningen, NL-9747 AA Groningen, The Netherlands
26Lanzhou University, Lanzhou 730000, People’s Republic of China
27Liaoning University, Shenyang 110036, People’s Republic of China
28 Nanjing Normal University, Nanjing 210023, People’s Republic of China
29 Nanjing University, Nanjing 210093, People’s Republic of China
30Nankai University, Tianjin 300071, People’s Republic of China
31 Peking University, Beijing 100871, People’s Republic of China
32Seoul National University, Seoul, 151-747 Korea
33Shandong University, Jinan 250100, People’s Republic of China
34Shanghai Jiao Tong University, Shanghai 200240, People’s Republic of China
35 Shanxi University, Taiyuan 030006, People’s Republic of China
36 Sichuan University, Chengdu 610064, People’s Republic of China
37 Soochow University, Suzhou 215006, People’s Republic of China
38Sun Yat-Sen University, Guangzhou 510275, People’s Republic of China
39Tsinghua University, Beijing 100084, People’s Republic of China
40 (A)Istanbul Aydin University, 34295 Sefakoy, Istanbul, Turkey; (B)Dogus University, 34722 Istanbul, Turkey; (C)Uludag
University, 16059 Bursa, Turkey
41 University of Chinese Academy of Sciences, Beijing 100049, People’s Republic of China
42 University of Hawaii, Honolulu, Hawaii 96822, USA
43University of Minnesota, Minneapolis, Minnesota 55455, USA
44University of Rochester, Rochester, New York 14627, USA
45 University of Science and Technology of China, Hefei 230026, People’s Republic of China
46 University of South China, Hengyang 421001, People’s Republic of China
47 University of the Punjab, Lahore-54590, Pakistan
48 (A)University of Turin, I-10125, Turin, Italy; (B)University of Eastern Piedmont, I-15121, Alessandria, Italy; (C)INFN,
I-10125, Turin, Italy
49 Uppsala University, Box 516, SE-75120 Uppsala, Sweden
50Wuhan University, Wuhan 430072, People’s Republic of China
51Zhejiang University, Hangzhou 310027, People’s Republic of China
52Zhengzhou University, Zhengzhou 450001, People’s Republic of China
a Also at the Novosibirsk State University, Novosibirsk, 630090, Russia
bAlso at Ankara University, 06100 Tandogan, Ankara, Turkey
c Also at the Moscow Institute of Physics and Technology, Moscow 141700, Russia and at the Functional Electronics
Laboratory, Tomsk State University, Tomsk, 634050, Russia
d
Currently at Istanbul Arel University, 34295 Istanbul, Turkey
e Also at University of Texas at Dallas, Richardson, Texas 75083, USA
f Also at the PNPI, Gatchina 188300, Russia
g Also at Bogazici University, 34342 Istanbul, Turkey
hAlso at the Moscow Institute of Physics and Technology, Moscow 141700, Russia
iCurrently at Ecole Polytechnique F´ed´erale de Lausanne (EPFL), CH-1015 Lausanne, Switzerland
Using a data sample of 106 million ψ(3686) events collected with the BESIII detector operated
at the BEPCII storage ring, we study for the first time the decay χcJ →φKS0K±π∓ and χcJ →
φK+K−π0in the E1 radiative transition ψ(3686) → γχ
cJ. The decays are dominated by the
three-body decay χcJ →φK∗(892) ¯K. We measure branching fractions for this reaction via the neutral
and charged K∗(892) and find them consistent with each other within the expectation of isospin
symmetry. In the K ¯Kπ invariant mass distribution a structure near the K∗(892) ¯K mass threshold is
observed, and the corresponding mass and width are measured to be 1412±4(stat.)±8(sys.) MeV/c2
and Γ = 84 ± 12(stat.) ± 40(sys.) MeV, respectively. The observed state favors an assignment to
the h1(1380), considering its possible JP C and comparing its mass, width and decay mode to those
PACS numbers: 13.20.Gd, 13.25.Gv, 14.40.Pq
I. INTRODUCTION
It is well known that the heavy-quark mass provides a natural boundary between the perturbative and non-perturbative regimes. Quarkonium systems are regarded as a unique laboratory to study the interplay between perturbative and nonperturbative effects in Quantum Chromodynamics (QCD). Exclusive quarkonium decays constitute an important basis for investigating these ef-fects. Unlike the J/ψ and ψ(3686), the P-wave
char-monia states χcJ (J = 0, 1, 2) are not directly
pro-duced in e+e− collisions, thus are less well understood
to date [1]. Obtaining more experimental data on
exclu-sive decays of these χcJ states is important for a better
understanding of their nature and decay mechanisms, as well as for testing QCD based calculations. Exclusive charmonium decays have been investigated widely within
QCD. The dominant dynamical mechanism is c¯c quark
annihilation into the minimal number of gluons allowed by symmetries followed by the creation of light quark-antiquark pairs, which form the final state hadrons [2].
The χcJ states are expected to annihilate into two
glu-ons. Predictions by the color singlet model give smaller decay widths than those determined experimentally [3– 5], while much better predictions can be obtained if the
color octet state is taken into account [6, 7]. Since the χcJ
states are produced copiously in the E1 radiative transi-tion of ψ(3686), with branching fractransi-tions around 9% [1], the large ψ(3686) data sample taken with the Beijing Spectrometer (BESIII) located at the Beijing Electron-Positron Collider (BEPCII) provides a unique
opportu-nity for detailed studies of χcJ exclusive decays.
In the quark model, 22 s¯s sector resonances,
collec-tively called strangeonia, are expected below 2.2 GeV/c2.
So far only 7 states are widely accepted experimentally,
counting the maximally mixed η − η′ as one s¯s state [8].
The axial-vector candidate, h1(1380), is assigned as the
s¯s partner of the 11P
1 states, h1(1170), considering its
mass and dominant decay to the K∗(892)K final state.
Experimentally, h1(1380) has been reported in a
Par-tial Wave Analysis (PWA) only by LASS [9] and Crystal Barrel [10]. The nature of this state is still controversial with respect to the predictions made by considering the mixing between SU (3)-singlet and SU (3)-Octet mesons
in the 13P
1 and 11P1 nonets [11] or those made by a
relativized quark model [12]. The mass determined by the LASS measurement is significantly smaller than the theory prediction. If the LASS result is confirmed, the
h1(1380) would seem too light to be the 11P1 s¯s
mem-ber. The Crystal Barrel results are consistent with
the-ory predictions, which means that h1(1380) could be a
convincing candidate to be the s¯s partner of the 11P
1
state h1(1170). The measurement of the total width of
the h1(1380) is thought to be complicated by the nearby
K∗(892) ¯K threshold, where the mass distribution and
effective width can not be well described with a tra-ditional Breit-Wigner form. The direct observation of
the h1(1380) in experiments and the precise
measure-ment of its resonance parameters may shed light on its nature and aid in identifying the ground state axial-vector meson nonet in the quark model. Due to con-servation of angular momentum and parity, the axial-vector strangeonia candidates are not produced in J/ψ (ψ(3686)) radiative decays, but are expected to be
pro-duced through the hadronic decay of χcJ associated with
a vector meson φ or in J/ψ (ψ(3686)) decays with a
pseudoscalar meson η′ (η). In this paper, we report
the first measurement of the decay χcJ → φKS0K±π∓
and χcJ → φK+K−π0 in the electric dipole (E1)
radia-tive transition ψ(3686) → γχcJ. In the following text,
if not specified, K∗(892) ¯K denotes K∗(892)0K¯0 and its
isospin-conjugate state K∗(892)±K∓, while K ¯Kπ
de-notes both K0
SK±π∓ and K+K−π0. The charge
con-jugated channel is always implied. This analysis is based
on a data sample of 1.06 × 10⁸ ψ(3686) events collected
with the BESIII detector at the BEPCII. Data with an
additional integrated luminosity of 44.5 pb−1 [13] at a
center-of-mass energy of √s = 3.65 GeV are used to
study continuum contributions.
II. BESIII DETECTOR
The BESIII detector, described in detail in Ref. [14], has an effective geometrical acceptance of 93% of 4π. It contains a small cell helium-based main drift cham-ber (MDC) which provides momentum measurements of charged particles; a time-of-flight system (TOF) based on plastic scintillator which helps to identify charged par-ticles; an electromagnetic calorimeter (EMC) made of CsI(Tl) crystals used to measure the energies of photons and provide trigger signals; and a muon system (MUC) made of Resistive Plate Chambers (RPC) located in the iron flux return yoke of the superconducting solenoid. The momentum resolution of the charged particles is 0.5% at 1 GeV/c in a 1 Tesla magnetic field. The energy loss (dE/dx) measurement provided by the MDC has a resolution better than 6% for electrons from Bhabha scat-tering. The time resolution of the TOF is 80 ps (110 ps) in the barrel (endcaps). The photon energy resolution is 2.5% (5%) at 1 GeV in the barrel (endcaps) of the EMC. Monte Carlo (MC) simulated events are used to de-termine the detection efficiency, optimize the selection criteria, and study possible backgrounds. A GEANT4-based [15] MC simulation software, which includes the geometric and material descriptions of the BESIII de-tector, the detector response, and digitization models as well as the detector running conditions and perfor-mance, is used to generate MC samples. The ψ(3686) resonance is simulated with the kkmc [16] generator,
which is an event generator based on precise predic-tions of the Electroweak Standard Model for the process
e+e− → ff + nγ, f = µ, τ, d, u, s, c, b. The beam energy
spread and initial state radiation (ISR) are taken into ac-count in the simulation. The subsequent decay processes are generated with EvtGen [18]. Background studies
are based on a sample of 108 ψ(3686) inclusive decays,
generated with the known branching fractions taken from the the Particle Data Group (PDG) [1], or with
lund-charm[19] for the unknown decays.
III. EVENT SELECTION
Charged particles are reconstructed from hits in the MDC. Charged tracks are required to be within the ac-ceptance of the MDC, satisfying | cos θ| < 0.93. For each track, the point of closest approach to the interaction point (IP) must be within 1 cm in the plane perpendic-ular to the beam direction and within ±10 cm along the beam direction. Particle identification (PID) is carried out by combining information from the MDC and TOF. PID probabilities (prob(i)) are calculated for each track according to different particle hypotheses i (i = π, K and p). To be identified as a kaon, a track is required to have prob(K) > prob(π) and prob(K) > prob(p), while pion candidates are required to satisfy prob(π) > prob(K) and prob(π) > prob(p).
Photon candidates are reconstructed from isolated showers in the EMC. Each photon candidate is required to have a minimum energy of 25 MeV in the EMC barrel region (| cos θ| < 0.8) or 50 MeV in the endcap region (0.86 < | cos θ| < 0.92). In order to improve the recon-struction efficiency and the energy resolution, the energy deposited in the nearby TOF counters is included in the photon reconstruction. The timing information from the EMC is used to further suppress electronic noise and en-ergy deposition unrelated to the event of interest.
K0
Scandidates are reconstructed with all combinations
of two oppositely charged tracks (without a requirement on the point of closest approach to the IP), assuming both tracks to be pions. A secondary vertex fit is performed
for each combination. Each K0
S candidate is required to
have an invariant mass that satisfies |Mπ+π−− MK0
S| <
10 MeV/c2and a decay length two times larger than its
fit error, where MK0
S is the nominal mass of K
0
S taken
from the PDG [1]. If more than one K0
S is reconstructed
within an event, the one with the minimum |Mπ+π− −
MK0
S| is selected for further analysis.
π0 candidates are reconstructed from pairs of
pho-tons whose invariant mass satisfies [Mπ0− 60] < Mγγ <
[Mπ0+40] MeV/c2, where Mπ0is the nominal mass of π0
taken from the PDG [1]. An asymmetrical mass window
is used for π0 reconstruction because the photon energy
deposited in the EMC has a long tail on the low energy side. A kinematic fit is performed on the selected photon
pairs by constraining their invariant mass to the π0mass
(1C fit). The χ2
1C from this kinematic fit is required to
be less than 25. To remove backgrounds in which the π0
is falsely reconstructed from a high energy photon paired with a spurious shower, a restriction is imposed on the
decay angle | cos θdecay| < 0.95, where θdecay is the polar
angle of each photon in the π0 rest frame with respect
to the π0 direction in the ψ(3686) rest frame. If more
than one π0 is found within an event, the one with the
minimum |Mγγ− Mπ0| is selected for further analysis.
In the selection of the decay chain ψ(3686) → γχcJ,
χcJ → φKS0K±π∓, φ → K+K−, a candidate event is
required to contain a K0
S candidate, exactly four
addi-tional charged tracks with zero net charge, and at least one photon. The four additional charged tracks must be identified as three kaons and one pion according to
PID information. In the selection of ψ(3686) → γχcJ,
χcJ → φK+K−π0, φ → K+K−, a candidate event is
re-quired to have four charged tracks with zero net charge,
one π0 candidate, and at least one additional photon.
The four charged tracks must be identified as two posi-tively charged and two negaposi-tively charged kaons, respec-tively.
To further remove potential backgrounds and to im-prove the mass resolution, a four-constraint energy-momentum conservation kinematic fit (4C fit) is
performed. Events in the reaction ψ(3686) →
γK+K−K0
SK±π∓ (ψ(3686) → γK+K−K+K−π0) are
required to have a χ2
4C < 100 (χ24C < 40). For events
with more than one photon (besides the photons from
the π0 decay in the χ
cJ → φK+K−π0channel), the
4C-fit is repeated with each photon candidate. The photon
candidate which gives the minimum χ2 is selected to be
the radiative photon from the ψ(3686) decay.
In the selection of ψ(3686) → γK+K−K+K−π0
events, an additional requirement, |MK+K−K+K− −
MJ/ψ| > 30 MeV/c2, is imposed to suppress the
backgrounds ψ(3686) → π0π0J/ψ and J/ψ →
K+K−K+K−, where M
J/ψ is the nominal mass of J/ψ
taken from the PDG [1].
After the above selection criteria are applied, the
de-cay φ → K+K− is reconstructed using the two
oppo-sitely charged kaons whose invariant mass is closest to
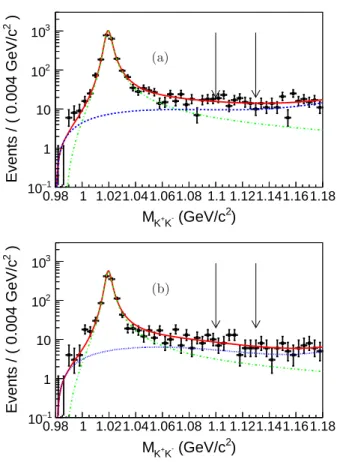
the nominal φ mass. Fig. 1 shows the K+K− invariant
mass of φ candidates for events in which the invariant
mass of K+K−K0
SK±π∓ (K+K−K+K−π0) is between
3.35 and 3.6 GeV/c2. The φ signal is described by P-wave
relativistic Breit-Wigner function, and the background is a 3rd order Chebyshev polynominal function. A clear φ signal is observed above a very low background. Signal events are extracted by applying a mass window
require-ment, |MK+K−− Mφ| < 15 MeV/c2, which corresponds
to three times the mass resolution.
The invariant mass distributions of K+K−K0
SK±π∓
(K+K−K+K−π0) with the φ mass window requirement
are shown in Fig. 2. Significant χcJ signals are observed
with low background. The corresponding scatter plots of
the invariant masses of K0
Sπ± versus K±π∓ (K+π0
) 2 (GeV/c -K + K M 0.98 1 1.021.041.061.08 1.1 1.121.141.161.18 ) 2 Events / ( 0.004 GeV/c −1 10 1 10 2 10 3 10 (a) ) 2 (GeV/c -K + K M 0.98 1 1.021.041.061.08 1.1 1.121.141.161.18 ) 2 Events / ( 0.004 GeV/c −1 10 1 10 2 10 3 10 (b)
FIG. 1. Invariant mass distribution of K+K− for φ
candi-dates (a) for the candidate events of γK+K−K0
SK±π∓, (b)
for the candidate events of γK+K−K+K−π0. The arrows
indicate the φ sideband region.
are the χcJ → φK∗(892) ¯K three body decays.
IV. BACKGROUND ANALYSIS
Since the candidate events are dominated by the
three-body decay χcJ → φK∗(892) ¯K, the
correspond-ing branchcorrespond-ing fractions are measured by imposcorrespond-ing a mass window requirement on the Kπ invariant mass, i.e. |MKπ − MK∗(892)| < 100 MeV/c2. For
conve-nience, hereafter, an event with χcJ → φK∗(892)±K∓
or χcJ → φK∗(892)0K¯0 decay is called a K∗(892)±
or K∗(892)0 event. Also, an event satisfying the
re-quirement |MK0
Sπ± − MK∗(892)±| < 100 MeV/c
2 or
|MK±π∓−MK∗(892)0| < 100 MeV/c2is called a K∗(892)±
or K∗(892)0tagged event. The potential backgrounds for
the decay χcJ → φK∗(892) ¯K are studied based on the
in-clusive MC sample. The following background categories are considered:
The first background category contains the
non-χcJ backgrounds, which are dominated by processes
such as ψ(3686) → φK∗(892) ¯K∗(892) and ψ(3686) →
γφK∗(892) ¯K. MC studies show that these backgrounds
) 2 (GeV/c + π ± K 0 S K -K + K M 3.35 3.4 3.45 3.5 3.55 3.6 ) 2 Events / ( 0.0025 GeV/c 0 20 40 60 80 100 120 140 (a) ) 2 (GeV/c 0 π -K + K -K + K M 3.35 3.4 3.45 3.5 3.55 3.6 ) 2 Events / ( 0.0025 GeV/c 0 10 20 30 40 50 60 70 80 90 (b)
FIG. 2. Invariant mass distribution of (a) K+K−KS0K±π∓
and (b) K+K−K+K−π0 with the φ mass window
require-ment.
do not produce peaks in the χcJ mass region, and their
invariant mass spectrum can be described in the fit with
a polynomial function when extracting the χcJ signal.
The second background category is the non-φ
back-ground, which peaks in χcJ mass region. The main
processes of this background are χcJ → f0/2′ K∗(892) ¯K,
which have the same final state as that of the signal,
where f′
0/2 is a scalar or tensor meson, e.g. f0(1710),
decaying to the K+K− final state. An unbinned
maxi-mum likelihood fit is performed to the K+K− invariant
mass. The fit result shows that the non-φ background is less than 1.8% in the φ mass window region. When we
calculate the number of χcJ events, a φ sideband as
indi-cated in Fig. 1 is used to estimate the background from non-φ events. The number of non-φ background events
is subtracted to obtain the yields of χcJ signals.
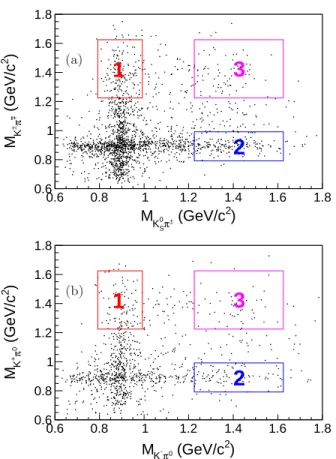
The third background category is composed of
non-K∗(892) events. From the scatter plots of the invariant
mass of K0
Sπ∓ versus K±π∓ (K+π0 versus K−π0) (see
Fig. 3), it appears as though the dominant backgrounds
are the reactions containing a high mass K∗ state, e.g.
χcJ → φK0/2∗0(1430) ¯K0 and χcJ → φK0/2∗±(1430)K∓.
This background is treated similarly to the second back-ground category: these processes have the same final
) 2 (GeV/c ± π S 0 K M 0.6 0.8 1 1.2 1.4 1.6 1.8 ) 2 (GeV/c+π ± K M 0.6 0.8 1 1.2 1.4 1.6 1.8
1
2
3
(a) ) 2 (GeV/c 0 π -K M 0.6 0.8 1 1.2 1.4 1.6 1.8 ) 2 (GeV/c0π + K M 0.6 0.8 1 1.2 1.4 1.6 1.81
2
3
(b)FIG. 3. Scatter plot of the invariant mass of (a) KS0π∓versus
K±π∓ and (b) K+π0 versus K−π0 with the φ mass window
requirement. The boxes represent the K∗(892) sideband
re-gions described in the text.
state as the signal and produce peaking backgrounds in
the χcJ mass region (background level 1.6%). Like the
signal, χcJ → φK∗(892) ¯K, this background category has
horizontal and vertical bands around 1.430 GeV/c2, and
contaminates in the χcJ → φK∗(892) ¯K, illustrated as
boxes 1 and 2 in Fig. 3. The degree of contamination can
be evaluated using the K∗ 2-dimensional (2D) sideband
region with |MKπ− 1425| < 200 MeV/c2, illustrated as
region 3 in Fig. 3. The K+K− invariant mass for events
within the K∗ 2D sideband region (without the φ mass
window requirement) is studied. The K+K− invariant
mass peaks around the φ mass region, and the non-φ events in this region are neglected in the fit.
The last background category is the QED background, which is not produced via the ψ(3686) resonance. Back-grounds of this type are evaluated using the data col-lected at 3.65 GeV and are found to be small and
dis-tributed uniformly in the χcJ mass region. In the fit, the
contribution from this type of background is taken into account by the polynomial function for the first back-ground category.
V. SIGNAL EXTRACTION
For the χcJ → φKS0K±π∓ decay, the isospin
con-jugate channels χcJ → φK∗(892)0K¯0 and χcJ →
φK∗(892)±K∓ are included with K±π∓ forming a
K∗(892)0 or with K0
Sπ± forming a K∗(892)±. The
branching fractions of these reactions are measured
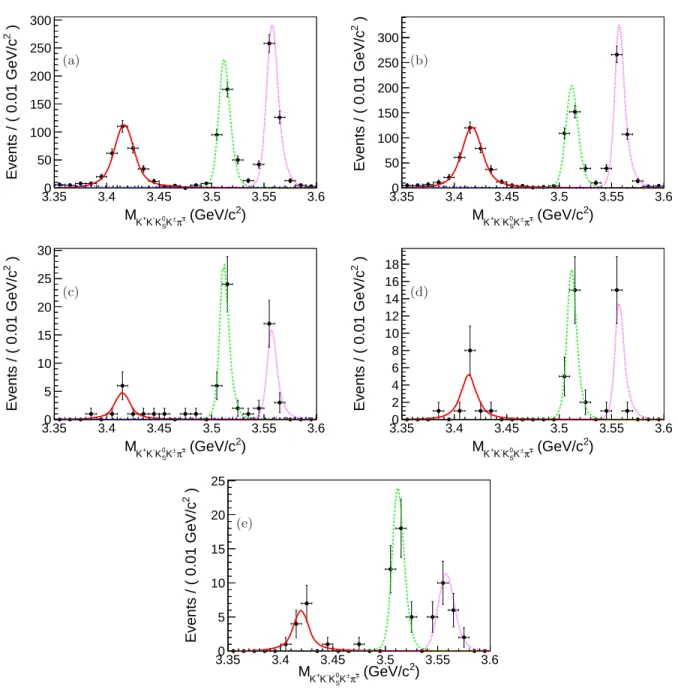
sepa-rately. The invariant mass of the K+K−K0
SK±π∓in
dif-ferent regions is shown in Fig. 4 for (a) K∗(892)±tagged
events, (b) K∗(892)0tagged events, (c) K∗(892)±events
within the φ sideband region, (d) K∗(892)0events within
the φ sideband region, (e) events in the K∗ 2D-sideband
region.
Unbinned maximum likelihood fits are performed to
the invariant mass spectra of K+K−K0
SK±π∓to extract
the yields of χcJsignal in different regions. In the fits, the
three χcJ signals are described by the corresponding MC
shapes convoluted with Gaussian functions which repre-sent the difference in resolution between the data and MC. The widths of the Gaussian functions are float. The background is represented by a second order Chebyshev polynomial function. The results of the fits are shown in Fig. 4, and the signal yields are summarized in
Ta-ble I, where Nobssig(K∗±) and Nsig
obs(K∗0) are the number of
K∗(892)±and K∗(892)0tagged events, Nbkg
φ sideband(K∗±)
and Nφ sidebandbkg (K∗0) are those in the φ sideband regions,
and NKbkg∗ sidebandin the K∗ 2-D sideband region.
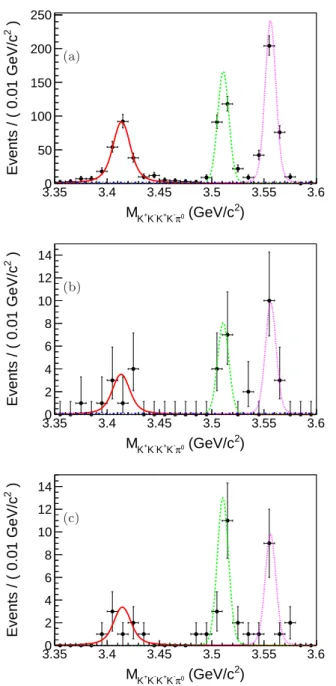
For the χcJ → φK+K−π0 decay mode, only the
charged K∗(892)± state is included. In this analysis, the
charge conjugate modes are not separated, and the joint
branching fraction of χcJ → φK∗(892)±K∓is measured.
Figure 5 shows the distributions of the K+K−K+K−π0
invariant mass for the signal, φ sideband, and K∗ 2-D
sideband regions.
The same fits are performed to the individual distribu-tions. The fit curves are shown in Fig. 5, and the
result-ing χcJ signal yields are summarized in Table II, where
Nobssig(K∗±) is the number of events in the signal region,
and Nφ sidebandbkg (K∗±) and Nbkg
K∗ sideband are those in the
φ and K∗ 2-D sideband region. Here, ǫ is the detection
efficiency.
VI. BRANCHING FRACTIONS
The branching fractions are calculated using the ex-tracted signal yields that have been corrected according to the detector efficiency and decay branching fractions of intermediate states.
For the χcJ → φKS0K±π∓ decay mode, a clear
in-tersection is observed on the scatter plot of the
invari-ant mass of K0
Sπ± versus K±π∓ (Fig. 3 (a)). This
in-dicates that some K∗(892)± events are included in the
K∗(892)0 tagged events, and vice versa. Without
con-sideration of the interference between two isospin
conju-gated K∗(892)s in χ
cJ → φK±KS0π∓ and charge
con-jugated K∗(892)s in χ
) 2 (GeV/c + π ± K 0 S K -K + K M 3.35 3.4 3.45 3.5 3.55 3.6 ) 2 Events / ( 0.01 GeV/c 0 50 100 150 200 250 300 (a) ) 2 (GeV/c + π ± K 0 S K -K + K M 3.35 3.4 3.45 3.5 3.55 3.6 ) 2 Events / ( 0.01 GeV/c 0 50 100 150 200 250 300 (b) ) 2 (GeV/c + π ± K 0 S K -K + K M 3.35 3.4 3.45 3.5 3.55 3.6 ) 2 Events / ( 0.01 GeV/c 0 5 10 15 20 25 30 (c) ) 2 (GeV/c + π ± K 0 S K -K + K M 3.35 3.4 3.45 3.5 3.55 3.6 ) 2 Events / ( 0.01 GeV/c 0 2 4 6 8 10 12 14 16 18 (d) ) 2 (GeV/c + π ± K 0 S K -K + K M 3.35 3.4 3.45 3.5 3.55 3.6 ) 2 Events / ( 0.01 GeV/c 0 5 10 15 20 25 (e)
FIG. 4. The invariant mass of K+K−K0
SK±π∓distributions: (a) for K∗(892)±tagged events; (b) for K∗(892)0tagged events;
(c) for K∗(892)±tagged events in φ sideband region; (d) for K∗(892)0 tagged events in φ sideband region; (e) for the events
in the K∗2-D sideband region.
TABLE I. The χcJyields in different regions from fitting the K+K−K0SK±π∓final state. The uncertainties shown are statistical
only. Nobssig(K∗±) Nbkg φsideband(K∗±) N sig obs(K∗0) N bkg φsideband(K∗0) N bkg K∗ sideband χc0 317 ± 21 11 ± 5 349 ± 21 12 ± 3 14 ± 4 χc1 329 ± 19 33 ± 6 310 ± 18 22 ± 5 35 ± 6 χc2 443 ± 22 21 ± 5 428 ± 21 17 ± 4 23 ± 5
TABLE II. The χcJ yields in different regions and the detection efficiency from MC samples with K+K−K+K−π0 final state.
The uncertainties are statistical only. The statistical errors on the efficiencies are neglected because of the large size of the MC samples used. Nobssig(K∗±) Nbkg φsideband(K∗±) N bkg K∗ sideband ǫ χc0 231 ± 17 9 ± 3 9 ± 3 6.93% χc1 229 ± 16 11 ± 3 18 ± 4 8.23% χc2 332 ± 19 14 ± 4 14 ± 4 7.56% ) 2 (GeV/c 0 π -K + K -K + K M 3.35 3.4 3.45 3.5 3.55 3.6 ) 2 Events / ( 0.01 GeV/c 0 50 100 150 200 250 (a) ) 2 (GeV/c 0 π -K + K -K + K M 3.35 3.4 3.45 3.5 3.55 3.6 ) 2 Events / ( 0.01 GeV/c 0 2 4 6 8 10 12 14 (b) ) 2 (GeV/c 0 π -K + K -K + K M 3.35 3.4 3.45 3.5 3.55 3.6 ) 2 Events / ( 0.01 GeV/c 0 2 4 6 8 10 12 14 (c)
FIG. 5. The invariant mass distributions of K+K−K+K−π0
for the candidate events (a) within the signal region, (b)
within the φ sideband region, (c) within the K∗2-D sideband
region.
between the observed signal yields and the corresponding branching fractions is given by the following equations:
Nsig
c = Nψ(3686)Brcǫcc+ Nψ(3686)Brnǫnc, (1)
Nnsig= Nψ(3686)Brcǫcn+ Nψ(3686)Brnǫnn, (2)
where Nψ(3686) is the number of ψ(3686) events, Nc/nsig
is the number of K∗(892)±/0 tagged candidates, and
Brc/n is the product branching fraction Br(ψ(3686) →
γχcJ) × Br(χcJ → φK∗(892)±K∓/φK∗(892)0K¯0) × Br(φ → K+K−) × Br(K∗(892)±→ K0π±/K∗(892)0→ K±π∓) × Br( ¯K0/K0 → KS0) × Br(KS0 → π+π−) where Br(ψ(3686) → γχcJ), Br(φ → K+K−), Br(K∗(892)± → K0π±), Br( ¯K0/K0 → K0 S), Br(K∗(892)0 → K±π∓) and Br(K0 S → π+π−) are
taken from the PDG [1], and the branching fractions of
χcJ → φK∗(892)±K∓ / φK∗(892)0K¯0 are to be
mea-sured in this analysis. The factor ǫcc/nn is the
detec-tion efficiency for K∗(892)±/0 events to be identified
as K∗(892)±/0 tagged events, and ǫ
cn/nc is the
detec-tion efficiency for K∗(892)±/0 events to be identified as
K∗(892)±/0tagged events. Then the branching fractions
are calculated as : Brc= Nsig c ǫnn− Nnsigǫnc Nψ(3686)(ǫccǫnn− ǫncǫcn) (3) Brn= Nsig c ǫcn− Nnsigǫcc Nψ(3686)(ǫcnǫnc− ǫnnǫcc) . (4)
The corresponding background subtracted signal yields
Nc/nsig are calculated as:
Nc/nsig = Nobssig(K∗±/0)
− fφ sideband Nφ sidebandbkg (K∗±/0) (5)
− fK∗ sidebandNbkg
K∗ sideband.
Here, fφ sideband and fK∗ sideband are normalization
fac-tors; based on the K+K− invariant mass distribution in
Fig. 1(a), fφ sideband is taken as 0.37, while fK∗ sideband
is taken to be 1/4. This takes into account the area of the sideband region (box 3 in Fig. 3) relative to that of polluted signal regions (box 1 or 2 in Fig. 3) as well as the existence of both isospin conjugate
chan-nels in the sideband regions. The detection
which contain events in the reactions ψ(3686) → γχcJ,
χcJ → φK∗(892)±K∓/φK∗(892)0K¯0 with subsequent
decay φ → K+K−, K∗(892)± → K0π± or K∗(892)0 →
K±π∓, ¯K0/K0 → K0
S, KS0 → π+π−. The ψ(3686) →
γχcJ decay is generated with a 1 + λ cos2θ distribution,
where θ is the angle between the direction of the radia-tive photon and that of the positron beam, and λ = 1, -1/3, 1/13 for J = 0, 1, 2, assuming pure E1
tran-sitions. The χcJ decays are generated with a flat
an-gular distribution. Due to the existence of resonances
in the K∗(892)±K∓ invariant mass, the detection
ef-ficiency is evaluated by weighting the signal MC
sam-ples by the K0
SK±π∓ invariant mass. This accounts
for differences in the distributions between the data and the MC simulation. The detection efficiencies are listed in Table III and the corresponding measured branching
fractions Br(χcJ → φK∗(892)±K∓/φK∗(892)0K¯0) are
given in Table VII.
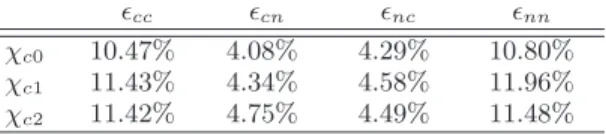
TABLE III. Detection efficiencies from MC samples. The er-rors of efficiencies are neglected because of large MC samples.
ǫcc ǫcn ǫnc ǫnn
χc0 10.47% 4.08% 4.29% 10.80%
χc1 11.43% 4.34% 4.58% 11.96%
χc2 11.42% 4.75% 4.49% 11.48%
For the χcJ → φK+K−π0 decay mode, only the
charged K∗(892)±intermediate state is included, and the
joint branching fractions of the charged conjugate modes are calculated by Br(χcJ → φK∗(892)±K∓) = Nobssig − 0.25 ∗ Nφbkg− 0.5 ∗ N bkg K∗ ǫ · Br · Nψ(3686) . (6)
where Br is the product branching fraction of the other processes in the cascade decay including ψ(3686) →
γχcJ, φ → K+K−, K∗(892)± → K±π0 and π0 → γγ,
and all the individual branching fractions are taken from
PDG. A factor of 0.25 is determined by the K+K−
in-variant mass distribution in Fig. 1(b). The K∗2-D
back-ground is taken with a weight of 0.5 due to the double area of box 3 in Fig. 3 (b), compared to box 1 or 2. As described above, the detection efficiencies are eval-uated using the exclusive MC samples weighted by the
K+K−π0invariant mass.
VII. SYSTEMATIC UNCERTAINTIES
Several sources of systematic uncertainties are con-sidered in the measurement of the branching fractions. These include differences between the data and the MC simulation for track reconstruction, PID, photon
detec-tion, kinematic fitting, π0 selection, K0
S reconstruction,
the mass window requirement, the fitting process, back-ground estimation, MC modeling, the branching frac-tions of intermediate state decays, and the luminosity measurement.
(a) Tracking and PID efficiency. The tracking
effi-ciencies for K± and π± as functions of transverse
mo-mentum have been investigated with the control
sam-ples J/ψ → KS0K±π∓, KS0→ π+π− [21] and ψ(3686) →
π+π−J/ψ [22]. The uncertainty of the tracking efficiency
is 1% for each pion and 1.58% for each kaon. These un-certainties are obtained taking the transverse momentum distributions found in data into account.
The uncertainty due to PID has been studied via the same control samples [22] and is estimated to be 2% for each charged pion and 2.23% for each charged kaon by weighting according to the transverse momentum distri-butions.
(b) Photon detection efficiency. The uncertainty due to photon detection efficiency is 1% per photon [23]. This is determined from studies of photon detection efficiencies with a large and high purity control sample of J/ψ →
ρ0π0 where ρ0→ π+π− and π0→ γγ.
(c) 4C-kinematic fit. In the analysis, the track helix
parameters (φ0, κ, tan λ) are corrected for the MC
sam-ple in order to reduce the difference of the 4C kinematic
fit χ2
4C between the data and the MC sample. Here, φ0
is the azimuthal angle that specifies the pivot with re-spect to the helix center, κ is the reciprocal of the trans-verse momentum and tan λ is the slope of the track. The correction factors are obtained from a clean sample of
J/ψ → φf0(980), φ → K+K− and f0(980) → π+π−.
An alternative detection efficiency is evaluated with the same MC samples, but without helix parameters correc-tions. The difference in the efficiencies is taken as the uncertainty of the 4C kinematic fit [25].
(d) π0 selection. The uncertainty due to the π0
selec-tion is determined from a high purity control sample of
J/ψ → π+π−π0. The difference in the π0 selection
effi-ciency between the data and the MC simulation, 1.0%,
is taken as the uncertainty for the π0 selection [23].
(e) K0
S reconstruction. The uncertainty for the KS0
reconstruction efficiency is studied with a control sample
of J/ψ → K∗(892)±K∓. A conservative value of 3.5% is
taken as the systematic uncertainty for K0
S
reconstruc-tion [24]. This uncertainty is dominated by two sources: one is the tracking efficiency of the two pions from the
K0
S decay, and the other is the secondary vertex fit for
the two pions and the related selection criteria.
(f ) φ and K∗(892) mass window requirement. The
uncertainty from the φ mass window requirement is es-timated by changing the φ signal and sideband windows by one time the mass resolution of φ, 5MeV, which is determined by a fit to data in Fig. 1 . The difference in the branching fractions is taken as the uncertainty. For
the uncertainty related to the K∗(892) mass window
re-quirement, the value for the K∗(892) width used in the
MC simulation, Γ = 50.8 ± 0.18 MeV [1], is changed by twice the uncertainty quoted by PDG, and the difference
in the detection efficiency is taken as the systematic un-certainty.
(g) Fitting process. To estimate the uncertainties from
the fitting process, three effects are considered. (1) χcJ
signal lineshape. The χcJ signal lineshapes are described
with MC simulated lineshapes convoluted with Gaussian functions. An alternative fit with Breit-Wigner functions
convoluted with Gaussian functions for the χcJ signals is
performed, where the Gaussian functions represent the mass resolution. The difference in the production yield returned by the fits is considered as the systematic un-certainty related to the signal lineshape. (2) background
lineshape. The non-peaking background is described
with a second order Chebyshev polynomial. Alterna-tive fits with different order Chebyshev polynomial func-tions are performed. The largest difference in the branch-ing fractions is taken as the systematic uncertainty. (3)
fitting range. The invariant mass of K+K−K0
SK±π∓
(K+K−K+K−π0) is fitted in the region of [3.35, 3.6]
GeV/c2. Alternative fits with different ranges, [3.3, 3.6]
GeV/c2or [3.3, 3.65] GeV/c2are performed. The
maxi-mum difference in the branching fractions are treated as the systematic uncertainty.
(h) Peaking backgrounds. The peaking backgrounds
without a φ signal are estimated with the events in the φ
sideband region [1.10, 1.13] GeV/c2. The corresponding
uncertainty is studied by changing the φ sideband to the
range [1.08, 1.11] GeV/c2. The uncertainty of the
peak-ing background with an excited K∗ is estimated by the
difference in the branching fractions with or without the
K∗ background subtraction.
(i) Weighting method in MC. To obtain the detection
efficiency, the MC samples are weighted by the K∗(892) ¯K
invariant mass to compensate for the difference between the data and MC simulation. To get the uncertainty from
this weighting method, the weight in each K∗(892) ¯K
in-variant mass bin is randomly changed around its mean value by a Gaussian with a standard deviation given by the statistical uncertainty. The same process is per-formed ten thousand times, and the standard deviation on the detection efficiencies is taken as the systematic uncertainty related with the weighting method.
(j) K∗(892) polarization. We estimate the
uncertain-ties depending on the K∗(892) polarization by comparing
the angular distribution of final states between data and MC. We treat the differences in efficiencies as the uncer-tainties.
(k) Other uncertainties. The uncertainty of the total number of ψ(3686) decays is 0.8%. This uncertainty is determined from a study of inclusive ψ(3686) hadronic decays [20]. The uncertainties due to the branching frac-tions of intermediate states are taken from the PDG [1]. Table IV and V summarize the systematic
uncertain-ties for the χcJ → φKS0K±π∓ and χcJ → φK+K−π0
decay modes, respectively. Assuming all of the uncer-tainties are independent, the total systematic uncertain-ties are obtained by adding the individual contributions in quadrature.
VIII. THE K ¯Kπ INVARIANT MASS AND
h1(1380) STATE
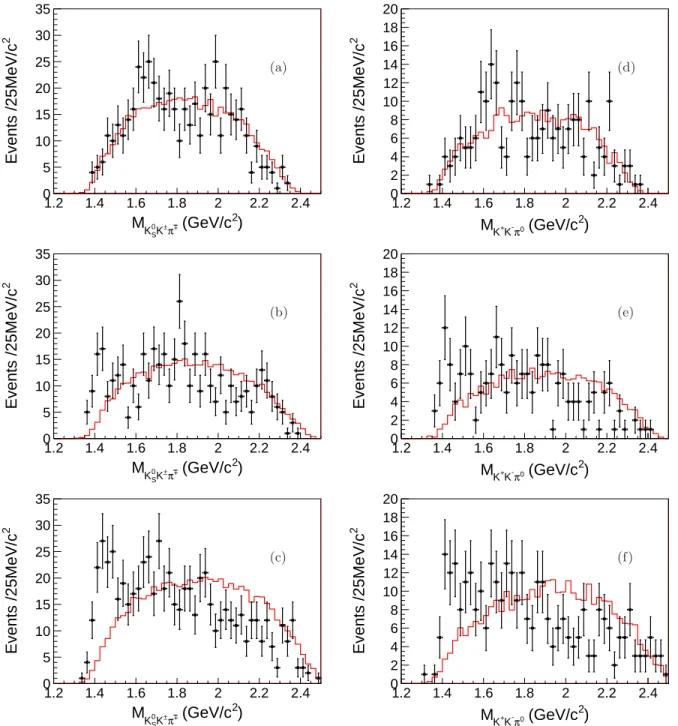
The K ¯Kπ invariant mass distributions are studied
in order to identify any intermediate states. Figure 6
shows the distributions of the K ¯Kπ mass for the
candi-date events within the χ0,1,2 signal regions of the data
as well as the corresponding phase space MC samples
χcJ → φK∗(892) ¯K. The χc0,1,2 signal regions are
de-fined as [3.365, 3.455] GeV/c2, [3.490, 3.530] GeV/c2and
[3.540, 3.575] GeV/c2, respectively. A threshold
enhance-ment, which can not be described with the phase space,
is observed in both χc1and χc2 signal regions (Fig. 6 (b),
(c), (e), (f)), but is absent in the χc0 signal region (Fig. 6
(a), (d)).
Assume that the threshold enhancement comes from an intermediate state, called X. Since the X state is
pro-duced in the χc1,2 decay associated with a φ meson, its
C parity is must be negative due to the conservation of
C parity. The X state is observed in the K∗(892) ¯K final
state, and in the χc2 decay process associated with a φ
meson, which rules out an assignment of JP = 0+. If
we assume that the X state is a conventional q ¯q state, we
can also rule out a JP of 0−, 2+etc. Taking into account
its mass region, its decay through K∗(892) ¯K, and the
ac-cessible JP C and comparing with the PDG [1], the most
likely assignment for X is the h1(1380) (JP C= 1+−). In
the following, we assume that the K∗(892) ¯K threshold
enhancement is the h1(1380) intermediate state.
Besides the K∗(892) ¯K threshold enhancement
ob-served in the χc1,2signal regions, a clear structure around
1.7 GeV/c2is observed in the χ
c0 decay, also evident in
the χc1,2 decay (Fig. 6). Considering the mass region,
and its decay through K∗(892) ¯K, we conclude that this
structure is the φ(1680). The C parity should be minus, and the φ(1680) meets this requirement. There is also a possible φ(1850) contribution visible in Fig. 6.
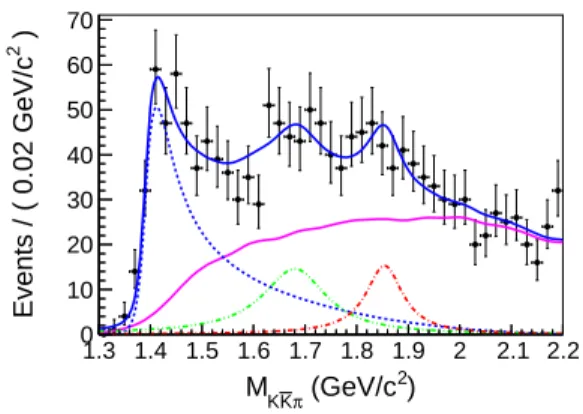
To extract the resonance parameters of the h1(1380),
a simultaneous fit is performed to the K0
SK±π∓ and
K+K−π0 invariant mass distributions for the χ
c1,2
can-didate events (Fig. 6 (b), (c), (e), (f)). Three
reso-nance states, h1(1380), φ(1680) and φ(1850) as well as
a phase space contribution from χc1,2→ φK∗(892) ¯K are
included in the fit without interference. The phase space distribution is described using the shape of the MC sam-ples, smoothed with the KEYS method [27]. The shapes of φ(1680) and φ(1850) are described by relativistic Breit-Wigner functions with constant widths. All the parame-ters of the resonances are fixed to PDG values [1]. Based
on the results of the χcJ fits, the background from
non-χcJ contributes is about 2.7%. MC studies show that
the shape of the K ¯Kπ invariant mass of the non-χcJ
contribution is similar to that of the phase space. There-fore, this background is included in the phase space
con-tribution in the fit to the KS0K±π∓ and K+K−π0
in-variant mass distributions. Since the h1(1380) resonance
is close to the K∗(892) ¯K mass threshold, it is
TABLE IV. Systematic uncertainties on the branching fraction for the χcJ →φK0SK±π∓final states (in %).
Sys. err source χc0 χc1 χc2
Common contribution Total number of ψ(3686) 0.8 Tracking 5.7 Particle ID 8.7 Photon selection 1 Kinematic Fit 1 KS0 reconstruction 3.5 φmass window 1 χcJ→φK∗(892)±K∓(χcJ→φK∗(892)0K¯0) K∗mass window 1.0 (2.1) 0.5 (0.6) 1.0 (2.1) χcJ lineshape 1.5 (3.4) 2.3 (3.0) 0.0 (3.7) Fit range 2.0 (4.2) 1.1 (1.2) 0.7 (1.4) Non-peaking BG shape 1.0 (0.0) 0.5 (0.0) 0.7 (0.5) Peaking BG without φ 0.0 (0.5) 0.6 (0.7) 0.8 (0.0) Peaking BG with φ 1.0 (0.8) 3.2 (3.0) 1.3 (1.4) BRs from PDG 2.7 (2.7) 3.3 (3.3) 3.4 (3.4) MC model 2.7 (2.6) 2.3 (2.8) 2.1 (2.2) K∗(892) polarization 6.1 (5.0) 7.1 (6.5) 6.6 (5.7) Sum 13.6 (14.0) 14.5 (14.4) 13.7 (14.0)
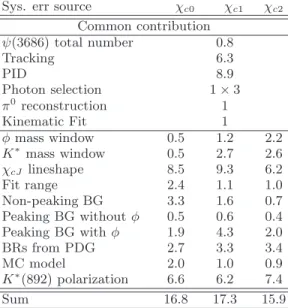
TABLE V. Systematic uncertainties on the branching fraction for the χcJ →φK+K−π0 final states (in %).
Sys. err source χc0 χc1 χc2
Common contribution ψ(3686) total number 0.8 Tracking 6.3 PID 8.9 Photon selection 1 × 3 π0 reconstruction 1 Kinematic Fit 1 φ mass window 0.5 1.2 2.2 K∗ mass window 0.5 2.7 2.6 χcJ lineshape 8.5 9.3 6.2 Fit range 2.4 1.1 1.0 Non-peaking BG 3.3 1.6 0.7 Peaking BG without φ 0.5 0.6 0.4 Peaking BG with φ 1.9 4.3 2.0 BRs from PDG 2.7 3.3 3.4 MC model 2.0 1.0 0.9 K∗(892) polarization 6.6 6.2 7.4 Sum 16.8 17.3 15.9
mass dependent width [28]. A detailed description of the
h1(1380) lineshape used in the following fits is given in
Appendix A. The simultaneous fit to the K0
SK±π∓ and
K+K−π0 invariant mass distributions is performed for
the candidate events in the χc1 and χc2 mass regions.
The fit yields a mass of (1412.4 ± 4.4) MeV/c2 and a
width of (84.5 ± 12.4) MeV for the h1(1380) resonance,
where the errors are statistical only. In the fit, we take the change of the detection efficiency as a function of the invariant mass into account. The efficiency functions are
0.12 − 0.02 × MK0
SK±π∓, 0.14 − 0.03 × MK
0
SK±π∓, 0.18 −
0.02 × MK+K−π0 and 0.18 − 0.03 × MK+K−π0 for the χc1
and χc2 regions, respectively. The product of the
rela-tivistic Breit-Wigner functions and the efficiency func-tions are used to describe the signal. Figure 7 shows the
sum of the invariant mass distribution of the K0
SK±π∓
and K+K−π0 decay modes for the candidate events in
the χc1and χc2mass regions as well as the sum of the
cor-responding fit curves. The goodness of fit is determined
to be χ2/n.d.f = 1.09 by projecting all candidate events
in 45 bins. The statistical significance of the h1(1380)
signal is measured to be greater than 10 σ by compar-ing the likelihood values of the fit with and without the
h1(1380). The statistical significances of the φ(1680) and
φ(1850) signals evaluated by the same method are found to be 4.3σ and 3.2σ, respectively. We consider the
inter-) 2 (GeV/c + π ± K 0 S K M 1.2 1.4 1.6 1.8 2 2.2 2.4 2 Events /25MeV/c 0 5 10 15 20 25 30 35 (a) ) 2 (GeV/c 0 π -K + K M 1.2 1.4 1.6 1.8 2 2.2 2.4 2 Events /25MeV/c 0 2 4 6 8 10 12 14 16 18 20 (d) ) 2 (GeV/c + π ± K 0 S K M 1.2 1.4 1.6 1.8 2 2.2 2.4 2 Events /25MeV/c 0 5 10 15 20 25 30 35 (b) ) 2 (GeV/c 0 π -K + K M 1.2 1.4 1.6 1.8 2 2.2 2.4 2 Events /25MeV/c 0 2 4 6 8 10 12 14 16 18 20 (e) ) 2 (GeV/c + π ± K 0 S K M 1.2 1.4 1.6 1.8 2 2.2 2.4 2 Events /25MeV/c 0 5 10 15 20 25 30 35 (c) ) 2 (GeV/c 0 π -K + K M 1.2 1.4 1.6 1.8 2 2.2 2.4 2 Events /25MeV/c 0 2 4 6 8 10 12 14 16 18 20 (f)
FIG. 6. The K ¯Kπ invariant mass distributions, (a) K0
SK±π∓in the χc0region; (b) K0SK±π∓in the χc1region; (c) KS0K±π∓
in the χc2 region; (d) K+K−π0 in the χc0 region; (e) K+K−π0 in the χc1 region; (f) K+K−π0 in the χc2 region. The black
dots represent the data, and the histogram shows the phase space MC sample.
ferences between h1(1380) and these resonances in the
systematic uncertainties.
The different sources of systematic uncertainty for the
h1(1380) resonance parameters are considered as follows:
(a) Parameterization of the energy dependent width.
The energy dependent width of the h1(1380) is described
with the truncation functions combined of exponential and polynomial functions. The curves of S(m) are re-fitted with the same truncation functions, but with
dif-ferent truncation point. A fit was also attempted to the S(m) curves using a second-order polynomial. The new fitted functions of S(m) are used in the simultaneous fit
on the K ¯Kπ invariant mass. The largest differences in
the mass and width of the h1(1380), 3.9 MeV/c2and 3.8
MeV, are taken as one of systematic uncertainties for the
h1(1380) resonance parameters.
(b) Background shape. In the fit, the background is
al-) 2 (GeV/c π K K M 1.3 1.4 1.5 1.6 1.7 1.8 1.9 2 2.1 2.2 ) 2 Events / ( 0.02 GeV/c 0 10 20 30 40 50 60 70
FIG. 7. The sum of K0
SK±π∓ and K±K∓π0 mass spectra
in the χc1 and χc2 mass regions. The markers with error
bars represent the data; the dash curve the h1(1380) signal;
the dash-dot-dot curve the φ(1680) signal; and the dash-dot curve the φ(1850) signal.
ternative fit is performed using a second-order Chebychev polynomial function to describe the non-resonant. The
differences in mass, 4.7 MeV/c2, and width, 5.5 MeV, are
taken as the systematic uncertainties due to the shape of the background.
(c) Fit range. An alternative fit with a different fit
range, [1.2, 2.0] GeV/c2, is performed. The differences in
the mass and width of the h1(1380) are found to be 0.5
MeV/c2and 3.5 MeV, respectively.
(d) Efficiency parameterization. A fit with a flat
efficiency curve is performed, and the differences of 0.3
MeV/c2in the mass and 1.0 MeV in the width are taken
as the systematic uncertainties related to the efficiency correction.
(e) φ(1680) resonance. In the nominal fit, the mass
and width of the φ(1680) resonance are fixed to their
PDG values. Different fit scenarios, (1) without the
φ(1680), (2) leaving the mass and width of the φ(1680) resonance free in the fit, and (3) changing the mass and width by one standard deviation from the PDG values are performed, and the largest change in the mass and width,
1.4 MeV/c2 and 17.0 MeV, are regarded as the
system-atic uncertainties related to the φ(1680) resonance.
(f ) φ(1850) resonance. The systematic uncertainty
due to the φ(1850) resonance is evaluated in a similar way as for the φ(1680). The largest change in mass and width,
1.1 MeV/c2 and 3.5 MeV, are taken as the systematic
uncertainties related to φ(1850) resonance.
(g) The branching fraction constraint between isospin
conjugate decay modes. In the nominal fit, no
con-straint is imposed on branching fractions for the the isospin conjugate modes and different final states. The systematic uncertainty related to the branching fraction constraint is estimated by requiring that the
branch-ing fraction of h1(1380) → KS0K±π∓ is twice that of
h1(1380) → K+K−π0, which is expected by isospin
symmetry. The changes in the mass and width of the
h1(1380), 0.3 MeV/c2 and 3.4 MeV, are taken as the
systematic uncertainties of this type.
(h) Interference effects. The fit is repeated under
the following interference scenarios, (1) the interference
between h1(1380) and phase space, (2) the interference
between h1(1380) and φ(1680), (3) the interference
be-tween h1(1380) and φ(1850), The largest differences to
the nominal values of the mass and width, 4.7 MeV/c2
and 35.3 MeV, are taken as the systematic uncertainties related to interference effects.
Table VI shows the systematic uncertainties for the
mass and width of h1(1380). Assuming that all sources
of systematic uncertainty are independent, the total
sys-tematic uncertainty is determined to be 8 MeV/c2for the
mass and 40 MeV for the width.
IX. SUMMARY AND CONCLUSIONS
Using 106 M ψ(3686) events collected with the
BE-SIII detector, we present a study of the decays χcJ →
φK0
SK±π∓ and χcJ → φK+K−π0, via the E1
radia-tive transition ψ(3686) → γχcJ. The decays are
dom-inated by the three-body reaction χcJ → φK∗(892) ¯K.
The branching fractions for this reaction via neutral and
charged K∗(892) are measured for the first time and are
summarized in Tables VII. The measured branching
frac-tions for χcJ → φK∗(892)±K∓ in the two different final
states are found to be consistent with each other. The
ratio of the branching fraction for χcJ→ φK∗(892)±K∓
to that of χcJ → φK∗(892)0K¯0 is consistent within the
expectations of isospin symmetry.
By examining the invariant mass spectrum of K ¯Kπ,
a significant excess of events above the phase space
ex-pectation is observed near the K∗(892) ¯K mass
thresh-old in the decays of χc1,2, with a significance greater
than 10σ. The observed structure has negative C
par-ity, and is expected to be the h1(1380) state,
consider-ing its mass, width and decay through K∗(892) ¯K. A
simultaneous fit is performed to the invariant mass
dis-tributions of K ¯Kπ for the candidate events in the χc1,2
signal regions. The mass and width of the h1(1380)
are determined to be 1412 ± 4(stat.) ± 8(sys.) MeV/c2
and 84 ± 12(stat.) ± 40(sys.) MeV, respectively. This
is the first direct observation of the h1(1380) in its
de-cay to K∗(892) ¯K. Evidence is also found for the decays
χcJ → φφ(1680) and χcJ → φφ(1850), but with
signif-icances less than 5σ. More data and advanced analysis techniques, e.g. PWA, may shed light on the properties
of the structures observed in the K ¯Kπ invariant mass
spectrum.
ACKNOWLEDGMENTS
The BESIII collaboration thanks the staff of BEPCII and the IHEP computing center for their strong
TABLE VI. Systematic uncertainties on mass and width for the h1(1380).
Sys. err source mass (MeV) width(MeV)
Parameterization of energy dependence width 3.9 3.8
Shape of the background 4.7 5.5
Fit range 0.5 3.5 Efficiency curve 0.3 1.0 φ(1680) resonance 1.4 17.0 φ(1850) resonance 1.1 3.5 Isospin constraint 0.3 3.4 Interference effects 4.7 35.3 Sum 7.9 40.2
TABLE VII. Branching fractions measured in φK ¯Kπ final states
Decay Modes φKsK±π∓(×10−3) φK+K−π0 (×10−3)
χc0 φK
∗(892)±K∓ 1.65 ± 0.21(stat.) ± 0.22(sys.) 1.90 ± 0.14(stat.) ± 0.32(sys.)
φK∗(892)0K¯0+ c.c. 2.03 ± 0.21(stat.) ± 0.28(sys.) —
χc1 φK
∗(892)±K∓ 1.76 ± 0.21(stat.) ± 0.26(sys.) 1.62 ± 0.12(stat.) ± 0.28(sys.)
φK∗(892)0K¯0+ c.c. 1.51 ± 0.19(stat.) ± 0.22(sys.) —
χc2 φK
∗(892)±K∓ 2.56 ± 0.23(stat.) ± 0.35(sys.) 2.74 ± 0.16(stat.) ± 0.44(sys.)
φK∗(892)0K¯0+ c.c. 2.27 ± 0.22(stat.) ± 0.32(sys.) —
Key Basic Research Program of China under Contract No. 2015CB856700; National Natural Science Founda-tion of China (NSFC) under Contracts Nos. 10935007, 11121092, 11125525, 11235011, 11322544, 11335008, 11375170, 11275189, 11079030, 11475164, 11005109, 11475169; the Chinese Academy of Sciences (CAS) Scale Scientific Facility Program; Joint Large-Scale Scientific Facility Funds of the NSFC and CAS under Contracts Nos. 11179007, U1232201, U1332201; CAS under Contracts Nos. YW-N29, KJCX2-YW-N45; 100 Talents Program of CAS; INPAC and Shanghai Key Laboratory for Particle Physics and Cos-mology; German Research Foundation DFG under Con-tract No. Collaborative Research Center CRC-1044; Is-tituto Nazionale di Fisica Nucleare, Italy; Ministry of Development of Turkey under Contract No. DPT2006K-120470; Russian Foundation for Basic Research under Contract No. 14-07-91152; U. S. Department of Energy under Contracts Nos. 04ER41291, DE-FG02-05ER41374, DE-FG02-94ER40823, DESC0010118; U.S. National Science Foundation; University of Groningen (RuG) and the Helmholtzzentrum fuer Schwerionen-forschung GmbH (GSI), Darmstadt; WCU Program of National Research Foundation of Korea under Contract No. R32-2008-000-10155-0.
Appendix A: Appendix: Lineshape ofh1(1380)
The h1(1380) resonance is parameterized with a
rel-ativistic Breit-Wigner function with a mass dependent
width m2 0Γ2(m; m0) (m2 0− m2)2+ m20Γ2(m; m0) , (A1)
where m0 is the nominal mass of h1(1380) state, and
Γ(m; m0) is the corresponding mass dependent width,
which will be discussed in the following.
In typical two-body decays, the width Γ(m, m0) varies
with mass roughly as [29]
Γ(m, m0) ≈ Γ0(q
q0
)2l+1, (A2)
where l is the orbital angular momentum, q is the
mo-mentum available in a normal two-body decay, and Γ0
and q0 are the corresponding widths and momenta in
the nominal mass. However, in a quasi two-body decay
such as h1(1380) → K∗(892) ¯K, the q of the decay
iso-bar (K∗(892)) is no longer precisely defined. Due to the
non-zero K∗(892) width, the K∗(892) ¯K threshold is not
well defined and the q momentum available in a normal
two-body amplitude may become un-physical (q2 ≤ 0).
Following Ref. [30], if we assume the energy dependence of Γ is proportional to the integral of the decay matrix element over the available area of the Dalitz plot for each
Γ(m; m0) = Γ0 S(m) S(m0) = Γ0 R Dalitz plot(m) D2 K∗dΦ R Dalitz plot(m0) D2 K∗dΦ , (A3)
and for S-wave K∗(892) ¯K
DK∗ = |BWK∗
12· ~t3+ g · BWK13∗ · ~t2|, (A4)
where BWK∗
ij are the usual P -wave relativistic
Breit-Wigner functions [29] with the mass and width of
K∗(892) fixed at their PDG values. Here ~t
i are the
Zemach vectors describing the spin 1 content, and are the vector part of
pµj − pµk − [ m2 j− m2k m2 jk ][pµj + pµk], (A5)
and ~pi(i = 1, 2, 3) are the vector parts of the 4-momenta
of π, K and ¯K in the K ¯Kπ rest system. The interference
between the K∗(892) ¯K and ¯K∗(892)K is fixed by C
par-ity: constructive (g = +1) for C = +1, and destructive (g = −1) for C = −1. In our analysis, C = −1.
To simplify the fitting process, a numerical method is used to extract the integral of the decay matrix element over the available phase space. The integral can be re-written as : S(m) ≡ Z Dalitz plot(m) DK2∗dΦ ≃ V N N X i=1 D2K∗(i) = V 1 N N X i=1 DK2∗(i), (A6)
where the term N1 PN
i=1D2K∗(i) can be extracted using
the MC samples of χcJ → φX (X → K ¯Kπ) with a large
statistics N, and V is the phase space volume for the
decay X → K ¯Kπ.
A set of MC samples generated with a different mass
m and zero width for the intermediate state X is used to
extract 1
N
PN
i=1DK2∗(i). The phase space volume V of
a three-body decay with system mass m can be derived as [31]:
R3(m; m1, m2, m3) =
Z (m−m3)2
(m1+m2)2
R2(m; m12, m3)R2(m12; m1, m2)dm212 (A7)
where m12 is the invariant mass of system of particle 1 and particle 2, and R2 is the two-body phase space
volume, which can directly taken from PDG [1] :
R2(m12; m1, m2) = r [1 − (m1m+ m2 12 )2][1 − (m1− m2 m12 )2] (A8)
The above integral process gives the same result as the integral over the decay area in the Dalitz decay study [32].
The value of 1
N
PN
i=1DK2∗(i), the phase space volume
V, and the corresponding product, S(m), as function of
invariant mass of K ¯Kπ system, m, are shown in Fig. 8.
Due to the small difference in the mass and width of
neu-tral and charged K∗(892) and χ
c1,2phase space volume,
the calculations are performed for χc1,2 and the decay
mode of K0
SK±π∓ and K+K−π0, individually. S(m)
represents the mass dependence of the width Γ(m, m0)
for the h1(1380), which is used to describe the h1(1380)
) 2 (GeV/c π K K M 1.2 1.3 1.4 1.5 1.6 1.7 Ω 0 0.05 0.1 0.15 0.2 0.25 0.3 π K 0 S K 0 π -K + K (a) ) 2 (GeV/c π K K M 1.2 1.3 1.4 1.5 1.6 1.7 Ω )d * (K 2 D
∫
Ω 1 0 10 20 30 40 50 60 70 80 90 c1 χ for π K 0 S K c2 χ for π K 0 S K c1 χ for 0 π -K + K c2 χ for 0 π -K + K (b) ) 2 (GeV/c π K K M 1.2 1.3 1.4 1.5 1.6 1.7 S(m) 0 2 4 6 8 10 12 14 16 18 c1 χ for π K 0 S K c2 χ for π K 0 S K c1 χ for 0 π -K + K c2 χ for 0 π -K + K (c)FIG. 8. Numerical calculation of S(m), (a) phase space
vol-ume V, (b) 1 N PN i=1D 2 K∗(i), (c) S(m).