EVALUATION OF THE POTENTIAL OF AGRICULTURAL WASTE
PRODUCTS FOR THE TREATMENT OF TEXTILE DYE
CONTAMINATED WATER
Ü.D. GÜL
†§and G. BAYAZIT
ठVocational School of Health Services, Bilecik Seyh Edebali University, 11230, Bilecik, TURKEY. Corresponding author
†The Center of Biotechnology Applied and Researcher, Bilecik Seyh Edebali University, 11230, Bilecik, TURKEY [email protected]
‡ Department of Biotechnology, Bilecik Seyh Edebali University, 11230, Bilecik, TURKEY. [email protected]
Abstract -- In this study, the peels of waste agricul-tural products (banana, orange, potato) were used as biosorbent to remove textile dyes from dye contami-nated water. Biosorption of the commonly used textile dye such as Acid Red P-2BX (AR) was investigated by the peels of different agricultural products. The waste peels of banana, orange and potato were prepared as dried and ash biosorbent. The effects of pH, bio-sorbent type, dye concentration, biobio-sorbent dosage and temperature on dye biosorption were tested at batch scale level. The best removal of dye was per-formed by the banana peel. Biosorption by dried ba-nana peel for AR dye was found to be 73.58% at opti-mum conditions. It was concluded that dried banana peels were effectively used in the treatment of textile dye- contaminated water.
Keywords-- Biosorption, Acid Red, Fruit Peels I. INTRODUCTION
Recent studies reported that the textile industry effluents have been a significant source of environmental pollution due to the release of different dye compounds. The high amount of textile dyes caused environmental toxicity and public health damage (Ofomaja and Ho, 2008). The toxic effects of textile dyes in human health can be listed as irritation to the skin tachycardia, and dyspnea (Hu et al., 2014). The treatment of wastewater containing textile dyes becomes an important environmental issue (Seyyedi and Mahdiyar, 2015). Therefore, environmental pollu-tion prevenpollu-tion studies of waste materials have become essential to remove textile dye effluent in the environ-ment (Keçili et al., 2018). Among the methods used in wastewater treatment, biosorption is more preferred with its ease of application and high removal efficiencies (Silva et al., 2018). The type of biosorbent used is one of the most decisive factors on the cost of biosorption. In wastewater treatment systems, the use of agricultural wastes (Mandi et al., 2009), in particular, significantly reduces costs and increases interest in the biosorption process, which is less favorable to enterprises. Thus, dif-ferent waste materials can be used as biosorbents. The textile dyes having various colors and chemical proper-ties are treated with organic wastes such as processed cot-ton, soybean meal, orange peel and organic waste such as biogas sludge and powdered activated sludge (Sharma et
al., 2012).
Agricultural products are kind of biological materials and can be extensively found all over the world. Some studies showed that the waste peels of agricultural prod-ucts such as orange peels can be effectively used in the removal of textile dyes (Hashemian et al., 2013). How-ever, there is limited knowledge about the comparison of dye biosorption by different peels of agricultural prod-ucts in the literature. Also, it is stated that the use of waste peels of agricultural products in the wastewater treatment process can provide a good solution for another environ-mental issue such as solid waste disposal problems. Most of the agricultural products such as orange, banana, and potato are assumed as healthy food, but a lot of waste peels are produced by consumers. These waste peels are natural, abundantly available, and yearly renewable bio-mass sources. As solid waste materials, most of the peels are disposed of as garbage (Dai et al., 2010).
The aim of this study is to investigate the textile dye (AR) removal capacity of waste banana, potato and or-ange peels from the aqueous solution by biosorption tech-nique. The effects of pH, dye concentration, biosorbent amount and temperature on the biosorption were investi-gated experimentally. The biosorption kinetics and iso-therms were also described in this study. In addition to this, the FTIR analysis was done in order to explain the dye biosorption cites on the biosorbent surface.
II. METHODS A. Preparation of Adsorbent
The waste banana (BP), potato (PP) and orange peels (OP) were collected and, then used as biosorbent in the experiments. Two groups of biosorbent were prepared in this study. Both of the biosorbents were washed by dis-tilled water. The first group (dried) of biosorbent was dried at 100 ˚C overnight and the second group (ash) was kept in the ash oven for 30 min at 500 ˚C. All groups were ground to make powder. To ensure that all of the powder particles were of equal size, they were passed through a 0.5 mm sieve and made ready for experiments.
B. Preparation of Dye Solution
The textile dye called Acid Red P-2BX (AR) was sup-plied by the textile factory in Turkey.The stock dye solu-tions (1000 mg/L) were prepared in distilled water and diluted to the desired concentrations for experiments.
C. Adsorption Experiments
All experiments were carried out in Erlenmeyer flasks in-cluding 100 mL of dye containing solutions. In order to determine the effect of solution pH, different pH values such as 2, 4, 6, 8 and 10 (the solution pH was adjusted using 1 M HCl or NaOH) were performed for dye bio-sorption. To examine the biosorbent type (dried and acti-vated) 1 g/L of biosorbent was used in the experimental solutions. Also, the effect of initial dye concentrations,
biosorbent dosage (1, 2 and 4 g/L) and temperature (25, 35 and 45 ˚C) was investigated in experimental series. All experimental series were done duplicate.
D. Analytical Methods
The dye concentrations in the experimental solutions were analyzed by spectrophotometer (Labomed INC. 22 model) at 535 nm. The two milliliter of samples were taken at definite times and centrifuged (Hettich EBTA12 model centrifuge) at 4000 rpm for 3 min. The supernatant was used for dye analysis.
The biosorption rate (B%) was calculated from Eqs. (1) and (2);
Biosorption rate (B%)
B% = (Co– Cf) /Co x 100 (1) qm= Co- Cf/ Xm (2) where qm is the uptake of dye by a unit mass of biosorbent at any time (mg/g), Co is the initial dye concentration (mg/L), Cf is the final dye concentration at any time (mg/L) and Xm is the sorbent concentration (g/L). E. FT-IR analysis
FT-IR analysis was done by Agilent Technologies, Cary 630 FTIR spectrophotometer. The dried biomass (before and after biosorption) were ground into powders (blended with dry spectroscopic grade powders) and, then pressed into small disks and used in FTIR measure-ments. Samples were scanned at the scan range of 400– 4000cm-1.
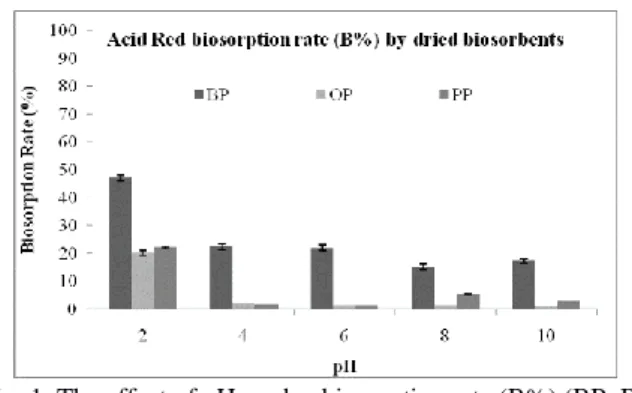
III. RESULTS AND DISCUSSIONS A. The effect of pH and biosorbent type
The pH of the solution affects the adsorption process by changing the dye ionization degree and also the mechan-ical interaction between the dye and ionic charge of the functional groups on the adsorbent surface. The pH effect of both dried and ash banana peel (BP), orange peel (OP) and potato peel (PP) on AR biosorption was tested at different pH (2, 4, 6, 8, 10) values. The results of the AR biosorption by the peels of dried agricultural products experiments are given in Figs. 1 and 2, respectively. Maximum dye biosorption rates and capacities occurred at pH 2 for all types of dried biosorbents. The dye biosorption rate of all biosorbents was decreased by increasing pH values (Fig. 1). Similarly, Chaleshtori et
al. (2017) showed that Acid Red 18 dye adsorption onto
activated almond shell was reduced while the pH values were increased and also reported that maximum dye removal occurred at pH 2. The highest biosorption rate of AR dye in acidic conditions depended on the electrostatic interactions between the dye ions and the positively
Fig. 1. The effect of pH on dye biosorption rate (B%) (BP: Ba-nana peel; OP: Orange peel; PP: Potato peel)
Fig. 2. The effect of pH on dye biosorption capacity (qt) (BP: Banana peel; OP: Orange peel; PP: Potato peel) charged biosorbent surface. The results of this study are similar to the findings of Chaleshtori et al. (2017). Also, Ishaq et al. (2014) studied the removal of dye molecules by activated carbon prepared from industrial wastes and determined that optimal pH for dye removal was 2. The results of pH effect experiments were supported by the recent studies in the literature (Ishaq et al., 2014; Chaleshtori et al., 2017).
In order to determine the textile dye removal potential of different waste peels of agricultural products; banana, potato and orange peels were used as biosorbents in this study. The best removal efficiency was obtained from the experiments with the banana peel. The highest bio-sorp-tion capacity of the banana peel was 36.71 mg/g (Fig. 2).
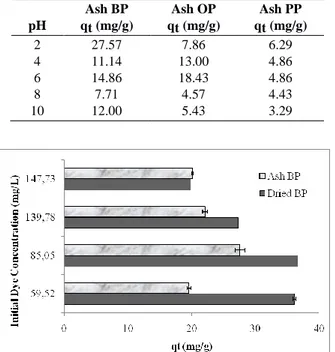
AR dye biosorption rates by all dried biosorbents were decreased in the increasing pH values. Table 1 shows the AR dye biosorption capacities of all ash bio-sorbents at different pH values. As given in Table1, the similar results with dried biosorbents have also been found in ash biosorbents, with an optimal pH of 2 for AR dye biosorption. Also, dried biosorbents showed better dye biosorption capacity than ash biosorbents for all peels of agricultural products. The best AR dye removal was performed by dried banana peels better than by the ash ones. In this study, the waste peels of different agri-cultural products were used to investigate the possibili-ties of their usage as biosorbents in dye removal. The dried and ash biosorbents were prepared at 100˚C and 500˚C, respectively. Dried biosorbents in all waste peels of agricultural product types have more effective dye bi-osorption rate than ash biosorbents (Fig. 2 and Table 1). In the literature, it is stated that both biosorbent stabiliza-tion and high surface area are increased at high tempera-tures such as 500˚C (Zhao et al., 2017). According to the results of this study, the biosorbent, which was dried at
100˚C, achieved more successful removal compared to the ashed one in 500˚C. On the other hand, Zang et al. (2015) showed that the increasing temperature in the re-sults of this study caused degradation of some polymers on the cell surface and even caused the dehydration of hydroxyl groups on the surface. Recently, Zhao et al. (2017) reported that the pyrolysis temperature reduces the number of acidic functional groups such as carboxylic
groups on the surface. The results of this study supported that the functional groups involved in dye biosorption on the surface of waste peels of agricultural products un-dergo thermal degradation. As a result, the biosorbent prepared at a higher temperature has a lower rate of dye biosorption. On the other hand, heating up to 500˚C uses more energy than heating up to 100˚C, thus preferring dried biosorbent saves energy.
The results obtained from the effect of pH and bio-sorbent type experiments showed that optimal pH was 2 and maximum dye biosorption capacity was performed by banana peels. Further experiments were carried out according to these findings.
B. The Effect of Initial Dye Concentration
To examine the effect of initial dye concentration on dye biosorption by dried and ash banana peels, a variety of dye concentrations (59.52, 85.05, 139.78 and 147.73 mg/L) were tested.
As given in Fig. 3, Acid Red biosorption capacity of banana peels was decreased by increasing the dye con-centration up to 147.73 mg/L. The dye removal perfo mance of dried biomass was higher than the dye removal
performance of ash biomass at all dye concentra-tions(Fig. 3).
Table 1. The AR dye biosorption capacities (qt: mg/g) of all ash biosorbents at different pH values. (BP: Banana peel; OP: Or-ange peel; PP: Potato peel).
pH Ash BP qt (mg/g) Ash OP qt (mg/g) Ash PP qt (mg/g) 2 27.57 7.86 6.29 4 11.14 13.00 4.86 6 14.86 18.43 4.86 8 7.71 4.57 4.43 10 12.00 5.43 3.29
Fig. 3. The effect of initial dye concentration on dye biosorption capacity (qt) (BP: Banana peel).
Table 2. The effect of biosorbent dosage on dye biosorption (D: dried; BD: biosorbent dosage; BP: banana peel; Co: initial dye
concentration; B: Biosorption)
D BD (g/L) Co (mg/L) Qm (mg/g) B (%)
BP 1 98.84 36.71 46.98
BP 2 98.84 32.71 66.18
BP 4 98.84 18.11 73.58
Maximum dye adsorption capacity was found as 36.71 mg/g at 85.05 mg/L dye concentration with a dried banana peel. Initial dye ions concentration had a driving force role to handle the mass transfer resistance between solid and liquid phases (Kaouah et al., 2013). Recently, Chaleshtori et al. (2017) showed that Acid Red 18 removal percentage decreased with the increase in the initial dye concentration. Similarly, the augmentation in the initial AR dye concentration resulted in the decreased dye biosorption rate (Fig. 3). It is assumed that the low dye biosorption rate at high dye concentrations depends on the saturation of active sites on the adsorbent surface for dye biosorption.
C. The effect of biosorbent Dosage
The effect of biosorbent dosage on AR biosorption by dried banana peel was tested in different amounts of bio-sorbent (1g / L, 2g / L, and 4g / L). The results of the experiments are given in Table 2. The increasing amount of biosorbent increased biosorption efficiency (Table 2). The increasing adsorbent dosage increased the number of active sites on the adsorbent for dye sorption by the ad-sorbent (Shirmardi et al., 2012; Kaouah et al., 2013). In the results of this study, dried banana peels showed max-imum dye biosorption rate (%) at the highest biosorbent content (4 g/L) as 73.58% (Table 2).
Some studies about the use of agricultural wastes as cheap adsorbents have been reported in the literature (Sharma et al., 2012). Srivastava and Rupainwar (2011) used mango peel as an adsorbent for dye removal and re-ported that the adsorption capacity of malachite green was 0.53 mg/g. Abassi and Asl (2009) investigated the Reactive Blue 19 sorption capacity of the grape peel as an adsorbent and determined the dye removal capacity as 12.53 mg/g. Dried banana peel showed maximum dye ad-sorption capacity as 36.71 with 1 g/L biosorbent dosage (Table 2). The results of this study showed that the dye biosorption efficiency of banana peel was higher than the results of other studies given in the literature (Abassi and Asl 2009; Srivastava and Rupainwar 2011; Sharma et al., 2012).
D. The effect of Temperature
The effect of temperature on dye biosorption was inves-tigated at different temperature values (25 °C, 35 °C and 45 °C). The effect of temperature on AR biosorption of dried BP was found to vary with increasing temperature (Fig. 4). The AR dye biosorption rate was found as 73.58% at 25 °C, 69.42% at 35 °C and 73.48% at 45 °C by dried banana peel biosorbent (Fig. 4). There was not any significant difference between these biosorption rate values, so the dye biosorption by banana peel did not de-pend on the temperature of the working environment.
Fig. 4. The effect of temperature on dye biosorption rate (%) (BP: Banana peel).
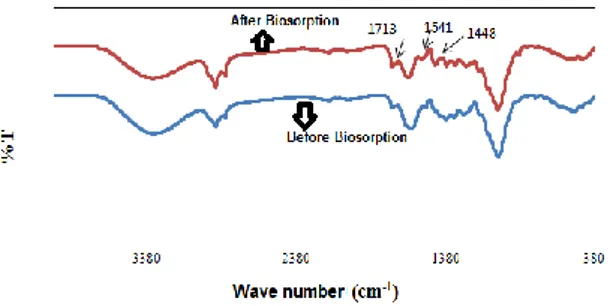
Fig. 5. FTIR spectra of banana peel before and after biosorption of AR dye.
E. FTIR
FTIR spectra before and after AR dye biosorption of the dried banana peel are shown in Fig. 5. The presence of hydroxyl groups with the peak OH voltage vibrations seen around 3400 cm-1, the peaks around 2921 cm-1
indi-cates the presence of aliphatic hydrogen (CH) and the peak in 1713 cm-1 shows the presence of the carbonyl
group (C = O). The peaks from 1541 to 1448 cm-1 also
consist of aromatic C = C stress vibrations, showing the presence of peak C-H aliphatic methyl groups at 1370 cm-1 and the peak at 1230 cm-1 shows O vibrations.
C-H bending vibrations in the 900 to 700 cm-1 range
indi-cate the presence of aromatic structure (Özbay and Yar-gıç 2015).
F. Biosorption Isotherm and Kinetics
The most common isotherm models called Langmuir and Freundlich were used in this study.
The isotherm equations were calculated from Eqs. (3) and (4).
Langmuir Isotherm Equation:
Ce/qe = (1/qm)Ce + 1/KLqm (3) Freundlich Isotherm Equation:
ln(qe)= ln(KF) + 1/n ln(Ce e) (4) In these equations; qe is the amount of dye adsorbed per unit weight of adsorbent at equilibrium (mg/g), qm is the
maximum dye uptake per unit mass of adsorbent (mg/g),
KL is the Langmuir isotherm constant (L/mg) and KF is the Freundlich isotherm constant (L/mg).
In order to examine the dynamics of the biosorption process in terms of the theoretical qe values and order of rate constant, pseudo-first-order and pseudo-second-or-der kinetic model equations were used. Kinetic data were calculated with the equations of pseudo-first-order (Eq. 5) and pseudo-second-order (Eq. 6) kinetic models.
Table 3. Biosorption isotherm parameters for the biosorption of AR on a dried banana peel (qm: the maximum AR uptake per unit mass of adsorbent, KL: Langmuir isotherm constant; KF: Freundlich isotherm constant)
Langmuir qmax KL R2 (mg/g) (L/mg) 4.427 0.03967 0.839 Freundlich KF 1/n R2 (L/mg) 423.27 0.226 0.877
Table 4- Kinetic parameters for the biosorption of AR onto the dried banana peel (qecal: The theoretical adsorption capacity; qeexp: The experimental adsorption capacity; k1: rate constant
of the pseudo-first-order kinetic model, k2: rate constant of the pseudo-second-order kinetic model)
Pseudo-first-order model qecal qeexp k1 R2 0.0862 18.10 0.000 0.737 Pseudo-second-order model qecal qeexp k2 R2 11.236 18.10 0.001286 0.975
Pseudo first-order kinetic model equation:
log (qe-qt) = -k1/2.303t + log qe (5)
Pseudo second-order kinetic model equation:
t/qt =1/k2 qe2 + 1/qe.t (6) In these equations qe is the adsorption capacity, k1 is the rate constant of pseudo-first-order kinetic model and k2 the rate constant of pseudo-second-order kinetic model.
Biosorption isotherm and kinetic models were calcu-lated at maximum decolorization environment with opti-mal conditions.The Langmuir and Freundlich isotherm correlation values were calculated as 0.839 and 0.877 for
the biosorption of dye, respectively (Table 3). The bio-sorption was suitable with the Freundlich isotherm model due to the highest correlation value. Previously, Shir-mardi et al. (2012) stated that the adsorption of Acid Red on to the carbon nano-tubes was fitted with the Freun-dlich isotherm model. Recently, Chaleshtori et al. (2017) reported the similar results with this study and showed the Freundlich isotherm model was compatible with the adsorption of Acid Red 18 dye on activated charcoal pre-pared from the almond shell. Freundlich isotherm model is based on a slower increase after by the reach of satura-tion on the adsorbent surface with the increasing amount of adsorbed material at the beginning (Mandi et al., 2009). Freundlich isotherm model also explained for the heterogeneous surface energy systems.
The calculations about biosorption kinetics are given in Table 4. The correlation value of the pseudo-second-order model was the highest as 0.975, so the biosorption of AR on the dried banana peel biosorbent was fitted with the pseudo-second-order kinetic model. Similarly, Mahmoud et al. (2014) reported that the kinetic model of manganese biosorption on banana peel obeyed with the pseudo-second-order model. Also, Chaleshtori et al. (2017) recently reported the similar results with this
was compatible with the adsorption of Acid Red 18 dye on activated charcoal prepared from the almond shell. Pseudo-second-order kinetic model is considered as the sorption includes a second-order mechanism via chemi-sorptions by the means of rate-limiting step (Tutu et al., 2013).
IV. CONCLUSION
The waste banana peel performed high adsorption capac-ity of textile dye and the optimal conditions were deter-mined in this study. As a result of the experiments carried out, it was suggested that the waste dried banana peel, which was easy to obtain and cheap, could be used in the removal of dyes in the laboratory scale experiments of the biosorption method. The decolorization technologies can use the waste banana peel as a biosorbent in the in-dustrial scale areas.
REFERENCES
Abassi, M. and Asl, N.R. (2009). “Removal of hazardous reactive blue 19 dye from aqueous solution by agri-cultural waste,”. J. Iran. Chem. Res., 2, 221-230. Chaleshtori, A.A.N., Meghadddam, F.M., Sadeghi,
M.M., Rahimi, R.R., Hemati, S. and Ahmadi, A.A. (2017). “Removal of Acid Red 18 (Azo-Dye) from Aqueous Solution by Adsorption onto Activated CharcoalPrepared from Almond Shell,” Journal of
Environmental Science and Management, 20, 2.
Dai, W., Chen, J.R. and Ma, N. (2010). Preparation of
activated carbon with finger citron residue, China
Patent ZL CN101844764A.
Hashemian, S., Salari, K., Salehifar, H. and Yazdi, Z.A. (2013). “Removal of Azo Dyes (Violet B and Violet 5R) from Aqueous Solution Using New Activated Carbon Developed from Orange Peel,” Journal of
Chemistry, Article ID 283274, 1-10.
Hu, J., Yu, H.J., Dai, W., Yan, X.Y., Hu, X. and Huang, H. (2014). “Enhanced adsorptive removal of haz-ardous anionic dye "congo red" by a Ni/Cu mixed-component metal-organic porous material,” RSC
Advances, 4, 35124-35130.
Ishaq, M., Saeed, K., Shoukat, A., Ahmad, I. and Khan, A.R. (2014). “Adsorption of alizarin red dye from aqueous solution on an activated charcoal,”
Inter-national Journal of Science Invention Today, 3,
705-718.
Kaouah, F., Boumaza, S., Berrama, T., Trari, M. and Bendjama, Z., (2013). “Preparation and characteri-zation of activated carbon from wild olive cores (oleaster) by H3PO4 for the removal of Basic Red 46,” Journal of Cleaner Production, 54, 296-306. Keçili R., Biçen Ünlüer, Ö. and Hussain, C.M. (2018).
“Tailor-Made Molecular Traps for the Treatment of Environmental Samples,” Handbook of
Environ-mental Materials Management, Hussain C. (eds).
Springer, Cham, 1- 22.
Mahmoud, M.S., Ahmed, S.M., Somaia, G.M. and Abou Elmag, A.M. (2014). “Evaluation of Egyptian Ba-nana Peel (Musasp.) as a Green Sorbent for Ground-water Treatment,” International Journal of
Engi-neering and Technology, 4, 648- 659.
Mandi, L., Achak, M., Hafidi, A. and Ouazzani, N. (2009). “'Low cost bio-sorbent for the removal of phenolic compounds from olive mill wastewater, “
CIHEAM, 179- 186.
Ofomaja, A.E. and Ho, Y.S. (2008). “Effect of tempera-tures and pH on methyl violet biosorption by man-sonia wood sawdust,” Bioresource Technology, 99, 5411-5417.
Özbay, N. and Yargıç, A.S. (2015). “Factorial experi-mental design for Remazol Yellow dye sorption us-ing apple pulp/apple pulp carbon–titanium dioxide co-sorbent,” Journal of Cleaner Production, 100, 333-343.
Seyyedi, K. and Mahdiyar, A. (2015). “Decolorization of Contaminated Water Containing C.I. Direct Blue 53 by Macroalgae Chara sp. and Optimization of De-colorization Process,” Latin American Applied
Re-search, 45,193-198.
Sharma, N., Tiwari, D.P. and Singh, S.K. (2012). “De-colourisation of Synthetic Dyes by Agricultural Waste- A Review,” International Journal of
Scien-tific & Engineering Research, 3, 1-10.
Shirmardi, M., Mesdaghinia, A., Mahvi, A.H., Nasseri, S. and Nabizadeh, R. (2012). “Kinetics and equilib-rium studies on adsorption of acid red 18 (Azo-Dye) using multiwall carbon nanotubes (MWCNTs) from aqueous solution,” Journal of Chemistry, 9, 2371-2383.
Silva, T.C., Fraga, T.J.M., Carvalho, M., Silva, V.L. and Da Motta, M.A. (2018). “Removal of the Reactive Remazol Black B and Remazol Red from Aqueous Solutions by Adsorption onto Treated Residue from the Aluminium Industry,” Latin American Applied
Research, 48, 101-106.
Srivastava, R. and Rupainwar, D.C. (2011). “A compar-ative evaluation for adsorption of dye on neem bark and mango bark powder,” Indian Journal of
Chem-ical Technology, 18, 67-75.
Tutu, H., Bakatula, E., Dlamini, S., Rosenberg, E., Kailasam, V. and Cukrowska, E.M., (2013). “Ki-netic, equilibrium and thermodynamic modeling of the sorption of metals from aqueous solution by a silica polyamine composite,” Water SA, 39, 437-443.
Zhao, S.X., Ta, N. and Wang, X.D. (2017). “Effect of Temperature on the Structural and Physicochemical Properties of Biochar with Apple Tree Branches as Feedstock,” Material. Energies, 10, 1293, 1-15. Zhang, J., Liu, J. and Liu, R., (2015). “Effects of
pyroly-sis temperature and heating time on biochar ob-tained from the pyrolysis of straw and lignosul-fonate,” Bioresource Technology, 176, 288–291.
Received May 11, 2019
Sent to subject Editor September 4, 2019 Accepted October 2, 2019