LENDING BEHAVIORS OF TURKISH BANKS DURING
ELECTIONS AND BUSINESS CYCLES
A Master’s Thesis
By
FURQAN ALI
Department of Management
İhsan Doğramacı Bilkent University
Ankara
i
LENDING BEHAVIORS OF TURKISH BANKS DURING ELECTIONS AND BUSINESS CYCLES
Graduate School of Economics and Social Sciences of
İhsan Doğramacı Bilkent University
By
FURQAN ALI
In Partial Fulfillment of the Requirements for the Degree of
MASTER OF SCIENCE
in
THE DEPARTMENT OF MANAGEMENT İHSAN DOĞRAMACI BILKENT UNIVERSITY
ANKARA September 2017
ii
I certify that I have read this thesis and have found that is fully adequate, in scope and in quality, as a thesis for the degree of Master of Science in Management.
……… Assoc. Prof. Dr. Zeynep Önder
I certify that I have read this thesis and have found that is fully adequate, in scope and in quality, as a thesis for the degree of Master of Science in Management.
………
Assoc. Prof. Dr. Süheyla Özyıldırım
I certify that I have read this thesis and have found that is fully adequate, in scope and in quality, as a thesis for the degree of Master of Science in Management.
……… Prof. Dr. Nuray Güner
Approved of the Graduate School of Economics and Social Sciences.
...
Prof. Dr. Halime Demirkan
iii
ABSTRACT
LENDING BEHAVIORS OF TURKISH BANKS DURING ELECTIONS AND BUSINESS CYCLES
Ali, Furqan
M.S., Department of Management
Supervisor: Assoc. Prof. Dr. Zeynep Önder
September 2017
This thesis examines the lending behavior of Turkish banks during elections and business cycles using quarterly data for the period December 2001-September 2016. Banks are classified on the basis of their ownership as public, private and foreign banks and their deposit collecting ability as deposit and development banks. Five general election and three local election events are studied during this period. I find that all banks except foreign development banks increase their nominal and real loan growth rates during general elections. Loan growth rates of public deposit and development banks are found to increase during local elections more than that of private banks. The results of one-step system GMM model suggests that loan growth rate of public banks is less pro-cyclical than that of private banks. Public deposit banks are found to lend pro-cyclically while public development banks are not. It is also found that public banks increase their loan growth rate in periods with negative GDP growth rate.
iv
ÖZET
TÜRK BANKALARININ SEÇİM DÖNEMLERİ VE KONJEKTÜREL DALGALANMADAKI KREDİ VERME DAVRANIŞI
Ali, Furqan
Yüksek Lisans, İşletme Bölümü Tez Yöneticisi: Doç Dr. Zeynep Önder
Eylül 2017
Bu tez, Aralık 2001-Eylül 2016 döneminde üçer aylık veri kullanarak seçim dönemlerinde ve konjektürel dalgalanmada Türk bankalarının kredi verme davranışlarını incelemektedir. Bankalar, mülkiyetlerine göre kamu, özel ve yabancı banka olarak, mevduat toplama yeteneklerine göre, mevduat ve kalkınma bankaları olarak sınıflandırmıştır. Bu dönemde yapılan beş genel ve üç yerel seçim incelenmiştir. Genel seçim dönemlerinde, yabancı kalkınma bankaları dışındaki tüm bankaların nominal ve reel kredi büyüme oranlarını artırdıkları görülmüştür. Yerel seçim dönemlerinde, kamu mevduat ve kalkınma bankalarının kredi büyüme oranlarının özel bankalardan daha yüksek olduğu bulunmuştur. Tek aşamalı sistem
genellestirilmis momentler metodu modelinin sonuçları, kamu bankalarının kredi
büyümesinin, özel bankalardan daha az konjektürle aynı yönde hareket ettiğini göstermektedir. Kamu mevduat bankalarının kredi büyüme oranları konjektürle aynı yönde hareket etmesine rağmen, kamu kalkınma bankalarının kredileri konjektürle ters yönde büyüdüğü bulunmuştur. Ayrıca, negatif GSYİH büyüme oranı oldugu dönemlerde kamu bankalarının kredi büyüme oranlarını artırdığı görülmektedir. Anahtar Kelimeler: Borç Verme, GSYİH Büyümesi, Konjektürel Dalgalanma, Kredi Artışı, Seçimler
v
ACKNOWLEDGEMENTS
First of all, I would like to thank my supervisor Assoc. Prof. Zeynep Önder for
her guidance, encouragement and support. I am lucky to have such a nice supervisor
who cared so much about my work and responded to my questions and queries so promptly.
I would also like to thank Prof. Süheyla Özyıldırım and Prof. Nuray Güner for their valuable comments and suggestions in helping me to improve my work. I am
also thankful to all the teachers from whom I took courses which helped in improving my
knowledge and understandings about research.
I am thankful to all my friends in Pakistan and in Turkey for always being in touch with me and encouraging me to complete my thesis on time.
Finally, my deep and sincere gratitude to my family for their continuous and unparalleled love, help and support. I am thankful to my family members for the time they sacrificed for my studies and research.
I am forever indebted to my parents for giving me the opportunities and experiences that have made me who I am. They selflessly encouraged me to explore new directions in life and seek my own destiny. This journey would not have been possible without their support, and I dedicate this milestone to them.
vi
TABLE OF CONTENTS
ABSTRACT ... iii
ÖZET ... iv
ACKNOWLEDGEMENTS ... v
LIST OF TABLES ... viii
LIST OF FIGURES ... x
CHAPTER 1 ... 1
INTRODUCTION ... 1
CHAPTER 2 ... 5
LITERATURE REVIEW ... 5
2.1 Theoretical literature related to interventions of government in financial sector 6 2.1.1 Social and development purpose ... 6
2.1.2 Political purpose ... 7
2.2 Empirical literature on lending behavior of banks by ownership type ... 8
2.3 Empirical literature on lending behavior of banks by ownership type during eeeeelections... 9
2.4 Empirical literature on lending behavior of banks by ownership type during eeeebusiness cycles and crisis ... 11
CHAPTER 3 ... 15
BANKING INDUSTRY, GDP AND ELECTIONS IN TURKEY ... 15
3.1 Banking industry in Turkey after 2000 ... 15
3.1.1 Deposit Banks by Ownership Type ... 20
3.1.2 Loan growth rate of deposit and non-deposit banks ... 22
3.2 Elections in Turkey ... 23
vii
CHAPTER 4 ... 26
EMPIRICAL MODELS AND DATA ... 26
4.1 Empirical Models ... 26
4.1.1 Model for Lending Behavior during Election periods: ... 26
4.1.2 Model for Lending Behavior and Business cycle: ... 30
4.2 Data ... 32
CHAPTER 5 ... 40
EMPIRICAL RESULTS ... 40
5.1 Regression results: Lending behavior of banks during elections ... 40
5.1.1 Lending behavior of deposit banks during elections ... 47
5.1.2 Lending behavior of banks during elections with other definitions of loan eeeegrowth rates ... 49
5.1.3 Lending behavior during elections using real loan growth rates ... 49
5.1.4 Redefining the elections periods ... 49
5.1.5 Regression results after excluding observation from election periods ... 50
5.1.6 Regression results after excluding Garanti bank from the sample ... 50
5.2 Regression results: Lending behavior with GDP growth rate ... 51
5.2.1 Real Loan growth with real GDP growth rate... 56
5.2.2 Loan growth rate and industrial production growth rate ... 61
5.2.3 Lending behavior during positive and negative GDP growth rate periods ... 65
CHAPTER 6 ... 74
CONCLUSION ... 74
6.1 Limitations of study and future research ... 76
REFERENCES: ... 77
viii
LIST OF TABLES
Table 3.1: The share of deposit and non-deposit banks in total assets and total loans of
banking Sector……….………....17
Table 3.2: Number of deposit and non-deposit banks by ownership, 2001-2016…………18
Table 3.3: Elections in Turkey for the period 2002-2016 ……….……...23
Table 4.1: Definition of Variables………29
Table 4.2: Correlation coefficients of loan growth rates………..30
Table 4.3: The number of deposit and non-deposit banks by ownership……….33
Table 4.4: Descriptive statistics of variables……….…...33
Table 4.5: Descriptive statistics of variables for Winsorized Sample…………..…………35
Table 4.6: Descriptive statistics of loan growth rates by bank groups (Winsorized Sample)………...……….……….36
Table 4.7: Descriptive statistics of bank characteristics by bank groups (Winsorized Sample)……….38
Table 4.8: T statistics of variables testing the equality of mean value values………….….39
Table 5.1: Lending behavior of banks by ownership types during elections, Dependent variable: LGR1………..………..…….42
Table 5.2: Lending behavior of bank by ownership and deposit collecting ability during elections, Dependent variable: LGR1………..……….…..44-45 Table 5.3: Lending behavior during elections, Dependent variable: LGR1 (deposit banks sample)………..………...48
Table 5.4: Lending behavior of banks by ownership during business cycles, Dependent variable: LGR1………...……….…52-53
Table 5.5: Lending behavior of deposit and non-deposit banks by ownership during
ix
Table 5.6: Lending behavior of banks by ownership during business cycles, Dependent variable: RLGR1………...57-58
Table 5.7: Lending behavior of deposit and non-deposit banks by ownership during business cycles, Dependent variable: LGR1………...………..59-60
Table 5.8: Lending behavior of banks by ownership during Industrial business cycles, Dependent variable: LGR1………61-62
Table 5.9: Lending behavior of banks by types during Industrial business cycles,
Dependent variable: LGR1………63-64
Table 5.10: Lending behavior of banks by ownership during positive and negative GDP growth periods: Nominal GDP growth rates……….……66-67
Table 5.11: Lending behavior of banks by types during positive and negative GDP growth periods: Nominal GDP growth rates……….68-69
Table 5.12: Lending behavior of banks by ownership during positive and negative GDP growth periods: Real GDP growth rates………70-71
Table 5.13: Lending behavior of banks by types during positive and negative GDP growth periods: Real GDP growth rates………72-73
x
LIST OF FIGURES
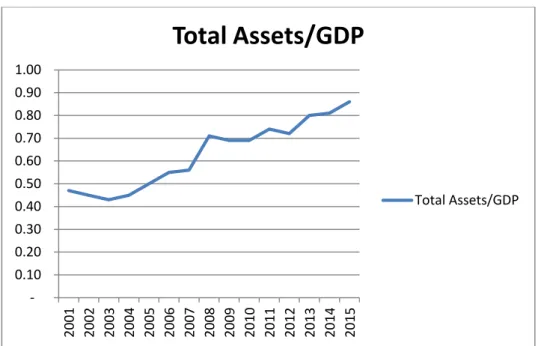
Figure 3.1: Total banking assets to GDP ratio……….16
Figure 3.2: Total banking loan to deposit ratio………19
Figure 3.3: Loan/Deposits Ratio of Deposit banks by ownership types………..19
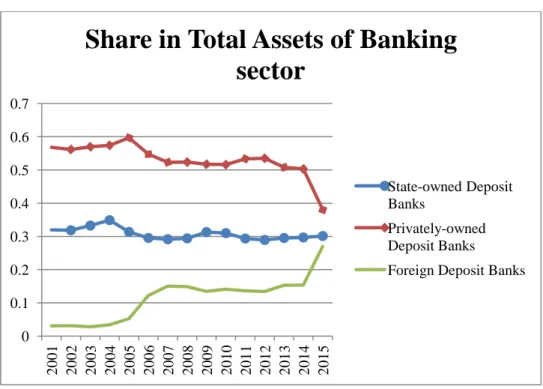
Figure 3.4: Share of deposit banks by their ownership in total assets of banking
sector………...………....20
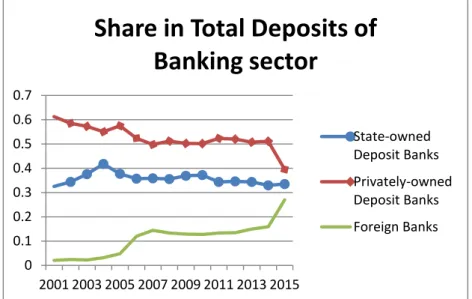
Figure 3.5: Share of deposit banks by their ownership in total deposits of banking sector………...………21
Figure 3.6: Share of deposit banks by their ownership in total loans of banking
sector………...………21
Figure 3.7: Annual loan growth rate of deposit and non-deposit banks………...22
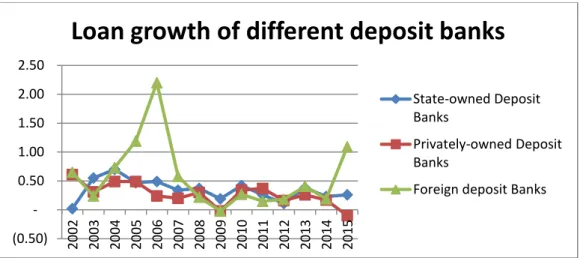
Figure 3.8: Loan growth rate of different deposit banks by ownership………...23
Figure 3.9 Real and nominal GDP growth rate in Turkey from 2001-2016…………24
Figure 3.10 Industrial Production growth rate in Turkey……….24
1
CHAPTER 1
INTRODUCTION
The presence of government owned banks is more common among developing countries than developed countries. In the literature, presence of governments owned banks, their importance and interventions of governments in management of public financial institutions have been the topic of debate for decades (e.g., Gerschenkron, 1962; Lewis, 1950; Stiglitz et al., 1993).
Many arguments have been presented in favor of existence of government owned banks. For example, government should create public banks so that it can have control over finance and resources of country and by having control over resources government can play an important role in development of industries especially in less developed countries (e.g., Gerschenkron, 1962). Presence of public banks also leads to availability of funds and economic growth during crisis periods. For example, public banks play positive role during crisis periods by providing credit and by
2
studies have found that presence of public banks is associated with lower economic
and financial growth especially in less developed countries (e.g., La Porta et al.,
2002).
Researchers have presented two reasons behind the interference of governments in the management of public financial institutions. Development and social reasons and political reasons. Those supporting development and social view argue that these interventions are necessary especially in developing markets for proper functioning of financial markets. These interventions are also helpful in maintaining capital flow and liquidity in financial markets (e.g., Gerschenkron, 1962; Stiglitz et al., 1993).
Those supporting the political view argue that politicians can misuse public resources for their personal benefits. Politicians can either force the management of public banks by using their influence or through bribes to invest in projects that do not necessarily need to be social but can help them to win elections. Politicians can also force public banks to give loans to politically connected firms and on favorable conditions, such as loans with low interest rates and with long maturities (e.g., Lewis, 1950; Shleifer and Vishny, 1994).
Previous studies found that during elections loan growth rate of public banks increases in developing countries while it is not significantly different from loan growth rate of private banks in developed countries (e.g, Dinç, 2005). These empirical findings support the political use of public banks in developing countries. In the literature, it is also found that in countries with good governance, lending by public banks is less pro-cyclical than that of private banks and public banks provide more credit during negative GDP growth rate periods (e.g., Bertay et al., 2015). Increase in loan growth rate of public banks during negative GDP growth rate periods supports the social and development view about the intervention of government in public banks. This behavior of public banks also supports the argument that the main objective of public banks is not to earn profit but to maintain liquidity in financial markets.
3
In this thesis, I study how lending behavior of public, private and foreign banks in Turkey changes during elections and with the GDP growth rate. In addition to their ownership types, banks are also classified based on their deposit collecting ability as deposit and development banks.
Turkey is an emerging economy and among the G20 countries. It experienced banking crisis in the early 2000’s. After the crisis, Banking Regulations and Supervision Agency (BRSA) was established and many changes were made in banking regulations such as, restricting loan provision to bank owners and increasing capital adequacy ratios of banks. After these reforms in banking sector, foreign banking has also flourished in Turkey; the share of foreign banks in banking sector of Turkey increased in the last decade. They have almost 28% share in total deposits of banking sector in 2015 which was less than 3% in 2001. These changes in banking sector make Turkey an interesting economy to study.
A period of 15 years from December 2001 to September 2016 is examined in this thesis. In this period, there are eight elections in Turkey: five general elections and three local elections. These election periods are used to study the lending behavior of banks during elections. GDP growth rate and growth rate in industrial production are used to study the cyclicality of loan growth rates of banks.
First, I analyze the lending behavior of banks during local and general elections. I use
ordinary least squares with robust standard errors controlling for banks specific
characteristics including their size, liquidity, profitability and risk with time and bank fixed effects. It is found that loan growth rate of public banks (both deposit and development) increases significantly more than that of private banks during local elections, while in general election loan growth rate of public banks is not significantly different from that of private banks. It is also found that the loan growth
4
rates of all banks except foreign development banks increases significantly during general elections.
Second, I analyze the relationship between loan growth rates of banks and GDP growth rate. Because of endogeneity I use one-step system generalized methods of moments (GMM) in estimations. It is found that loan growth rate of public banks in Turkey is less pro-cyclical than that of private banks. Public deposit banks are found to engage in cyclical lending behavior while public development banks did not. Public banks are found to increase their loan growth rate in periods with negative GDP growth rate.
The thesis is organized as follows. In chapter 2, I present theoretical and empirical studies related to lending behavior of banks during elections and GDP growth cycles. In chapter 3, I discuss the banking sector in Turkey in early 2000’s, some characteristics of banks, business cycles and elections in Turkey over the last 15 years. In chapter 4, I present empirical models and data. In chapter 5, I present the empirical results. Lastly, chapter 6 concludes the study.
5
CHAPTER 2
LITERATURE REVIEW
This chapter is divided into four major sections. In the first section, theoretical literature about interventions of government in financial sector is discussed. The motivations behind these interventions and how these interventions affect the lending behavior of different banks by their ownership are discussed. The other three sections summarize the empirical literature about lending behaviors. In the second section, literature about lending behavior of banks by their ownership type is discussed. In the third section, the papers examining lending behavior of these banks during election years are summarized. The fourth section presents the evidence about lending behavior of banks during business cycles and crisis periods.
6
2.1 Theoretical literature related to interventions of government in financial sector
Interventions of government in financial markets especially in banking industry have been a topic of debate for a long time. In the literature, two major reasons for these interventions have been discussed. The first one is the social and development purpose. It argues that government involvement in the banking industry is for economic growth. The second is political purpose. It argues that government controls financial institutions in order to favor politically connected firms and get benefits from these banks. In this section theoretical literature related to both political and social and development purposes of interventions is discussed.
2.1.1 Social and development purpose
Gerschenkron (1962) is one of the supporters of the development view of government interventions in financial markets. He suggests that for economic growth and industrialization of a country, government should play an important role in its financial markets and create banks to provide capital to those who cannot get it from other sources. Government can increase growth in a country through government-owned banks that increase access to capital and control flow of funds. By overcoming shortage or unavailability of capital in financial markets, economic growth can be achieved.
Stiglitz et al. (1993) also support social and development view. They argue that government interventions in financial markets can have positive effects on growth and development of a country. As government can ensure the solvency of banks, it achieves smooth functioning of credit markets, eliminates market failures and ensures proper allocation of resources. Moreover, they say that government provides funds to social and/or development projects that may not be financed by private institutions because these projects may not be profitable.
7
2.1.2 Political purpose
The other purpose for intervention of government in financial markets is political. Ruling political party can influence the decisions of public banks. Politicians may force public banks to give loans to projects that are not necessarily be social but can help them to win elections by showing that these projects are for improvement of their welfare. Politicians may also force public banks to give loans to politically connected firms on favorable conditions such as loans with large amounts, low interest rates and long maturities.
Lewis (1950) argues that in democratic countries, government uses public funds to
invest in social projects just before elections to increase their chances for reelection. Shleifer and Vishny (1994) develop a model that describes how political pressure affects decisions of managers of public and private firms. In their model, there are three players: a treasury, a politician and a manager of a firm. They argue that politician can influence the manager’s decisions of public firms either using their influence or through bribes to achieve their political objectives. These political objectives can be to give loans to politically connected firms on favorable terms.
So, irrespective of the purpose of interventions by government in banking sector, it affects the lending behavior of banks. These interventions will affect public banks more because government has control over these banks. Hence, public banks are expected to provide more funds to less profitable or riskier projects. They are also expected to provide loans to politically connected firms. Around elections, political use of public banks is expected to increase which can increase the loan growth rate of public banks more than other banks.
8
2.2 Empirical literature on lending behavior of banks by ownership type
This section discusses empirical studies about lending behavior of public, private and foreign banks in several countries and in different time periods. Sapienza (2004) examined how government ownership affects the lending behavior of banks by using individual loan contracts data of more than 50,000 companies operating in Italy, a developed country with a high percentage of government bank ownership, for the period 1991-1995. She found that public banks grant loans with lower interest rates than private banks do, controlling for company and bank characteristics and local market structure. She reported that large firms or those located in Southern Italy enjoy the benefit of getting loans with lower interest rate. Moreover, she analyzed the political party affiliation of the chairperson of a state-owned bank and reported that the strength of the political party affiliated with a bank affects the decline in interest rates on loans provided by these banks. Hence, if a ruling political party is stronger in a specific area or region than interest rates on loans issued by public banks is lower in that area.
Khwaja and Mian (2005) presented another evidence of the favorable treatment of government-owned banks. Their sample is from a developing country, Pakistan. They studied a universe of individual loan contracts of more than 90,000 companies issued by both private and public banks operating in Pakistan for the period 1996-2002. In their study, a firm was classified as politically connected if there were politicians on the board of directors of a firm. They found that politically connected firms are more likely to get loans from public banks with favorable characteristics than non-political firms, controlling for other firm characteristics. These favorable treatments include lower interest rate and larger loan size. They report that these politically connected firms borrowed 40% more than other firms and their default rate was 50% higher than other firms.
9
Chen et al. (2014) analyzed 69,332 bank-loan contracts in Taiwan for the period 1991-2008 to examine the preferential treatments of public banks in lending politically connected firms. They used two definitions of political connection: the first one is whether the top managers are appointed by government officials, the second one depends on whether the top managers were supported by political parties or were their members. They found that public banks favor firms which have political connections. Their favorable treatment included giving loans with lower interest rate, longer maturity and less collateral requirements. They controlled for loan and firm characteristics in their model.
These empirical studies support political explanations for interventions of government in public banks. Political influence affects the lending behavior of public banks that give loans with favorable terms to politically connected firms. In the next section, studies examining the lending behavior of banks during elections are presented. Election is an exogenous event, so political influence on public banks can be observed directly.
2.3 Empirical literature on lending behavior of banks by ownership type during elections
It is expected that loan growth rate of public banks is more than that of private banks during elections because political use of public banks is expected to increase during elections. Dinç (2005) studied the lending behavior of banks during elections for a sample of 36 countries, including 19 emerging and 17 developed countries. His sample included the largest ten banks in each country and the period 1994-2000. He found that public banks increase their lending significantly in election years only in emerging countries whereas no significant difference in loan growth rates of public and private banks was found in developed countries. Instead of the percentage change in loans issued by banks, he used the ratio of the change in loans during the year to total assets at the beginning of a year as a dependent variable. Total assets are used as
10
a measure of size and loans with a maturity longer than a year are also included in total assets so he normalized change in loans by total assets of previous period instead of total loans. In the analysis, he controlled for macroeconomic characteristics that might change during the election years, and bank characteristics as well as bank and year fixed effects.
Micco et al. (2007) examined lending behavior of banks during elections, using a sample of banks from 179 countries for the period 1995-2002. They classified banks as a foreign bank or a public bank if more than 50% of its shares are owned by foreigners or government respectively while Dinç (2005) used 20% ownership share as a cutoff. They tested the same hypothesis as Dinç (2005) tested for a larger sample of countries and used the same definition of loan growth rate. They also found that in developing countries loan growth rate of public banks was significantly higher than that of private banks in election years. They did not find a significant relationship for developed countries.
Carvalho (2014) examined the effect of political influence on the decision making of public banks operating in Brazil for a period of 12 years from 1995-2006. He found that firms which are eligible for getting loans from public banks increase their employment in politically attractive regions prior to elections and these firms get larger amount of loans from public banks.
Iannotta et al. (2013) analyzed the lending behavior of banks during elections in 16 European countries (countries having public banks) for a period of 10 years, 2000-2009. They only included large commercial banks in their sample, i.e., banks which had total assets of more than 10 billion euros. They found that public banks in Europe increase their lending during elections. They also examined the effect of ownership of banks on their risks. They found that public banks have less default risk and more operating risk than that of private banks, and operating risk of public banks increases
11
during elections. Bank specific characteristics with time and bank fixed effects are controlled for all studies discussed in this section.
In summary, these studies show that political influence on lending behaviors of public banks exists. It is observed in developing countries, lending by public banks increases in elections. None of these studies examined the lending behavior of foreign banks during elections.
2.4 Empirical literature on lending behavior of banks by ownership type during business cycles and crisis
Brei and Schclarek (2015) presented a theoretical model related to bank lending and ownership behavior during crisis. They argued that during crisis, lending by public banks increases, as governments try to maintain liquidity in the markets during crisis periods. They also argued that primary motive of public banks is not to make profit but they are formed to help financial markets in difficult times to stabilize the economy. Public banks may also experience less deposit withdrawals during crisis as their credibility is higher and they have more funds to offer to financial markets. So, public banks are expected to play a positive role by increasing their lending during in crisis periods.
There are some studies that examine the relationship between GDP growth rates and lending by banks to examine the cyclicality of loan growth of banks with business cycle. Others examine lending behavior of banks by ownership type in crisis periods to study lending behavior of banks during crisis periods. Both kinds of studies are discussed here.
12
Micco and Panizza (2006) examined the lending behavior of banks by their ownership types over the business cycle. They studied both developing and industrial countries for a period of eight years, 1995-2002. They found that loan growth rate of public banks in developing countries is less pro-cyclical than those in industrial countries. For business cycle they used GDP growth rates of countries and their model controls for country and year fixed effects.
Bertay et al. (2015) examined the cyclicality of loan growth rate of banks by ownership with GDP per capita growth rate. Their sample included 111 countries and a period of 12 years, 1999-2010. They found that loan growth rate of public banks is less pro-cyclical than that of private banks. They measured credit growth rate in two ways; credit growth rate adjusted by GDP deflator and credit growth rate in real USD. Instead of GDP growth rate, they used growth rate of GDP per capita as a measure of business cycle. They also found that loan growth rate of public banks was more than private banks in periods with negative GDP growth rate.
Behr et al. (2017) analyzed the cyclicality of SME lending over the business cycle for government-owned banks. They studied the loans issued by German saving and cooperative banks for a period of 21 years, 1987-2007. They used GDP growth rate as a measure of business cycle and employed both systematic GMM and least squares methods. They found that lending by public banks is less pro-cyclical than other local banks as they found the negative coefficient for public-GDP interaction variable.
The above mentioned studies have used “GDP growth rate” or “GDP per capita growth rate” as independent variables to see how lending behavior of different banks changes with GDP growth rate. Instead of business cycle, some studies compare the lending behavior of banks by ownership types in crisis periods and non-crisis periods. These studies are discussed below.
13
Cull et al. (2013) examined the loan growth rate of public, private and foreign banks operating in Latin American and Eastern European countries for a period of six years from 2004 to 2009 that covers pre-crisis and global crisis periods. They used growth rate of loans as a dependent variable, and controlled for bank specific characteristics with fixed effects for country, bank and time. They found that private banks in both regions decreased their loan growth rates during the crisis periods. They also found that public banks in Latin America increased their lending significantly in crisis times. Foreign banks in Eastern Europe decreased their loan growth rates significantly in 2009.
Fungáčová et al. (2013) analyzed how credits provided by banks in Russia changed during the global financial crisis using quarterly data for the period 2007-2009. They found that foreign banks decreased their loan growth during crisis more than private
banks, while public banks increased their loan growth rate in the last quarter of 2008
and the first two quarters of 2009.
Brei and Schclarek (2013) studied lending behavior of 20 different countries from 1994-2009 mainly focusing on systematic banking crisis and global financial crisis of 2007-08. They applied nested regression model. Controlling for bank specific variables with time and country fixed effects, they found that public banks increased their lending and private banks decreased it during financial crisis.
Meriläinen (2016) studied lending behaviors of different types of banks during crisis of 2008-09 in 18 Western European countries for a period of 10 years, 2004-2013. He classified banks into four groups as commercial banks, cooperative banks, private savings banks and publicly owned savings banks. His main focus was to study the lending behavior of banks during financial and sovereign debt crisis. He found that loan growth rate of commercial and private saving banks decreased during crisis while loan growth rate of public saving and cooperative banks was not affected by these two crises.
14
In summary, it can be inferred from the literature that there is political influence on lending behavior of public banks. Politically connected firms get loans on better conditions from public banks and political use of public banks increases during election as in elections loan growth rate of public banks increases more than that of other banks. Loan growth rate of public banks is also found to be less pro-cyclical than that of private banks. Public banks are found to increase their lending during periods with negative GDP growth rates and in crisis.
15
CHAPTER 3
BANKING INDUSTRY, GDP AND ELECTIONS IN TURKEY
Turkey experienced banking and liquidity crisis in 2000 and 2001. After the crisis, Turkish banking restructuring program was introduced in May 2001. The aim of this program was to establish a strong and competitive banking system in Turkey, so that banking sector can overcome any upcoming crisis in a better manner. The Banking Regulatory and Supervisory Agency (BRSA) was established to regulate the banking sector in this period. The program included many reforms, such as strengthening capital structure of banks, operational and financial reconstruction of public banks, effective supervision structure, discipline and transparency in markets and establishment of asset management commission (BRSA, 2009). Two state banks (Ziraat and Halk) were operationally and financially restructured by increasing their capital adequacy ratio to more than 8%. In July 2001, six private banks which were unable to raise their capital to the required level were taken over by the BRSA.
3.1 Banking industry in Turkey after 2000
The banking sector of Turkey has been growing over the last decade. Figure 3.1 presents the total assets to GDP ratio from 2001 to 2015. The decrease in the first three years can be explained by the 2001-2002 crises. After 2003, the size of the banking sector has been increasing and by 2015 it is close to 0.9.
16
Figure 3.1: Total banking assets to GDP ratio
Turkish banking sector has both deposit and non-deposit banks. Deposit banks (Commercial banks) are allowed to collect deposits whereas non-deposit (investment and development) banks are not. Deposit banks have the largest share in terms of assets and loans in the Turkish banking sector as shown in Table 3.1. Although the function of non-deposit banks is to provide credits for investments, their share in the loan market decreased from 2001 to 2010 and after 2010 it has positive trend. The share of non-deposit banks in total loans was 14.4% in 2001 and it decreased to 3.7% in 2010 and it increased to 5.6% in 2015. - 0.10 0.20 0.30 0.40 0.50 0.60 0.70 0.80 0.90 1.00 2001 2002 2003 2004 2005 2006 2007 2008 2009 2010 2011 2012 2013 2014 2015
Total Assets/GDP
Total Assets/GDP17
Table 3.1: The shares of deposit and non-deposit banks in total assets and total loans of banking sector
Year Assets Assets Total Loans Total Loans
Deposit Banks Non- deposit banks Deposit Banks Non- deposit banks 2001 0.953 0.047 0.856 0.144 2002 0.956 0.044 0.886 0.114 2003 0.959 0.041 0.905 0.095 2004 0.963 0.037 0.929 0.071 2005 0.968 0.032 0.949 0.051 2006 0.968 0.032 0.955 0.045 2007 0.966 0.034 0.959 0.041 2008 0.968 0.032 0.959 0.041 2009 0.966 0.034 0.957 0.043 2010 0.968 0.032 0.963 0.037 2011 0.964 0.036 0.958 0.042 2012 0.959 0.041 0.954 0.046 2013 0.957 0.043 0.948 0.052 2014 0.955 0.045 0.947 0.053 2015 0.952 0.048 0.944 0.056
Table 3.2 shows the change in the number of deposit banks by ownership and the number of non-deposit banks operating in Turkey from 2001 to 2016. The number of public deposit banks is same in this period. Private deposit banks which were 22 in 2001 have declined to 9 in 2016. The number of foreign banks increased after 2005 and reached the maximum number in 2015. The number of non-deposit banks is 13 and has not changed since 2004. They are 3 public, 6 private and 4 foreign non-deposit banks.
18
Table 3.2: Number of deposit and non-deposit banks by ownership, 2001-2016
Year Public deposit banks Private deposit banks Foreign deposit banks Non-deposit banks 2001 3 22 15 15 2002 3 20 15 14 2003 3 18 13 14 2004 3 18 13 13 2005 3 17 13 13 2006 3 14 15 13 2007 3 11 18 13 2008 3 11 17 13 2009 3 11 17 13 2010 3 11 17 13 2011 3 11 16 13 2012 3 11 16 13 2013 3 11 17 13 2014 3 11 19 13 2015 3 9 21 13 2016 3 9 21 13
Figure 3.2 shows total loans-to-total deposits ratio of banks in Turkey. A monotonous increase in this ratio can be observed except 2009. After 2013, banks started to provide loans more than their deposits. Figure 3.3 shows “total loans-to-deposits ratio” of deposit banks by ownership. All banks have an increasing trend. Loan to deposit ratio of the foreign banks is the highest in the first ten years of sample period. After 2014, loan to deposit ratio of all banks is more than one indicating that they are providing more loans than collected deposits.
19
Figure 3.2: Total banking loan to deposit ratio
Figure 3.3: Loan/Deposits Ratio of Deposit banks by ownership types
0 0.2 0.4 0.6 0.8 1 1.2 1.4 2001 2002 2003 2004 2005 2006 2007 2008 2009 2010 2011 2012 2013 2014 2015
Loan/Deposits
Loan/Deposits 0 0.2 0.4 0.6 0.8 1 1.2 2001 2002 2003 2004 2005 2006 2007 2008 2009 2010 2011 2012 2013 2014 2015Loan/ Deposit by ownership types
Public Private Foreign
20
3.1.1 Deposit Banks by Ownership Type
Banks are classified into three in terms of their ownership as private, foreign and public owned. Figure 3.4 shows the share of assets of deposit banks by ownership in total assets of Turkish banking sector. The share of public deposit banks fluctuates around 30% for the whole period. In general, private banks have decreasing trend. In 2015, the share of private banks in total assets is less than 40%. The share of foreign banks in total assets increased after 2005 due to the increase in their number and their share is more that 28% in 2015.
Figure 3.4: Share of deposit banks by their ownership in total assets of banking sector
Figure 3.5 and Figure 3.6 show the share of deposit banks by ownership in total deposits and total loans of banking sector, respectively. The share of public banks in deposits was more than 40% in 2004 and after that it decreased a little bit but it consistently remained more than 30%. After 2003, deposit share of foreign banks increased and in 2015 it is near to 30%. The decrease in share of private banks is due to decrease in their number because they were purchased by foreigners.
0 0.1 0.2 0.3 0.4 0.5 0.6 0.7 2001 2002 2003 2004 2005 2006 2007 2008 2009 2010 2011 2012 2013 2014 2015
Share in Total Assets of Banking
sector
State-owned Deposit Banks
Privately-owned Deposit Banks
21
The share of private banks in loans of banking sector was more than 60% in the first five years except 2001 and it decreased after 2005 and it was less than 40% in 2015. The share in assets, deposits and loans of private banks decreased by large amount from 2014 to 2015 because of change in ownership of Garanti bank from private to foreign. Garanti bank is the third largest bank of Turkey by size and it holds more than 11% of total assets of the banking sector.
Figure 3.5: Share of deposit banks by their ownership in total deposits of banking sector
Figure 3.6: Share of deposit banks by their ownership in total loans of banking sector 0 0.1 0.2 0.3 0.4 0.5 0.6 0.7 2001 2003 2005 2007 2009 2011 2013 2015
Share in Total Deposits of
Banking sector
State-owned Deposit Banks Privately-owned Deposit Banks Foreign Banks 0 0.2 0.4 0.6 0.8 2001 2003 2005 2007 2009 2011 2013 2015Share in Total Loans of Banking
sector
State-owned Deposit Banks Privately-owned Deposit Banks Foreign Banks22
3.1.2 Loan growth rate of deposit and non-deposit banks
Figure 3.7 shows the annual loan growth rate of deposit and non-deposit banks from 2002 to 2015. A very similar pattern is observed for the total loan growth rate and loan growth rate of deposit banks because share of deposit banks in Turkish banking sector is more than 90%. More fluctuations in loan growth rate of non-deposit banks are observed.
Figure 3.8 shows the loan growth rate of deposit banks by ownership. A high loan growth rate of foreign banks can be seen in 2006 due to an increase in the number of foreign banks from 13 to 17.In general, loan growth rate of public banks is higher than that of private banks.
Figure 3.7: Annual loan growth rate of deposit and non-deposit banks
-0.2000 0.0000 0.2000 0.4000 0.6000 0.8000 2002 2003 2004 2005 2006 2007 2008 2009 2010 2011 2012 2013 2014 2015 2016
Annual Loan growth of deposit vs
Non-deposit banks
Total loans growth Deposit banks loan growth
Non-Deposit Banks loan growh
23
Figure 3.8: Loan growth rate of different deposit banks by ownership
3.2 Elections in Turkey
Table 3.3 shows the list of two major types of elections in Turkey: Local and general elections. Turkey had five general elections and three local elections from 2002 to 2016. The members of general assembly are selected in general elections. Local elections are conducted to select mayors and councilors.
Table 3.3: Elections in Turkey for the period 2002-2016
General elections Local elections Nov 2002 March 2004 July 2007 March 2009 June 2011 March 2014 June 2015 - Nov 2015 - (0.50) - 0.50 1.00 1.50 2.00 2.50 2002 2003 2004 2005 2006 2007 2008 2009 2010 2011 2012 2013 2014 2015
Loan growth of different deposit banks
State-owned Deposit BanksPrivately-owned Deposit Banks
24
3.3 GDP growth rate in Turkey
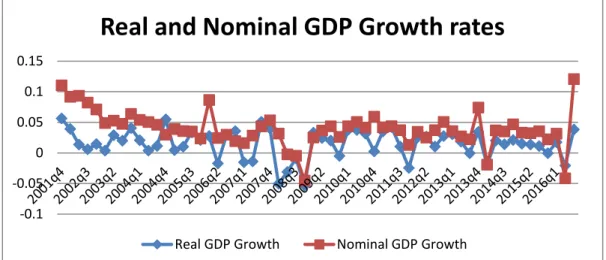
Figure 3.9 presents the quarterly real and nominal GDP growth rates in Turkey. High values of nominal GDP growth rate can be observed in the first few years due to high inflation while the real GDP growth rate is almost always less than 5%. Both real and nominal GDP growth rate were negative during the 2008 global financial crisis period. Industrial production growth rate of Turkey is also presented in Figure 3.10. Negative industrial production growth rate is observed in 2007-08. In general, industrial production growth rate in Turkey is less than 5% just like real GDP growth rate.
Figure 3.9: Real and nominal GDP growth rate in Turkey from 2001-2016
Figure 3.10: Industrial Production growth rate in Turkey
-0.1 -0.05 0 0.05 0.1 0.15
Real and Nominal GDP Growth rates
Real GDP Growth Nominal GDP Growth
-0.10000 -0.05000 0.00000 0.05000 0.10000 0.15000 0.20000 2001 q 4 2002 q 3 20 03 q 2 2004 q 1 2004 q 4 2005 q 3 2006 q 2 2007 q 1 2007 q 4 2008 q 3 2009 q 2 2010 q 1 2010 q 4 20 11 q 3 2012 q 2 2013 q 1 2013 q 4 2014 q 3 2015 q 2 2016 q 1
25
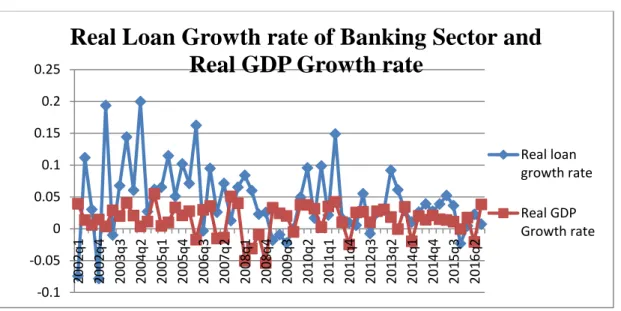
Figure 3.11 presents the graph of real GDP growth rate and real loan growth rate of banking sector of Turkey. In general, the values of growth rates of real loans are much higher than that of real GDP growth rate especially in positive GDP growth periods.
Figure 3.11: Real loan growth rate and real GDP growth rate in Turkey
-0.1 -0.05 0 0.05 0.1 0.15 0.2 0.25 2002 q 1 2002 q 4 2003 q 3 2004 q 2 2005 q 1 2005 q 4 20 06 q 3 2007 q 2 2008 q 1 2008 q 4 2009 q 3 20 10 q 2 2011 q 1 2011 q 4 2012 q 3 2013 q 2 2014 q 1 2014 q 4 2015 q 3 2016 q 2
Real Loan Growth rate of Banking Sector and
Real GDP Growth rate
Real loan growth rate Real GDP Growth rate
26
CHAPTER 4
EMPIRICAL MODELS AND DATA
4.1 Empirical Models
This section consists of two parts. The first part explains the model used to analyze the lending behavior of different types of banks by ownership (public, private and foreign) and by deposit collecting ability (deposit or non-deposit) in Turkey during elections. The second part explains the model that is used to test the relationship between loan growth rate and GDP growth rate.
4.1.1 Model for Lending Behavior during Election periods:
The following hypothesis is tested: H1: Loan growth rate of public banks (both
deposit and non-deposit banks) is higher than that of private banks during elections in Turkey, holding other factors constant. This hypothesis is developed by following the literature that public banks may be used for political reasons. Elections are events
27
which motivate the politicians to use government’s resources to increase their chances of election.
The following model is developed:
represents loan growth rate of bank i in period t, indicates bank fixed effects,
represents time dummy variables, includes control variables related to bank
characteristics, i.e. size, capital ratio, liquidity, ROA, net interest margin and loan loss provisions. Election and ownership are dummy variables for elections periods and
type of banks respectively and is error term. This model also controls for dummies
of quarters to control for seasonality in data.
Loan growth rate is calculated in six ways. The definitions of variables are described in Table 4.1. LGR1 and LGR2 are changes in loan amounts from one quarter to another normalized by previous period’s loans and assets respectively. Loans include both short-term and long-term loans. Loans with longer maturities given in previous quarters are expected to increase the total assets for future quarters as well, as total assets also includes the total amount of loans given by a bank. To capture this effect loans are also normalized by total assets besides previous periods’ loans as in (Dinç, 2005). LGR3 is the log value of loans in current quarter divided by loans of previous quarter. RLGR1 and RLGR2 are changes in real loan amounts from one quarter to another normalized by previous period’s real loans and real assets respectively. Real values of loans and assets are calculated by adjusting the nominal values of loans and assets with Consumer Price Index of Turkey. RLGR3 is the log value of real loans in current quarter divided by real loans of previous quarter.
28
Election is a dummy variable which takes a value “1” for the election quarters and one quarter before the election and “0” otherwise. It can be argued that government-owned banks may start to provide loans for political reasons before the election. Therefore, another set of election dummy variable is created that is equal to 1 for election quarter and two quarters prior to election quarter. For robustness, the models are also estimated by taking only election quarters.
Two types of elections in Turkey are examined in this study: general elections and local elections. Loan growth rate of public banks is expected to increase in both elections. Both general and local elections are tested separately and combined.
Banks are grouped into categories on the basis of their ownership and their deposit collection activity. Public, private and foreign banks are sub-divided into deposit and non-deposit banks categories. Pub1, pub2, pvt1, pvt2, for1 and for2 represents the dummy variables for public deposit, public deposit, private deposit, private non-deposit, foreign deposit and foreign non-deposit banks respectively. A positive and significant coefficient of the public bank-election interaction variable is expected if loan growth rate of public banks increases during elections more than that of private banks.
The capacity of a bank to give loans depends upon the size of bank and the liquid assets it owns. Size and liquidity are added as control variables. The signs of these variables are expected to be positive. Banks adjust their capital ratio based on their lending behavior, so capital ratio is also included as another control variable and its expected sign is also positive. Net interest margin includes the net interest income which includes both interest on loans (earnings) and interest on deposits (expenses). The higher the value of this variable, the higher its earnings on loans. It will increase bank’s future lending capacity and its willingness to lend. This variable is also expected to have a positive sign. Loan loss provision is included in the model to control for bank risk. If these provisions are high, it is expected that loan growth rate of banks will be less, so a negative coefficient is expected for this variable.
29
Table 4.1: Definition of Variables
Variable Definition
Loan Growth Rates:
LGR1 (loans in t - loans in t-1)/ loans in t-1
LGR2 (loans in t - loans in t-1)/Assets in t-1
LGR3 log(loans in t/ loans in t-1)
RLGR1 (real loans in t – real loans in t-1)/ real loans in t-1
RLGR2 (real loans in t - real loans in t-1)/ real assets in t-1
RLGR3 log(real loans in t/ real loans in t-1)
Control variables:
Size Log (total assets)
Liquidity liquid assets/total assets
Capital Ratio Equity/total assets
ROA Net profit/total assets
NI margin Net interest margin = (Net interest income/total assets)
LLP Loan loss provisions = (Loan loss provisions/ total loans)
Ownerships variables: Pub Pub1
Dummy variable for public banks (Both deposit and non-deposits)
Dummy variable for public deposit banks
Pub2 Dummy variable for public Non-deposit(Investment) banks
Pvt Dummy variable for private banks (Both deposit and
non-deposits)
Pvt1 Dummy variable for private deposit banks
Pvt2 Dummy variable for private Non-deposit(Investment) banks
For Dummy variable for foreign banks (Both deposit and
non-deposits)
For1 Dummy variable for foreign deposit banks
For2 Dummy variable for foreign Non-deposit(Investment) banks
Elections Variables:
Elections1q Dummy variable for elections quarters, Takes value “1” (for
elections quarter and one quarter before elections) and “0” otherwise.
Elections2q Dummy variable for elections quarters, Takes value “1” (for
elections quarter and two quarters before elections) and “0” otherwise.
Elections0q Dummy variable for elections quarters, Takes value “1” (for
elections quarter only) and “0” otherwise. GDP Variables:
GDP Growth Quarterly growth rate in GDP (calculated separately for both
nominal and real GDP)
GDP Negative GDP growth rate of that quarter if GDP growth rate is negative
and 0 otherwise
GDP Positive GDP growth rate of that quarter if GDP growth rate is positive
30
All loan growth variables exhibit fourth order autocorrelation. Four lags of loan growth rates are included in the model in order to control for autocorrelation. The correlation coefficients of loan growth rates with p-values (significance level) are presented in Table 4.2.
Table 4.2: Correlation coefficients of loan growth rates Variables LGR1 LGR2 LGR3 RLGR1 RLGR2 RLGR3 1st lag 0.1557 0.1992 0.128 0.1214 0.1623 0.0954 (0.000) (0.000) (0.000) (0.000) (0.000) (0.000) 2nd lag 0.1589 0.1915 0.1526 0.1628 0.1831 0.156 (0.000) (0.000) (0.000) (0.000) (0.000) (0.000) 3rd lag 0.0679 0.0766 0.0503 0.0549 0.0566 0.038 (0.007) (0.002) (0.045) (0.029) (0.022) (0.130) 4th lag 0.0977 0.0689 0.0808 0.1203 0.0944 0.1051 (0.000) (0.006) (0.001) (0.000) (0.000) (0.000)
4.1.2 Model for Lending Behavior and Business cycle:
Two hypotheses are tested to examine the relationship between lending behavior of
banks during business cycle: H2: Lending by public banks (both deposit and
non-deposit) banks is less pro-cyclical than private banks in Turkey holding other factors
constant. H3: Loan growth rate of public banks is higher than that of private banks in
negative GDP growth rate periods, holding other factors constant. Private banks are expected to decrease their lending during recessions due to high uncertainty in the economy. Moreover, government wants to maintain liquidity and capital flow in the economy and injects funds in market through loan provisions by public banks.
31
The following model is estimated to analyze how lending behavior of banks by ownership changes with the growth rate in GDP as in (Behr et al., 2017).
All control and ownership variables are same as presented in equation 4.1. GDP growth rate is measured using both nominal and real GDP. Nominal GDP growth rate is used in the model for nominal loan growth rates and real GDP growth rate is used in the model for real loan growth rates. The sign of coefficient of interaction variable of GDP growth rate with public banks (pub, pub1 and pub2) is expected to be negative if public banks act less pro-cyclically than private banks do.
Endogeneity is observed between loan growth rate of banks and GDP growth rate. The results of endogeneity test are shown in empirical results section along with regression estimates. Ordinary least squares (OLS) estimates will not give consistent results. Instead of OLS, one-step system GMM method is used to estimate the results
as in Behr et al. (2017). This method takes instruments based on the first difference
equation which eliminates the bank fixed effects.
To examine how lending behavior of banks changes during periods with negative and positive GDP growth rates, the model presented in equation 4.3 is used. A positive and significant coefficient is expected for the interaction variable (GDP negative * Pub), if loan growth rate of public bank is higher than that of private banks during negative GDP growth rate periods.
32 4.2 Data
Bank related variables are obtained from the quarterly financial statements of banks published by Turkish Banking Association. The sample period covers 15 years, from December 2001 to September 2016. All banks operating in Turkey are included in the sample. Foreign banks that are not established in Turkey but operating with their branches are excluded. The umbrella bank of failed banks (Birlesik Fon Bankasi) and the Bank for the depository of the securities traded in Borsa Istanbul (Takasbank) are excluded from the sample. The distributions of banks by their ownership and by their deposit collecting ability are reported in Table 4.3. The number of banks during the sample period increased from 30 in 2001 to 33 in 2016. There was no change in the number of public banks but some of the private banks were purchased by foreigners and they continued to operate as foreign banks. Private deposit banks are decreased in number from 14 in 2001 to 8 in 2016 and foreign deposit banks in increased from 4 in 2001 to 13 in 2016.
33
Table 4.3: The number of deposit and non-deposit banks by ownership
Year Pub1 Pub2 Pvt1 Pvt2 For1 For2 Total
2001 3 3 14 4 4 2 30 2002 3 3 14 4 4 2 30 2003 3 3 14 4 4 2 30 2004 3 3 14 4 4 2 30 2005 3 3 14 4 4 2 30 2006 3 3 12 4 6 2 30 2007 3 3 10 4 8 2 30 2008 3 3 10 4 8 2 30 2009 3 3 10 4 8 2 30 2010 3 3 10 4 8 2 30 2011 3 3 10 4 8 2 30 2012 3 3 11 4 8 2 31 2013 3 3 10 4 10 2 32 2014 3 3 10 4 11 2 33 2015 3 3 8 4 13 2 33 2016 3 3 8 4 13 2 33
Table 4.4: Descriptive statistics of variables
Variables Mean Median S.D Min. Max. N
LGR1 0.134 0.062 0.994 -1.000 26.000 1766 LGR2 0.041 0.032 0.081 -0.533 1.431 1803 LGR3 0.082 0.060 0.209 -1.413 3.296 1763 RLGR1 0.109 0.038 0.962 -1.000 25.221 1766 RLGR2 0.029 0.019 0.079 -0.534 1.366 1803 RLGR3 0.060 0.037 0.208 -1.420 3.267 1763 Assets 29.492 5.183 54.122 0.005 329.749 1836 Capital ratio 0.218 0.128 0.207 -0.033 0.980 1836 Liquidity 0.330 0.311 0.178 0.000 0.904 1836 ROA 0.007 0.008 0.034 -0.415 0.229 1836 NI margin 0.035 0.027 0.039 -0.042 0.714 1836 LLP 0.019 0.008 0.057 0.000 1.315 1799
34
Table 4.4 presents the descriptive statistics of variables of all banks for the period 2001-2016. There are extreme values of loan growth rates. Some of these values can be explained by the entry of new banks to the Turkish banking industry and by the mergers and the acquisitions. For example, Tokyo-Mitsubishi had a growth rate of 2007.7% in the first quarter of 2014. It entered into the market in December 2013 with the loan provision of 13 million TL loans and in next quarter its loans were increased to 274 million. Another example is Pasha Yatirim Bank whose loans increased 27 times in December 2003 from 1 million TL to 27 million TL. Although their loan amounts are small compared to loans issued by other banks, the low loan balance in the previous period makes its loan growth rate very high. Total loans of Fiba bank decreased from 0.12 million to 0 in 2002 showing a loan growth of -1. This bank was sold to Nova Bank S.A in the first quarter of 2002. Its loan level increased and showed positive loan growth with loans of 332 million TL at the end of 2005. This change in loan value from 0.12 to 0 and having a very low growth rate (-100%), may distort the results. In order to get meaningful results, the sample is winsorized at 2% using loan growth rate.
Table 4.5 presents the descriptive statistics of variables for the winsorized sample of all banks for the period 2001-2016. The models are estimated using the winsorized sample. The major models are also estimated using the full sample and reported in the Appendix. Descriptive statistics of all variables of full sample by bank groups are presented in tables A1 and A2 in appendix section.
It is observed that mean value of LGR1 has now decreased from 0.134 to 0.078 and standard deviation which was almost 1 before is now 0.12. LGR2 is lower than LGR1 as loan growth in LGR2 is normalized by assets instead of loans.
Total assets of banks are presented in billions of TL. The mean value of assets is 30.215 billion TL and median is 5.613 billion TL showing variations in size of banks in the sample. The mean value of capital ratio is 0.213 but maximum value is 0.955. High values of capital ratio are mostly found in non-deposit banks. Liquidity ratio has
35
mean value of 0.329 but it also has very extreme values. The loan loss provisions had a maximum value of 1.315 which is for Halk bank (public deposit bank) in the fourth quarter of 2001 after the crisis.
The large differences in minimum and maximum values of all variables are due to presence of six different types of banks in sample. Mean values of all variables of banks grouped by ownership and deposit collection abilities are shown in Tables 4.6 and 4.7. T-statistics are also performed in order to test whether there is a difference in the mean values of variables by banks in terms of their ownership and depository holdings. The values in brackets show the value of t-statistic that tests whether the mean value of the variable in that group is significantly different from the mean value of the other banks. The values in the first row show the difference in mean values of the variable between other groups and that specific group.
Table 4.5: Descriptive statistics of variables for winsorized Sample
Variables Mean Median S.D Min. Max. N
LGR1 0.078 0.061 0.120 -0.333 0.695 1719 LGR2 0.037 0.031 0.057 -0.210 0.342 1756 LGR3 0.069 0.059 0.107 -0.405 0.528 1719 RLGR1 0.054 0.037 0.117 -0.359 0.622 1719 RLGR2 0.025 0.019 0.056 -0.212 0.319 1756 RLGR3 0.047 0.036 0.107 -0.445 0.484 1719 Assets 30.215 5.613 54.635 0.005 329.749 1789 Capital ratio 0.213 0.126 0.202 -0.033 0.955 1789 Liquidity 0.329 0.311 0.176 0.000 0.904 1789 ROA 0.007 0.008 0.033 -0.415 0.229 1789 NI margin 0.034 0.027 0.038 -0.042 0.714 1789 LLP 0.018 0.008 0.055 0.000 1.315 1755
36
Table 4.6: Descriptive statistics of loan growth rates by bank groups (Winsorized Sample) Type LGR1 LGR2 LGR3 RLGR1 RLGR2 RLGR3 For1 Mean 0.075 0.038 0.066 0.053 0.026 0.046 Min. -0.333 -0.150 -0.405 -0.359 -0.153 -0.445 Max. 0.621 0.321 0.483 0.556 0.261 0.442 N 419 423 419 419 423 419 For2 Mean 0.078 0.033 0.064 0.055 0.025 0.043 Min. -0.241 -0.132 -0.276 -0.251 -0.137 -0.289 Max. 0.539 0.277 0.431 0.505 0.260 0.409 N 78 111 78 78 111 78 Pub1 Mean 0.076 0.028 0.072 0.053 0.019 0.049 Min. -0.121 -0.024 -0.129 -0.156 -0.033 -0.169 Max. 0.366 0.100 0.312 0.339 0.094 0.292 N 177 177 177 177 177 177 Pub2 Mean 0.055 0.038 0.051 0.032 0.023 0.028 Min. -0.174 -0.142 -0.191 -0.206 -0.169 -0.231 Max. 0.328 0.249 0.284 0.293 0.251 0.257 N 177 177 177 177 177 177 Pvt1 Mean 0.083 0.036 0.074 0.058 0.025 0.051 Min. -0.301 -0.210 -0.359 -0.332 -0.212 -0.403 Max. 0.695 0.282 0.528 0.618 0.265 0.481 N 650 650 650 650 650 650 Pvt2 Mean 0.089 0.048 0.074 0.065 0.034 0.051 Min. -0.310 -0.195 -0.372 -0.327 -0.207 -0.397 Max. 0.688 0.342 0.523 0.622 0.319 0.484 N 218 218 218 218 218 218 Overall Mean 0.078 0.037 0.069 0.054 0.025 0.047 Min. -0.333 -0.210 -0.405 -0.359 -0.212 -0.445 Max. 0.695 0.342 0.528 0.622 0.319 0.484 N 1719 1756 1719 1719 1756 1719
37
Table 4.6 shows that mean value of loan growth rate of foreign deposit and non-deposit banks is almost same. While mean value of loan growth rate of public non-deposit banks is more than public non-deposit banks which can be due to large size of public deposit banks as the difference in values of LGR1 and LGR2 is higher for deposit banks than that of deposit banks. Loan growth rate of private deposit and non-deposit banks is also similar. T-statistics of loan growth variables show that average loan growth rate of public non-deposit banks is 0.055 (for LGR1) and it is significantly less than the growth rate of other types of banks with a mean difference of 0.025.
From Tables 4.7 and 4.8, it is observed that mean value of assets of public deposit banks is 93.1 billion TL, whereas mean value of assets of foreign deposit bank and private deposit banks are 18.6 billion TL and 40.9 billion TL, respectively. The mean value of total assets of public and private deposit banks is significantly higher than other banks and the mean size of all non-deposit banks and foreign deposit banks is significantly less than other banks. Capital ratio of deposit banks is significantly less than non-deposit banks, regardless of their ownership. The former banks have higher liquidity ratio than non-deposit banks. ROA of foreign non-deposit banks is significantly less than other banks.
In summary, it is observed that size of public and private deposit banks is significantly more than other banks. Capital ratio of deposit banks is significantly less than non-deposit banks. Liquidity ratio of deposit banks is significantly more than non-deposit banks.
38
Table 4.7: Descriptive statistics of bank characteristics by bank groups (Winsorized Sample)
Type Assets
Capital
ratio Liquidity ROA
NI margin LLP For1 Mean 18.658 0.150 0.356 0.005 0.030 0.013 Min. 0.013 0.040 0.003 -0.175 -0.004 0.000 Max. 269.638 0.925 0.904 0.042 0.352 0.283 N 430 430 430 430 430 427 For2 Mean 0.637 0.462 0.315 -0.030 0.035 0.028 Min. 0.005 0.045 0.000 -0.400 0.000 0.000 Max. 2.243 0.944 0.900 0.075 0.588 0.748 N 113 113 113 113 113 82 Pub1 Mean 93.113 0.098 0.461 0.011 0.029 0.038 Min. 9.336 0.024 0.005 -0.067 0.003 0.001 Max. 329.749 0.137 0.792 0.034 0.219 1.315 N 180 180 180 180 180 180 Pub2 Mean 7.859 0.501 0.217 0.020 0.044 0.008 Min. 0.396 0.086 0.000 -0.179 0.004 0.000 Max. 59.086 0.817 0.524 0.229 0.267 0.362 N 180 180 180 180 180 180 Pvt1 Mean 40.934 0.114 0.343 0.008 0.030 0.017 Min. 0.073 -0.033 0.004 -0.415 -0.042 0.000 Max. 292.882 0.459 0.850 0.065 0.369 0.364 N 664 664 664 664 664 664 Pvt2 Mean 2.728 0.362 0.227 0.016 0.051 0.017 Min. 0.037 0.104 0.000 -0.155 0.005 0.000 Max. 22.870 0.955 0.513 0.108 0.714 0.385 N 222 222 222 222 222 222 Overall Mean 30.215 0.213 0.329 0.007 0.034 0.018 Min. 0.005 -0.033 0.000 -0.415 -0.042 0.000 Max. 329.749 0.955 0.904 0.229 0.714 1.315 N 1789 1789 1789 1789 1789 1755