See discussions, stats, and author profiles for this publication at: https://www.researchgate.net/publication/275027086
Detecting the Long Term Cyclical Behaviour of the Turkish Stock Market by
Means of Spectral Analysis
Article in International Research Journal of Finance and Economics · May 2011
CITATIONS 2 READS 110 2 authors, including: Cüneyt Akar
BANDIRMA ONYEDİ EYLÜL ÜNİVERSİTESİ 30PUBLICATIONS 129CITATIONS
SEE PROFILE
All content following this page was uploaded by Cüneyt Akar on 16 April 2015.
ISSN 1450-2887 Issue 67 (2011) © EuroJournals Publishing, Inc. 2011 http://www.eurojournals.com/finance.htm
Detecting the Long Term Cyclical Behaviour of the Turkish
Stock Market by Means of Spectral Analysis
Cüneyt Akar
Department of Business Administration, Bandirma Faculty of Economics and Business Administration Balikesir University, Bandirma/Balikesir Turkey
E-mail: [email protected] Zehra Baskaya
Department of Business Administration, Faculty of Economics and Business Administration Uludag University, Bursa/ Turkey
E-mail: [email protected]
Abstract
This paper explores long term cycles in Turkish stock market returns. Weekly data for five indices (ISE-100, Industrial Index, Financial Index, Services Index and Technology Index) in the Istanbul Stock Exchange were examined using a spectral analysis during the period of February 1986-March 2010. The results illustrate that the 40 month (Kitchin) cycle is the dominant long term cycle for the investigated indices.
Keywords: Spectral analysis, stock returns, long term cycles JEL Classification Codes: G12, G14
1. Introduction
A time series can be analysed by using two common approaches: (1) time domain analysis and (2) frequency domain analysis. Time domain analysis generally uses autocorrelation and partial autocorrelation functions to explain time series behaviours, while frequency domain analysis (also called spectral analysis) explains fluctuations in a time series in terms of sine and cosine functions at various frequencies (Wei, 1993:206).
The long term cyclical behaviour of a financial time series can best be described by a frequency domain analysis because cycles are more explicitly observed and represented in the frequency domain (Wang, 2008). While the frequency domain is a powerful tool for analysing time series in economics/finance, it has not been used frequently in the literature because of the computational burden. Some examples are written by Granger (1966); Rausser and Cargill(1970); Murphy(1987);
King and Rebelo(1993); Thoma(1994); Garcia-Ferrer and Queralt(1998); Hong(1999);
Bjornland(2000); Coshall(2000); Sayan and Sayan(2002); Breitungand and Candelon (2006); Orlov(2006); Wong and McAleer(2009).
Financial time series, especially stock returns, may exhibit a cyclic regularity. The most popular long term cycles include the January Effect, Kitchin Cycle, Juglar Cycle and Kondratieff Cycle. The January effect, also known as the turn-of-the year effect, is a calendar-related anomaly illustrating stocks rising during the first month of the year. The Kitchin Cycle is a 40 month cycle. The Juglar Cycle is the most widely known economic cycle; it illustrates boom and bust waves every 9 years. The
International Research Journal of Finance and Economics - Issue 67 (2011) 161 Kondratieff Cycle is a long term cycle which lasts about 54 years. In the study, Kondratieff Cycle cannot be explored, since there is not enough data available (Korotayev and Tsirel, 2010; Wong and McAleer, 2009).
The aim of this study is to examine the long term cyclical behaviour of the Turkish Stock Market by means of a spectral analysis. To detect the cycles, weekly data from the 100 Index, ISE-Industrial Index, ISE-Services Index, ISE-Financial Index and ISE-Technology Index of Istanbul Stock Exchange are analysed in the frequency domain.
The rest of this paper is organized as follows. Section 2 presents the related literature. Section 3 introduces the terminology and logic of spectral analysis. Section 4 presents the data used. The empirical results from the frequency domain analysis in the Turkish Stock Market are presented in Section 5. Section 6 discusses the conclusions.
2. Literature Review
Many studies have examined the cyclical behaviour of stock market returns. Sarantis (2001) investigates the stock price growth rates of seven major industrial countries (G-7) by using a smooth transition autoregressive (STAR) model. According to the results, United States stock prices have a 4 month cycle in the middle regime and 9 month cycle in other regimes. On the other hand, German, United Kingdom (UK) and Canadian stock prices have an average 5 month cycle in the upper regime and long period cycles in the lower regime (5 years for Canada, 2 years for UK and 1 year for Germany). Edwards et al. (2003) focused on the emerging markets and included four Latin American and two Asian countries in their study. They report that cycles in emerging markets have a shorter duration than those of developed countries. Their results also indicate that, in contrast to Asian markets, Latin American stock markets have behaved more similarly to developed markets after financial liberalization. Yan at al. (2007) identified bull and bear market cycles in the Chinese stock market and found the average duration of bull markets to be 15.13 months for the Shanghai Stock Exchange and 16.86 months for the Shenzhen. The average duration of bear markets is 10.14 months for Shanghai and 11.83 months for Shenzhen.
Many studies have also examined stock markets using spectral analysis. Granger and Morgenstern (1963) analysed the New York Stock Market prices and found weakly significant cycles. Bertoneche (1979) examined the weekly European stock returns and was not able to detect any significant cycles. Giudici and Simpson (2009) proposed that by using weekly data, one can detect a two week cycle. For this reason, they sampled the Standard and Poor’s 100 Index (S&P100) data within the daily, weekly and monthly subsets every 5 minutes. In this way, they were able to observe intraday cycles.
McCullough (1995) investigated 20 stocks from the New York Stock Exchange (NYSE) by spectral analysis and concluded that stock price changes are not white noise. Praets (1979) proposed two tests to detect whether stock price changes are white noise by using indices in the Melbourne Stock Exchange. He found that 9 indices were not white noise and 8 indices weakly deviated from white noise. Wong ve McAleer (2009) investigated the impact of the presidential election cycle on stock prices by using S&P data. According to the empirical results, stock prices in the United States of America (USA) exhibited a 200 week (about 4 year) Presidential Election Cycle.
Orlov (2006) examined the link between capital controls and stock market volatility in the frequency domain. Uebele and Ritschl (2009) explored the co-movement between stock markets and various indicators of real investment in Germany before World War I. Smith (2001) studied the co-movements among the Pacific Rim markets in the period of the pre and post 1987 crash. The results showed that the co-movements increased among the markets during the post crash period. Sato (2008) and Giampaoli et al. (2009) used spectral methods to analyse high frequency financial data.
The numbers of studies that have analyzed the Turkish stock market by using frequency domain analysis are very limited. Sayan and Sayan (2002) showed that the joint Time-Frequency Representation (TFR) techniques can be used in the analysis of stock market data. They analyzed the
ISE-100 Index of the Istanbul Stock Exchange by using various TFR techniques and compared their performance.
3. Univariate Spectral Analysis
The univariate spectral analysis is used to identify periodic behaviour in a time series. It detects significant cycles within a single time series by estimating dominant sinusoidal components. Any
stationary time series, with a sample of t observations, y0,KKyt−1, can be modelled by an expression
in the following form:
0 cos( ) sin( ) n t j j j j t j y
α
w tβ
w tε
= =∑
+ + (1)Where: wj is the angular frequency and
ε
t is the error term. φ is the phase that αj =Ajcosφ ,sin
j Aj
β = − φ and Aj is the amplitude. The expression (1) is also called the Fourier decomposition of
t
y (Wong and McAleer, 2009).
The periodogram is a plot which illustrates the contribution of wj to the total sum of squares.
For the periodogram analysis, the coefficientsαj,βj and Aj, can be estimated by the least squares
method. In order to determine theαj,βj coefficients, equation (2) is minimized.
2 0 ( , ) ( cos( ) sin( )) n j j t j j j j j y w t w t
π α β
α
β
= =∑
− − (2)After estimating the numerical values of αjandβjat any period, the squared amplitude at a
period of interest can be computed by equation (3).
2 2 2
j j j
A =
α
+β
(3)According to Harvey (1993), the peridogram is an unbiased estimator of the cyclical properties of the time series, but it is not consistent. This problem can be overcome by smoothing the periodogram values by a weighted moving average transformation. Smoothing eliminates the background noise from the periodogram and allows the underlying form to be more insulated. The most commonly used smoothers are Daniel, Tukey-Hamming, Parzen, Bartlett, Kaiser-Bessel and
Welch windows. In this study, Tukey-Hamming Window is used for smoothing.1
4. Data
The data for this study consists of weekly time series data from Istanbul Stock Exchange 100 Index (ISE-100) and 4 sector indices (Industrial Index, Services Index, Financial Index and Technology Index). The sample periods begin in February 1986 for the ISE-100; January 1991 for the Industrial Index; January 1991 for the Financial Index, January 1997 for the Services Index; and July 2000 for the Technology Index; all continue up through March 2010. The observations are taken from the Electronic Data Delivery System of the Central Bank of the Republic of Turkey. Since the stock market prices are a non-stationary series, we transform the data by calculating the logarithmic difference of the stock market index;
1
log( ) log( )
t t t
r = P − P−
(4)
Where, rt is the weekly logarithmic return and Pt is the index at time t .
Table 1 illustrates the basic statistics for the return series. The mean returns are all positive, but close to zero. The returns for the Financial and Technology indices are negatively skewed. The returns
1
The choice of window width affects the results. But there is no exact way of selecting width. In this study window width is selected by trial and error method.
International Research Journal of Finance and Economics - Issue 67 (2011) 163 for all indices are leptokurtic. According to the Jarque-Bera normality test, all stock return series are not normally distributed. The spectral analysis requires that a series be stationary. If the series is not stationary, it will cause leakage problems in the spectral analysis. A leakage is a problem that occurs when the respective frequency will leak into the neighbouring frequencies. The Augmented Dickey Fuller (ADF) tests for the unit root in which the Akaike Information Criterion (AIC) is used to determine the lag length and shows that all returns are stationary.
Table 1: Basic statistics for stock returns
ISE-100 Industrial Financial Services Technology
Sample size 1257 1001 1001 688 506 Mean 0.0080 0.00751 0.0078 0.0051 0.0001 Std. Deviation 0.059 0.051 0.062 0.051 0.052 Maximum 0.534 0.269 0.218 0.234 0.177 Minimum -0.221 -0.219 -0.274 -0.201 -0.230 Skewness 0.655 0.005 -0.036 0.056 -0.692 Kurtosis 9.185 5.546 4.851 5.832 5.557 J-B Normality 2093.328* 270.317* 143.114* 230.230* 178.186* ADF -26.807 -23.621* -23.981* -21.426* -16.876*
*: significant at %5 ADF: Augmented Dickey-Fuller Test for stationarity
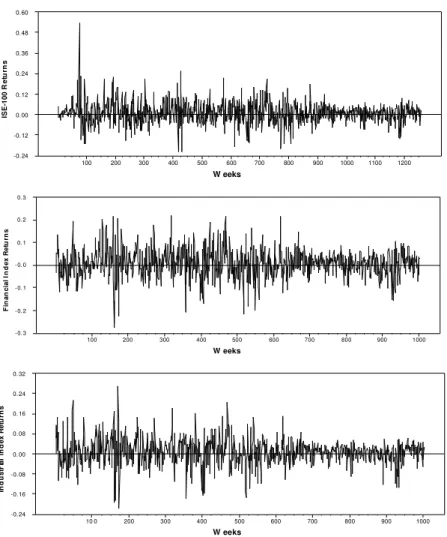
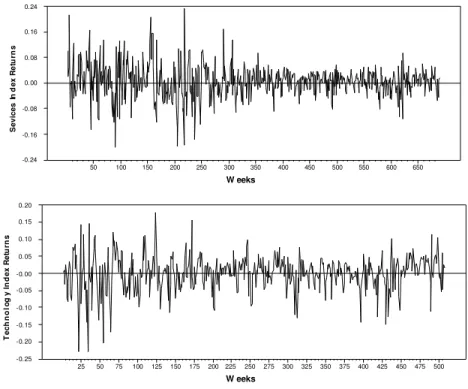
A plot of the weekly returns series are shown in Figure 1. Figure 1 shows that the stock return variance has been oscillating with alternating periods of high and low volatility. Thus, it can be suggested that stock returns may exhibit a cyclical pattern.
Figure 1: Logarithmic returns
W eeks IS E -1 0 0 R e tu rn s 100 200 300 400 500 600 700 800 900 1000 1100 1200 -0. 24 -0. 12 0. 00 0. 12 0. 24 0. 36 0. 48 0. 60 W eeks F in a n c ia l In d e x R e tu rn s 100 200 300 400 500 600 700 800 900 1000 - 0. 3 - 0. 2 - 0. 1 - 0. 0 0. 1 0. 2 0. 3 W eeks In d u s tr ia l In d e x R e tu rn s 10 0 200 300 400 500 600 700 800 900 1000 -0. 24 -0. 16 -0. 08 0. 00 0. 08 0. 16 0. 24 0. 32
W eeks S e v ic e s I n d e x R e tu rn s 50 100 150 200 250 300 350 400 450 500 550 600 650 -0.24 -0.16 -0.08 0. 00 0. 08 0. 16 0. 24 W eeks T e c h n o lo g y I n d e x R e tu rn s 25 50 75 100 125 150 175 200 225 250 275 300 325 350 375 400 425 450 475 500 -0. 25 -0. 20 -0. 15 -0. 10 -0. 05 -0. 00 0. 05 0. 10 0. 15 0. 20
5. Empirical Results
Figure 2 plots periodograms of weekly returns on the stock market indices. The vertical axis shows the contribution of a particular frequency (or period of time) to the total sum of squares. The horizontal
axis represents time in terms of the fraction of
π
. According to Figure 2, there are significant peaks inthe region of 160 weeks, 52 weeks and 26 weeks for the ISE-100 Index return. These results suggest that the Kitchen cycle, January effect and 6 month cycle are dominant cycles for the ISE-100 Index
returns.2
The Kitchin cycle and January effect can also be observed for the Industrial and Financial indices, but there is no significant peak in the region of 6 months. The periodograms for services and technology indices are a little bit different than the other indices. Two year significant cycles are detected for the services and technology indices. Furthermore, a 1.5 year significant peak occurs for the technology index returns. The Kitchin cycle can also be observed in the services index returns.
As a result of the study, we don’t find any evidence of the existence of the Juglar cycle for any indices. In the literature, some studies explore the presidential election cycles on the stock returns. According to law, elections have to occur every 4 years in Turkey, but in the sample period, this is not the case. Many times elections are made before 4 years were completed. Therefore, we expect no president election cycle in the stock returns. The periodograms also show that the presidential election cycle does not exist in the Turkish stock market.
2
International Research Journal of Finance and Economics - Issue 67 (2011) 165 Figure 2: Periodograms for Returns
F rac t io n s o f P i 0 . 0 0 .2 0 . 4 0 . 6 0 . 8 1 . 0 0 .0 0 0 0 0 0 .0 0 0 2 5 0 .0 0 0 5 0 0 .0 0 0 7 5 0 .0 0 1 0 0 0 .0 0 1 2 5 0 .0 0 1 5 0 0 .0 0 1 7 5 0 .0 0 2 0 0
(a) Periodogram for ISE-100 Index(Ordinates=1000)
F rac t io n s o f P i 0 . 0 0 .2 0 . 4 0 . 6 0 . 8 1 . 0 0 .0 0 0 0 0 0 .0 0 0 2 5 0 .0 0 0 5 0 0 .0 0 0 7 5 0 .0 0 1 0 0 0 .0 0 1 2 5 0 .0 0 1 5 0 0 .0 0 1 7 5 0 .0 0 2 0 0
(b) Periodogram for Financial Index (Ordinates=1000)
F r a c t i o n s o f P i 0 . 0 0 . 2 0 . 4 0 . 6 0 . 8 1 . 0 0 . 0 0 0 0 0 . 0 0 0 2 0 . 0 0 0 4 0 . 0 0 0 6 0 . 0 0 0 8 0 . 0 0 1 0 0 . 0 0 1 2 0 . 0 0 1 4
(c) Periodogram for Industrial Index (Ordinates=1000)
F r a c t io n s o f P i 0 . 0 0 . 2 0 . 4 0 . 6 0 . 8 1 . 0 0 . 0 0 0 1 2 0 . 0 0 0 2 4 0 . 0 0 0 3 6 0 . 0 0 0 4 8 0 . 0 0 0 6 0 0 . 0 0 0 7 2 0 . 0 0 0 8 4 0 . 0 0 0 9 6 0 . 0 0 1 0 8
(d) Periodogram for Services Index (Ordinates=500)
F r a c t io n s o f P i 0 . 0 0 . 2 0 . 4 0 . 6 0 . 8 1 . 0 0 . 0 0 0 0 0 . 0 0 0 2 0 . 0 0 0 4 0 . 0 0 0 6 0 . 0 0 0 8 0 . 0 0 1 0 0 . 0 0 1 2
(e) Periodogram for Technology (Ordinates=500)
6. Conclusions
In this study, the long term cyclical behaviour of the Turkish stock market was investigated. The results illustrate that 160 weeks, 52 weeks, 2 years and 1.5 year cycles were detected for the various indices. This information can be useful for long term Turkish stock investors. The results also provide information about the differences in the cycles for the various sectoral indices.
References
[1] Bertoneche, M. L. 1979. Spectral analysis of stock market prices. Journal of Banking and
Finance (3), 201-208.
[2] Bjornland, H.C. 2000. Detrending methods and stylized facts of business cycles in Norway: An
international comparison. Empirical Economics 25(3), 369-392.
[3] Coshall, J.T. 2000. Spectral analysis of overseas tourists’ expenditures in the United Kingdom.
Journal of Travel Research (38), 292-298
[4] Breitung, J., Candelon, B., 2006. Testing for short- and long-run causality: A frequency domain
approach. Journal of Econometrics 132, 363-378.
[5] Edwards, S., Biscarri, J.G. and Gracia, F.P. 2003. Stock market cycles, financial liberalization
and volatility, Journal of International Money and Finance (22), 925-955
[6] Garcia-Ferrer, A. And Queralt, R.A. 1998. Using long, medium and short term trends to
forecast turning points in the business cycle: Some International Evidence. Studies in Nonlinear Dynamics and Econometrics 3(2), 79-105.
[7] Giampaoli, I., Ng, W.L. and Constantinou, N. 2009. Analysis of ultra high frequency financial
data using advanced fourier transforms. Finance Research Letters (6), 47-53.
[8] Giudici, E. And Simpson, M.W. 2009. An examination of stock market dynamics in the
frequency domain. FMA Annual Meeting, Reno Nevada
[9] Granger, C. W. J., Morgenstern, O. 1963. Spectral analysis of New York stock market prices.
Kyklos 16, 1-27.
[10] Granger, C. W. J., 1966. The typical spectral shape of an economic variable. Econometrica 34,
150-161.
[11] Harvey, A. C. 1993. Time Series Models, 2nd Edition. Cambridge: MIT Press.
[12] Hong, Y. 1999. Hypothesis testing in time series via the empirical characteristic function: A
generalized spectral density approach. Journal of the American Statistical Association. 94(448), 1201-1220.
[13] King , R.G. and Rebelo, S.T. 1993. Low frequency filtering and real business cycles. Journal of
Economic Dynamics and Control 17(1-2), 207-231.
[14] Korotoyev, A.V. and Tsirel,S.V. 2010. A spectral analysis of world GDP dynamics:
Kondratieff swings, Juglar and Kitchin cycles in global economic development and the 2008-2009 economic crisis. Structure and Dynamics 4(1).
[15] McCullough, B.D. 1995. A spectral analysis of transactions stock market data. The Financial
Review 30(4), 823-842.
[16] Murphy, A. J., 1987. The seasonality of risk and return on agricultural futures positions.
American Journal of Agricultural Economics 69, 639-646.
[17] Orlov, A. G., 2006. Capital controls and stock market volatility in frequency domain.
Economics Letters 91, 222-228.
[18] Praetz, P.D. 1979. Testing for a flat spectrum on efficient market price data. Journal of Finance
34, 645-658.
[19] Rausser, G. C., Cargill, T. F., 1970. The existence of broiler cycles: An application of spectral
analysis. American Journal of Agricultural Economics 52, 109-121.
[20] Sarantis, N. 2001. Nonlinearities, cyclical behaviour and predictability in stock markets:
International evidence. International Journal of Forecasting 17, 459-482
[21] Sato, A-H. 2008. Application of spectral methods for high frequency financial data to
quantifying states of market participants,.Physica A (387), 3960-3966.
[22] Sayan, G.T. and Sayan,S. 2002. Time frequency representations in the analysis of stock market
data. Kontoghiorghes, E., Rustem, B and Siokos,S.(Eds ) Computational methods in decision making, economics and finance. Kluwer Applied Optimization Series, 429-451
[23] Smith, K. L. 2001. Pre- and post-1987 crash frequency domain analysis among Pacific Rim
International Research Journal of Finance and Economics - Issue 67 (2011) 167
[24] Thoma, M.A 1994. “The effects of money growth on inflation and interest rates across spectral
frequency bands”, Journal of Money, Credit and Banking, 26(2). 218-231
[25] Uebele, M and Ritschl, A. 2009. Stock markets and business cycle comovement in Germany
before World War 1: Evidence from spectral analysis, Journal of Macroeconomics, 31, 35-57
[26] Wang, P., 2008. A spectral analysis of business cycle patterns in UK sectoral output. Working
Papers 2008-FIN-02, IESEG School of Management
[27] Wei, W.W.S 1993. Time series analysis univariate and multivariate methods. Addison-Wesley
Publishing Company.
[28] Wong, W-K. and McAleer, M. 2009. Mapping the presidental election cycle in US stock
markets. Mathematics and Computers in Simulation 79, 3267-3277.
[29] Yan,W. , Powell, G.J., Shi, J. and Xu, W. 2007. Chinese stock market cyclical regimes:
1991-2006. Economics Letters 97, 235-239.
View publication stats View publication stats