T.C.
ISTANBUL AYDIN UNIVERSITY INSTITUTE OF SOCIAL SCIENCES
A FRAMEWORK FOR ENHANCEMENT OF HUMAN RESOURCE PRODUCTIVITY BY USING BALANCED SCORECARDS
A DECISION BASED APPROACH
THESIS
Hamidreza MOHEBBI
Department of Business Business Management Program
Thesis Advisor: Assist. Prof. Dr. Nima Mirzaei
T.C.
N L AYDIN UNIVERSITY INSTITUTE OF SOCIAL SCIENCES
A FRAMEWORK FOR ENHANCEMENT OF HUMAN RESOURCE PRODUCTIVITY BY USING BALANCED SCORECARDS
A DECISION BASED APPROACH
M.Sc. THESIS Hamidreza MOHEBBI
(Y1512.130121)
Department of Business Business Management Program
Thesis Advisor: Assist. Prof. Dr. Nima Mirzaei
DECLARATION
I hereby declare that this master‟s thesis titled as “A Framework for Enhancement of Human Resource Productivity by Using Balanced Scorecards; A Decision Based Approach” has been written by me in accordance with the academic rules and ethical conduct. I also declare that all materials benefited in this thesis consist of the mentioned resources in the reference list. I verify all these with my honor.
FOREWORD
The most significant thing a research can offer is the result of it being publicized, when I started working on balanced scorecard, I thought of it as a human resource framework that utilized the resources the organization already has with the goal of the company. Although this is true, as I learned, business decision making and benchmarking techniques have multiple variables which resulted in a well-constructed study.
Different ideas were added to the initial framework, but the real challenge was the integration of management and decision-making methods. I expanded the project horizon with the help of my supervisor Dr. Nima Mirzaei, I am thankful for his recommendation and suggestions in every step of my project.
I am also grateful to the companies participating in the shaping of my thesis. Especially giving me feedbacks and their words of encouragement. The thesis completion would not have been possible without their help. I also want to give my special thanks to my family for their support and encouragement throughout the completion of my dissertation.
TABLE OF CONTENTS Page TABLE OF CONTENTS ... vi ABBREVIATIONS ... viii LIST OF TABLES ... ix LIST OF FIGURES ... x ABSTRACT ... xi ÖZE ... xii 1. INTRODUCTION ... 1 1.1 Problem Discussion ... 2 1.2 Research Questions ... 3 1.3 Research Assumptions ... 4 1.4 Research Limitations ... 4 1.5 Thesis Outline ... 5 2. LITERATURE REVIEW ... 6 2.1 Strategy Maps ... 10 2.2 Relational Effect... 12 2.3 A Managerial Dashboard ... 13
2.4 Decision Making Concept ... 14
2.5 Measuring Performance ... 15
2.6 Features of Performance Measurement Systems ... 16
2.7 Comparing Traditional Performance Measurement Approaches ... 16
3. RESEARCH METHODLOGY ... 21
3.1 Measuring Organizational Productivity ... 24
3.2 MCDM Method Overview ... 24
3.3 Enterprise Resource Planning Integration ... 25
4. DATA COLLECTION AND ANALYSIS ... 27
4.1 Consolidated Preferences of the Perspectives ... 36
4.2 BSC Benchmarking and Overall Weighting ... 41
4.3 Actionable Strategy Using PROMETHEE ... 50
5. CONCLUSION AND FURTHER DISCUSSION ... 56
5.1 Organizational Commitment ... 57
5.2 Organization‟s Cultural Impact ... 57
5.3 Strategy Formation ... 58
5.4 Conclusion and Future Study ... 58
5.5 Summary ... 59
REFERENCES ... 60
APPENDICES ... 64
Appendix A: Survey Approval Form ... 64
Appendix B: Pairwise Comparison for Customer Perspective ... 65
Appendix C: Pairwise Comparison for Financial Perspective ... 67
Appendix E: Pairwise Comparison for Training and Innovation Perspective ... 71 Appendix F: Pairwise Comparison for BSC Perspective ... 73 RESUME ... 75
ABBREVIATIONS
BSC : Balanced Scorecard
AHP : Analytical Hierarchical Process ROA : Return on Assets
ROI : Return on Investment
SBA : Small Business Administration CRM : Customer Relationship Management TQM : Total Quality Management
EPS : Earnings per Share
LGO : Local Government Organizations PMS : Performance Management System
OPM : Organizational Performance Measurement BPM : Business Performance Measurement KPI : Key Performance Indicators
PROMETHEE : Preference Raking Organization Method Enrichment Evaluation CPM : Contemporary Performance Measurement
ERP : Enterprise Resource Planning MCDM : Multi-Criteria Decision-Making HR : Human Resources
LIST OF TABLES
Page
Table 2.1 : Combination of MCDM and BSC ... 10
Table 2.2 : Corporate Strategy Map ... 11
Table 2.3 : A Distinction Between BSC and Managerial Dashboards ... 14
Table 4.1 : Preference Scale (Taylor, Bernard 2013) ... 30
Table 4.2 : Random Index (Taylor, Bernard 2013) ... 31
Table 4.3 : Aggregated Comparison of BSC ... 32
Table 4.4 : Aggregated Comparison of Financial Perspective ... 33
Table 4.5 : Aggregated Comparison of Customer Perspective ... 34
Table 4.6 : Aggregated Comparison of Internal Process ... 35
Table 4.7 : Aggregated Comparison of Training and Innovation Process ... 36
Table 4.8 : Consolidated Eigenvector of BSC... 37
Table 4.9 : Consolidated Eigenvector of Financial Perspective ... 37
Table 4.10: Consolidated Eigenvector of Customer Perspective ... 38
Table 4.11: Consolidated Eigenvector of Internal Processes ... 39
Table 4.12: Consolidated Eigenvector of Innovation and Training Perspective ... 39
Table 4.13: BSC Preference Dashboard ... 42
Table 4.14: Financial Perspective Standardization ... 44
Table 4.15: Customer‟s Perspective Standardization ... 45
Table 4.16: Internal Process Perspective Standardization ... 46
Table 4.17: Training and Innovation Perspective Standardization ... 47
Table 4.18: BSC‟s Perspective Standardization ... 48
Table 4.19: PROMETHEE Evaluation Table ... 54
LIST OF FIGURES
Page
Figure 1.1 : Objectivized Business Strategy ... 2
Figure 2.1 : The Balanced Scorecard ... 9
Figure 2.2 : Causal Relationship ... 13
Figure 2.3 : Performance Measurement Matrix ... 17
Figure 2.4 : Pyramid System ... 18
Figure 2.5 : The Integrated Measurement System ... 19
Figure 2.6 : The Purposes of Performance Measures (Bititci 1997) ... 19
Figure 2.7 : The Performance Prism ... 20
Figure 3.1 : Ideal Utility ... 21
Figure 3.2 : Conceptual Framework of Performance Enhancement ... 23
Figure 4.1 : Two Company‟s Comparison of Financial Indicators of BSC ... 28
Figure 4.2 : Most Productive Performance Strategy ... 29
Figure 4.3 : OECD Countries Investment on R&D ... 41
Figure 4.4 : Financial Indicator‟s Comparison ... 45
Figure 4.5 : Customer Indicator‟s Comparison ... 46
Figure 4.6 : Internal Process Indicator‟s Comparison ... 47
Figure 4.7 : Training and Innovation Indicator‟s Comparison... 48
Figure 4.8 : BSC‟s Indicator‟s Comparison ... 49
Figure 4.9 : Regular Linear Function ... 52
Figure 4.10: Staircase Linear Function ... 53
A FRAMEWORK FOR ENHANCEMENT OF HUMAN RESOURCE PRODUCTIVITY BY USING BALANCED SCORECARDS; A DECISION
BASED APPROACH ABSTRACT
“A chain is only strong as its weakest link”; this is an incredible example of a business unit which is left behind, a production line of which one workstation lags behind, and a service line faces delay. This dissertation presents a conceptual framework that adequately evaluates and controls the productivity process. The research utilizes the Balanced Scorecard (BSC) which is an organizational management tool, and Analytical Hierarchy Process (AHP) to evaluate three company‟s performance cycle. The research BSC model contains four perspectives that are Financial, Customer, Internal business processes and Training and innovation. These measures are explicitly defined and categorized using key performance indicators (KPI) for the decision-making purposes. The AHP method is adopted for weighting the BSC criteria and the PROMETHEE method is used to select the best strategy to be implemented in the organization. The conceptual framework of the research integrates the theories of strategic evaluation and management science and divides the model into measurable business objectives to enhance and improve productivity.
Keywords: Performance measurement, Performance Dashboard, PROMETHEE, Human Resource Productivity, Balanced Scorecard, Analytical hierarchy process
DENGE EMLER N K LL N R K N N K YN ĞI
VER ML L Ğ N N GEL Ş R LME Ç N R ÇERÇEVE; R K R R D Y LI Y KL ŞIM.
ÖZET
“Bir zincir sadece en zay f halkas kadar g l d r” Bu geride kalan bir i biriminin harika bir rne idir bir geride kald i istasyonununla retim hatt ve gecikmeli bir servis hatt . Bu fikir retkenlik s recini de erlendiren ve kontrol eden kavramsal bir er eve sunar. ra t rma irketin performans d ng s n de erlendirmek i in bir organizasyonel y netim arac olan “Balanced Scorecard BSC ” ve “ nalytical Hierarchy Process HP ” kullanmaktad r. ra t rma BSC modeli Finansal M teri i s re leri ve E itim ve yenilik olan d rt perspektif i erir. Bu nlemler karar verme amac yla "key performance indicators KPI " kullan larak a k a tan mlanm ve kategorize edilmi tir. BSC kriterlerinin a rl kland r lmas i in HP y ntemi benimsenmi tir. P OMETHEE y ntemi organizasyonda uygulanacak en iyi stratejiyi se mek i in kullan l r. ra t rman n kavramsal er evesi stratejik de erlendirme ve y netim bilimi teorilerini birle tirir ve verimlili i artt rmak ve geli tirmek i in modeli l lebilir i hedeflerine ay r r.
Anahtar Kelimeler: Performans ölçümü, Performans Gösterge Tablosu, PROMETHEE, İnsan Kaynakları Verimliliği, Balanced Scorecard, Analitik Hiyerarşi Süreci
1. INTRODUCTION
Organizations are striving to meet the challenges of the rapidly growing competitive market; many factors significantly impact the organizations; these factors can be fluctuation in the prices, lack of competitive advantage and instability which all reduces the companies' edge in generating value and increasing potential risk as a result. The strategic direction of the business is crucial to stockholders as it creates an organizational structure around the industry. Therefore, the future stability of the company rests upon the senior manager who measures and manage the business progress. An implication of a deliberately well-formulated strategy is an organized system which creates a growth mechanism. Therefore, a definition of strategy is critical and understanding the logical explanation indicates clarity in the professional environment.
A comprehensive definition of business strategy is “organization‟s direction which has a long-term progress”; the governing strategy ensures the sustainability of the system; although other strategy thinkers such as Peter Drucker and Henry Mintzberg have a different approach. Peter Drucker who is the originator of modern management defines strategy as a theory that helps businesses to gain a competitive edge; moreover, Henry Mintzberg defines strategy as a chain of decision patterns which has a more factual approach (Henry Mintzberg, 2007). Creation of a vision for the organization is an enthusiastic commitment to strategy since no strategy can be curated without purpose procurement. Nevertheless, these objectives should have measurable, attainable, purposeful characteristics, capable of delivering an extensive range of possibilities. Balanced Scorecard (BSC) as a management tool for performance evaluation categorizes these objectives known as key performance indicators (KPI) and assists the organization in implementing the business strategy; this concept is explicitly manifested in Figure 1.1.
Figure 1.1: Objectivized Business Strategy
Every strategical decision has a responsive driver, an initiator of change who helps progressive movement, triggering actions and managing change, these incremental adjustments in the long-term radically revolutionize the company. While these principles are sufficient, there is also the factor of speed which initiates accuracy in the processes.
If chosen correctly, KPIs significantly contribute to performance measurement process by focusing on outputs of past activities as well as future performance indicators (Niven, 2014).
This thesis employs quantitative data surveyed and ranked using a fully anchored rating scale from a group of companies in Iran. The survey in the study was adopted from Analytical hierarchy process (AHP) and the weights collected from respondents were analyzed and evaluated. The study is divided into four sections which are perspectives of BSC; these are financial, customer, internal business processes and the learning and innovation perspective; these aspects are the most common measurable attributes that are part of any company ecosystem.
1.1 Problem Discussion
The study is mostly concentrated on performance evaluation and enhancement, the methods that were utilized are Balanced Scorecard (BSC) performance measurement tool and multi-criteria decision-making methods (MCDM).
Senior managers utilize many organizational techniques for managing and accomplishing tasks; these tasks are organized, operated and controlled by performance tools which track activities and highlight mismanagements in the
system. For this reason, performance is a critical tool for any company which if used correctly can be used to avoid obstacles; these obstacles can be due to everlasting constraints in resources or financial issues. Because BSC considers all of the organizational aspects, it has an astounding popularity amongst industrial and business industries. Kádárová Durkáčová & Kalafusová 2014 .
The KPIs are set of metrics that is chosen by the company executive board or brainstormed amongst appropriate members of the company. Although these indicators are of great significance, they should not be used as the primary source of decision-making by the senior managers. It is important that they only begin a discussion that otherwise didn‟t exist (Manyika, Woetzel, Dobbs, Remes, & Labaye, 2015).
1.2 Research Questions
The study focuses business performance incorporating both management science and organizational performance tools and considers the below research questions,
How can Balanced Scorecard (BSC) performance tool be utilized and measured?
What are the differences between BSC and other organizational performance tools?
Can the Balanced Scorecard (BSC) be incorporated with Multi-criteria decision-making (MCDM) to enhance productivity systematically?
How do culture and commitment change the overall strategy?
BSC has integrated both financial and non-financial into one overall strategy. Bain & Company report for top 25 management tools & trends shows that BSC is in the 6th place outranking outsourcing and supply chain management (Rigby & Bilodeau, 2015). The objective of this study is to review BSC as a performance measurement tool and benchmarking techniques to prioritize its indicators and developing a model that measures productivity efficiently. Merging both Analytical Hierarchical Process (AHP) and BSC‟s four perspectives and benchmarking techniques will help to enhance company‟s strategical Perspectives. This method ensures a weight is given to each aspect and in the future real data at hand facilitates the decision-making
process. The underlying thinking of this research lays upon the assumption that BSC with MCDM integration leads to improved and enhanced performance.
1.3 Research Assumptions
Customer satisfaction is considered to be related to organizational performance.
Gaining new customers is assumed to be related to organizational performance.
Effectiveness and efficiency of internal processes are being thought to be related to organizational performance.
Competence development through training is being assumed to be related to organizational performance.
Decreasing unnecessary costs is believed to be related to improving performance.
BSC and MCDM integration is expected to enhance performance.
1.4 Research Limitations
A group of companies was surveyed, and the data was used accordingly for the research which is enhancing productivity. Limitations of the study are as follows;
Lack of inside company‟s data managerial data mostly due to confidentiality of financial data which is vital in this research.
Statistically, in order to have a representation of the entire population, we need a larger sample.
Not able to find optimal measures suitable for all business cases.
Time constraint, being unable to exceed the number of companies for the study.
1.5 Thesis Outline
The thesis incorporates five chapters; each contributing to the strategic formation of the study. An initial definition is presented in the first chapter explaining strategy and the idea behind the thesis. Moreover, problem discussion and research limitations will elaborate on the thesis restrictions and purposeful outcomes. In the second chapter, balanced scorecard (BSC) and strategy maps are explained. Which are managerial tools for enhancing decision making. Furthermore, different performance measurement tools are mentioned in order to have a historical overview. Additionally, the data analyzing results are presented in chapter four of the study along with actionable strategy which will consequently make the organization more productive in achieving their goals. The chapter integrates all the values of the study and performs a market research analysis and elaborates on the research hypothesizes model and presents a model for consumers‟ purchase intention. Lastly, chapter five will encourage further analysis on the study and gives implications for the results of consumers‟ purchase intention.
2. LITERATURE REVIEW
With the emergence of modern organizations, strategic management and performance measurement gained popularity. Even today, businesses all around the globe have an insatiable need to link these measuring models to their everyday processes Couto Vendrametto Neto Morais & Brejão 2016 . To automate their operations and connect activities to other business sectors within their ecosystem. Being solely dependent on financial performance may jeopardize the quality of the business program, measuring only profit and loss. Kaplan and Norton, “the balanced scorecard” publication in 1992, helped companies implement the framework in their workflow (Kaplan & Norton, 2008). Although this method was first highlighted by Art Schneiderman (Arthur M, 2006 Kaplan and Norton‟s article made BSC popular, following the release of their book which made the framework accessible. In his article named “When is a balanced scorecard a balanced scorecard?”, Soderberg examines the different characteristics of a BSC, and Non-BSC implemented organizations and finds that one category necessary for the functioning of the system in the BSC environment would be senior management involvement in the advancement of the goals (Soderberg, Kalagnanam, Sheehan, & Vaidyanathan, 2011). In this regard, other studies also examined the change principles applied and necessity of management authority overseeing the change (Agostino, 2011).
Within the strategic management ecosystem, a strategy map is an essential tool in BSC (Kaplan & Norton, 2000). The diagram gathers all the information necessary for creating an action plan which breaks down the objectives into manageable and actionable daily tasks (Kim and Mauborgne 2005), Overwhelming the objectives with lots of metrics can be an agonizing experience, slowing down productivity and making processes harder in respect (Wadugodapitiya & Sandanayake, 2010).
With its applied productive nature of considering each departmental section, BSC has the ability to restructure organizational goals and integrate into other tools, one of the tools is Total Quality Management (TQM), an older method that was
introduced thirty years before Balanced Scorecard. In contrast with BSC, TQM focuses more on system level and employee involvement and internal structure rather than focusing on the whole organization (Salem, Hasnan, & Osman, 2012).
Although there are many business performance tools out there, the Balanced Scorecard shows a better picture of corporate strategies based on BSC perspectives. In a study, Huang and Hao-Chen proposed a strategical knowledge-based web-based system of the framework that uses BSC to facilitate decision-making and implement a more intelligent approach to finding better solutions to any difficulty in the implementation of this method (Huang 2009). There are so many processes involved in a business setting that help in managing the organization, but without a growth plan and regular monitoring the productivity there‟s no way of measuring success for the enterprise.
Every measuring tool has to be tested before it gains practicality in the corporate setting. These measuring tools have to be precise and globally articulated to generate as much impact as possible. These measuring tools should avoid being a one-sided phenomenon that only considers financial aspects (Taylor & Baines, 2012), although the current measurement methods are more integrated containing lag and lead indicators for long-term strategy, focusing on financial and non-financial metrics. A report on BSC effectiveness consolidates it with many applied studies, from aircraft design to manufacturing that links them to enterprise resource planning (Chand et al. 2005), and to other areas of operations such as logistics and supply chain management (Karpagam 2013).
BSC is not limited in private sector; its applications can be implemented in public sector, although in any implementation there are barriers to consider, which are as follows (Northcott & Ma'amora Taulapapa, 2012).
Usage of other performance measurement system as an alternative solution to their short-term and long-term goals.
Size and scalability of the system where these measurements are considered unnecessary in small settings.
Lack of support from the system which the performance tool was implemented in.
Lastly, support from the board of management is especially crucial to the smooth transition of the company.
In a study by McKinsey group about productivity, they explained that productivity is not always achieved at the expense of employment (Manyika et al., 2015). There are many factors such as reduction of waste, investments in R&D, that will raise outputs in ways we couldn‟t imagine before. Productivity is the one accurate measure of efficiency. Whether we are dealing with learning organizations or SB ‟s or corporate organizations, it is necessary to have a base or benchmark that we can compare ourselves, to not only have a sustainable space but to differentiate ourselves from the competitors.
In all modern societies, one indicator that differentiates enterprises from others is productivity, even as technology advanced, this indicator also adapts itself and gives feedback accordingly. (Jagoda, Lonseth, & Lonseth, 2013)
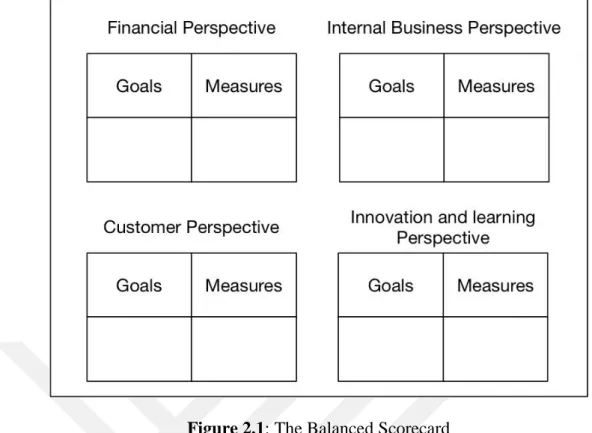
The perspectives of BSC that are used in this research are: (Gary Dessler, 2016)
Financial Perspective looks at top level financial objectives and measures to answer the question; “How do we look to our shareholders?” considering the following factors.
Customer Perspective which focuses on customer satisfaction answering the question “How do our customers see us?” Considering the following factors.
Internal Processes Perspective is concerned with assessing the processes quality and processes cycle time to identify “How well the business is running?” Considering the following factors
Innovation and learning perspective determines the necessary skills and training modules required for the successful implementation of company processes.
Figure 2.1 table below shows an overview of the method which will be elaborated throughout the research.
Figure 2.1: The Balanced Scorecard
Without a doubt, BSC is one of the most well defined and comprehensive tools in performance measurement toolbox (Rigby & Bilodeau, 2015). Despite the popularity not much was known about BSC‟s practicality and usefulness Intrafocus 2015). While the BSC method focuses on outcomes, namely lag measures such as revenues and employee satisfaction, it also emphasizes on long-term strategy and leading performance measures such as time spent with customers which leads to their satisfaction. These two dimensions should be aligned with a defined set of key performance indicators (Taylor & Baines, 2012).
Organizational performance measurement (OPM) is not a new topic; many research has been done on this issue merging the Multi-criteria decision making (MCDM) techniques with business performance measurement (BPM) tools which some of the studies in this topic are mentioned in table 2.1. This research adds to that knowledge with using the performance benchmarking concepts. Moreover, the studies on these topics all have their limitations, an example of this is that senior management who are crucial to the success of the implementation. Concentrating more on the financial aspects of the process and as a result not focusing on employees and stakeholders contribution in the implementation process (Yaghoobi & Haddadi, 2016).
Constructing this framework with MCDM helps in better distinguishing the perspectives by allocating relative weights to the selected measures (Wadugodapitiya & Sandanayake, 2010). Although every organization has its specific indicators for the four aspects, mainly dealing with finance sector, customer section, internal processes held by the company and Learning and innovation which are concerned with employees satisfaction (Agostino & Arnaboldi, 2011). Especially growing their knowledge that they later can better perform and increase the firms‟ performance that was not possible with their current resources available.
This concept can systematically be applied to an organizational group, but it is necessary that the team employs the accurate Key performance indicators KPI‟s (Maharma, 2014). BPM‟s ability to monitor and analyze different measures with accuracy is the key to improved insight and as a result better and faster decisions. Table 2.1: Combination of MCDM and BSC
Author Years Research topics
Tahere Yaghoobi and Firoozeh Haddadi
2016 Organizational performance measurement by a framework integrating BSC and AHP
Alexandre Veronese Bentes, Jorge Carneiro
2012 Multidimensional assessment of organizational performance: Integrating BSC and AHP
Ali Erbasi and Raif Parlakkaya 2012 The use of analytic hierarchy process in the balanced scorecard: an approach in a hotel firm
Ahmad Hasan Maharma and Dr. Yahya Saleh
2014 Developing a business performance management
model for PATEL group (using AHP method)
V.N. Sundharam and Vinay Sharma
2014 An integration of BSC and AHP for sustainable growth of manufacturing industries
ntônio ndré Cunha Callado 2014 Balanced scorecard metrics and specific supply chain roles
The dynamic visualized tool is practiced as a complement to the BSC method, and it helps in highlighting the power of measurements as a monitoring tool to better manage and control the systematic processes. With the help of their teams, they brainstorm and verbalize a set of objectives that they think contributes to their success. These goals then are presented in a graphical strategy map that assists them in better executing their strategy. These strategies will translate into actions that the company should communicate them to the team members for them to know what must be done in order to succeed. These actions consist of specific measures in each perspective. A strategic initiative should be defined in the process that aims at purposefully executing the objectives.
Every organization needs to define its vision appropriately, clearly stating its mission or purpose. Performing and creating strategy maps helps us identify and find the company‟s actionable goals and try to answer the question of “what makes the company different from the competitions?”. In another word “what is their competitive advantage?”. Defining a vision will ensure long-term results with an organized framework with specified objectives. Objectives are measurable outcomes in the form of a statement that are simple enough for execution. The whole chain makes sure that value is created and offered to the customer.
Mauboussin from Columbia Business School also suggests starting with these questions. First, we should ask “what objectives you are seeking?” In this case, we want sales expansion and growth, the second question to ask is “what factors should you use for achieving those objectives?”. The factors in this study are the balanced scorecard metrics which are selected throughout the process (Michael J. Mauboussin 2012).
Some factors that affect organizational performance include Investment of capital per worker, Research and development, Government regulation (for example setting of minimum wages and social securities or job securities), Energy costs, Employees stability and Environmental influences (N.s. Narahari, k.n. Subramanya, 2015). Table 2.2 shows the objectives that can be linked to the strategy map which leads to the growth of the shareholders‟ value as illustrated every part of the scorecard translates the strategies into objectives.
Perspectives Objectives
Financial Revenue growth, cost reduction, asset gaining improvement
Customer Offering high-value solution, creating loyalty programs Internal process New products creation, monitoring and evaluating Training and innovation Ensuring healthy work environment, talent retention
2.2 Relational Effect
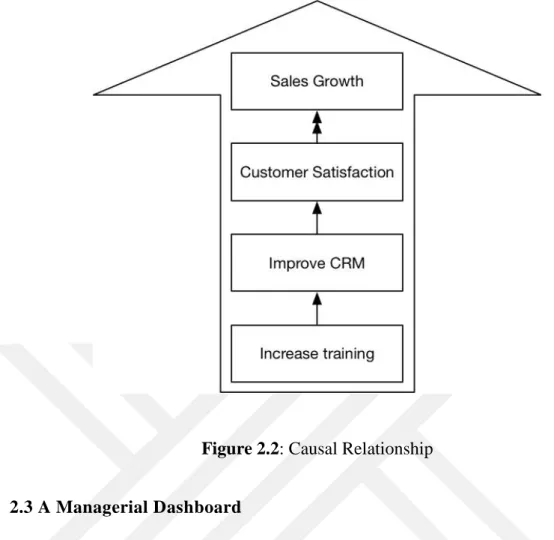
The measure and objectives have a causal relational impact; in the BSC case, this means that each criterion affects another essential criterion which leads to a logical mapping of the organization. This cause and effect bond will help to get to the desired outcome with high probability (Salem et al., 2012)
The selected factors in this study also follow these causal relationships which are shown in Figure 2.2. For growing the organization, we must have a growth strategy, in the financial perspective of BSC we consider sales as a strategic objective, we might hypothesize that more customer satisfaction in the customer perspective leads to more sales. In this case, when shifting towards internal processes, we might think of better customer service as a measure of processes or improving customer relationship management (CRM) as an alternative to that. Each of these relational factors leads to other measures that we would not consider if there‟s lack of perspective on it.
In 1989 through local governmental (LGOs) reforms, Performance management such as BSC was useful for the purpose. But because there were many outcomes, these casual relationships was just a guess. (Northcott & Ma'amora Taulapapa, 2012). This study suggests capturing measures that can be translated to qualitative outcomes. Being unable to build a cause and effect relationships narrows the ability of the selected apparatus and leads to failure of the system.
Figure 2.2: Causal Relationship
2.3 A Managerial Dashboard
As dashboards control the efficiency of the operations, BSC focuses on achieving longer period perspectives by mapping strategically and ability to interpret data for better insights and execution in monthly basis. This performance management system is also referred to as PMS that helps management to take better decisions in dealing with everyday problems due to information crises or interpretation of data (Neely et al. 2005) this is the result of accurately selecting the indicators and this is the strategic part of the BSC model.
If we want to increase productivity in today‟s competitive world, we should use the resources efficiently, use fewer workforce, reduce wastes, decrease product cost, improve quality, increase customer satisfaction, increase motivation and finally increase employees interest in the work they do, which all of these eventually leads to organization expansion.
Organizations with these characteristics or qualities are called learning organizations, in these organizations, the workforce thinks intelligently, work with more creativity and adopt a more systematic attitude. In many organizations, managers are engaged more in routine work whereas they should put more time into planning, directing and
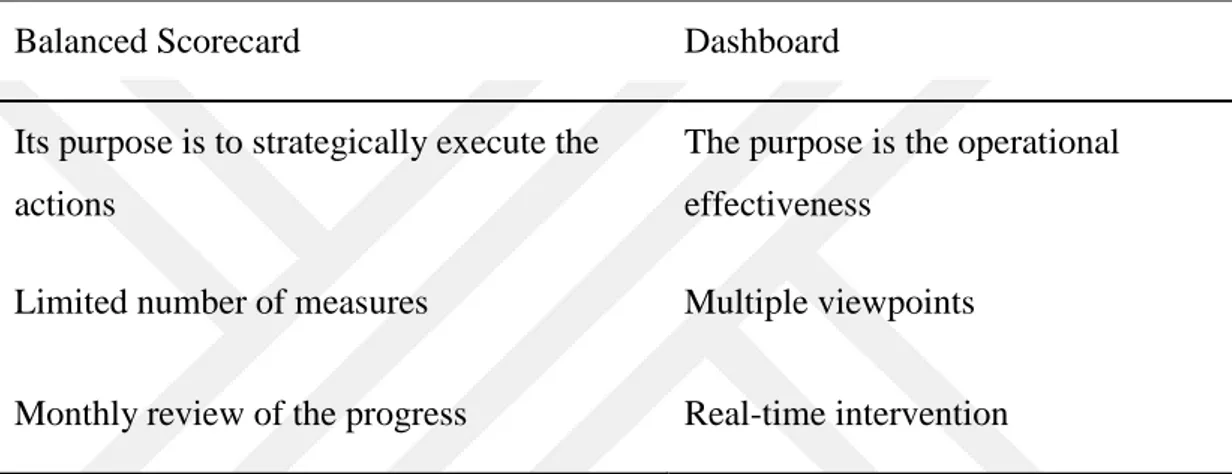
controlling the activities to achieve a more efficient productivity. Most prestigious organizations pay enormous attention to the productivity of human resources, and in return, the workforce plays a prominent role in the improvement of productivity. In the Journey to improve human resource productivity, researchers believe one cannot provide only one factor. Instead, we should use a combination of causes and then by ranking the identified factors, management can give administrative guidelines for improvement of productivity. To summarize the difference between dashboard and BSC we use the following table 2.3;
Table 2.3: A Distinction Between BSC and Managerial Dashboards
2.4 Decision Making Concept
Advancement of organizations and adaptation of managerial practices in the corporate sector created a new field of management science which was used to ease the business problems. Linear programming models were helpful in determining a single objective being maximized or minimized, though companies have more than one objective.
We have an astonishing proximity to the cycle of making decisions, and most alarming characteristics of this process are the cognitive biases that surround it. These biases are the reason why we prefer to join and participate different groups (Kahneman, 2011) if confronted by a win-lose situation, we prefer the solution with lower rates of biases.
Balanced Scorecard Dashboard
Its purpose is to strategically execute the actions
The purpose is the operational effectiveness
Limited number of measures Multiple viewpoints Monthly review of the progress Real-time intervention
There are many techniques of multi-criteria decision techniques to consider, each having their advantages and limitations (shiwoei, 2013), this research focuses on performance benchmarking integrated with Analytical Hierarchical Process (AHP) for Balanced Scorecard (BSC) with the aim of minimizing the costs and increasing the performance.
2.5 Measuring Performance
To make a logical decision, managers use various tools that boost speed and accuracy. Performance measurement needs a progressive system of metrics; that is a group of parameters each measuring one critical feature of our performance tool. Each company has its own creative way of defining the metrics; But it is essential to choose SMART performance objectives, these goals should be selected at the start of rating process Pulakos & O‟leary 2011
The performance measures should be specific, and they should be synced with expectations.
The performance metrics should be measurable, driving the employees to better results and toward better objectivity for the organization.
The organization has to communicate attainable expectation to the employees to remove unfair subjectivity from the equation.
The process in which we accomplish our goals should be itself result-oriented.
Ensuring support for the system: objectives should be measured in deadlines or due dates (time-sensitive)
The SMART objectives ensure that the whole system should facilitate the organizational performance. The organization passionately adopts the practice of performance measurement, but this is not enough, the new management system should be implemented correctly, and it should integrate into the organization‟s culture.
The performance management systems that failed to establish a successful strategical process were either due to not having useful feedback or because of lack of devotion of attention from the managerial role to employees. These failures will result in an unsuccessful implementation of the system (Pulakos & O‟leary 2011 . Other
obstacles also can be mentioned such as shortage of capital resources; this means if the system expects an implementation of a software platform concentrating on the system‟s needs it should be also affordable for the SB ‟s. One more barrier is the misconception about the PMS that makes the advantages and flexibility become forsaken by the organization in favor of bureaucratization (Hvolby H-H, Thorstenson A 2000)
2.6 Features of Performance Measurement Systems
It is the links between decision making and planning that result in action and leads to significant attentiveness to the organizational measurement (Pietro Micheli & Mari, 2014). Pietro suggests that PM does not follow a theoretical base that the measurement should be proportionate and has to contain a specified number of indicators. The system should have the following features (Stefano Biazzo & Patrizia Garengo, 2012);
Aligned with the strategies, this ensures consistency of the organizational model with the performance measurement tool (Najam-ul-Arifeen, Kazmi, Mubin, & Latif, n.d.). This assures that the actions and strategies are not implemented in the opposite directions (Bourne M, 2001).
Conceptual balance, this also was emphasized in earlier sections of the study, as a decision-making tool, the performance measurement tool has to incorporate both financial and non-financial perspectives.
Putting stakeholders at the core, this means that focusing on organizations supporting and directly influencing the business. The companies taking part can outline the importance of sustainable ecosystem which aims at the satisfaction of the influencers (Funk K, 2003).
The measures should be clear and approachable, with the advent of new organizational solutions, there is a significant amount of data being gathered, many of which are not useful and even unnecessary (Neely A, 1998). The data has to be also clearly defined from the empirical organizational activities that the team has accumulated throughout the everyday processes to gathering procedure that should be elaborated with care (Globerson S, 1985).
The most critical procedure in the business life-cycle in any organization is the scaling of the business, and if not handled systematically, this growth could kill the business. Performance systems are designed to facilitate the business processes and make them more responsive.
One of the oldest models used in corporate settings is performance measurement Matrix proposed by Keegan, which is a balanced model known for simplicity (Keegan et al. 1989); although it lacks the casual relationship offered by newer performance measurement tools (e.g., Balanced Scorecard). This model is visualized in Figure 2.3 with some of our parameters embedded in its dimensions; it measures the multi-dimensional financial and non-financial aspects with the internal processes (e.g., design costs) and external processes (e.g., customer complaints).
Figure 2.3: Performance Measurement Matrix
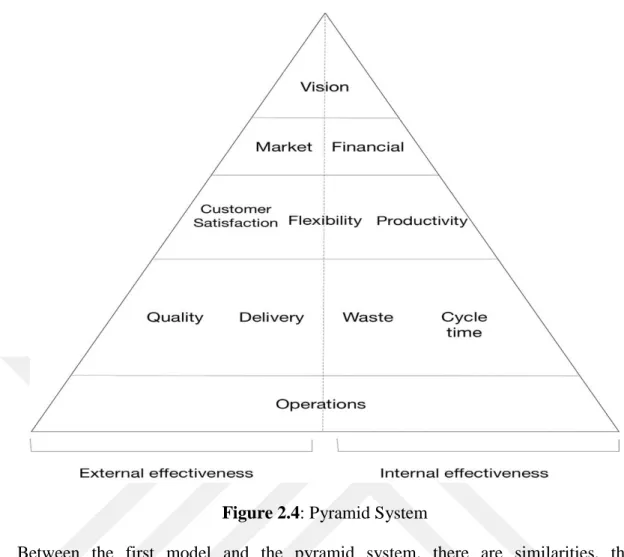
Systems all use some hierarchies within them that systematically guides the operations towards the strategic goals, the pyramid system designed in 1991 by Lynch & Cross is a representation of the organization‟s operations that indicates the objectives at each row of the pyramid. As with the performance measurement matrix, this model also discriminates between external and internal aspects concerning the stakeholders (Lynch R, Cross K, 1991).
Figure 2.4: Pyramid System
Between the first model and the pyramid system, there are similarities, the framework of a performance system ultimately links to the corporate strategy, in both models internal and external distinctions are considered, and the trade-offs between dimensions are explicitly defined (Chenget al. 2007). Most academicians categorize these systems as Contemporary Performance Measurement (CPM) systems which is a presentation of a system in which business strategies are translated into results that can be delivered instantaneously combining the operating business measures which get the organization closer to its specified goals (Hall, 2008)
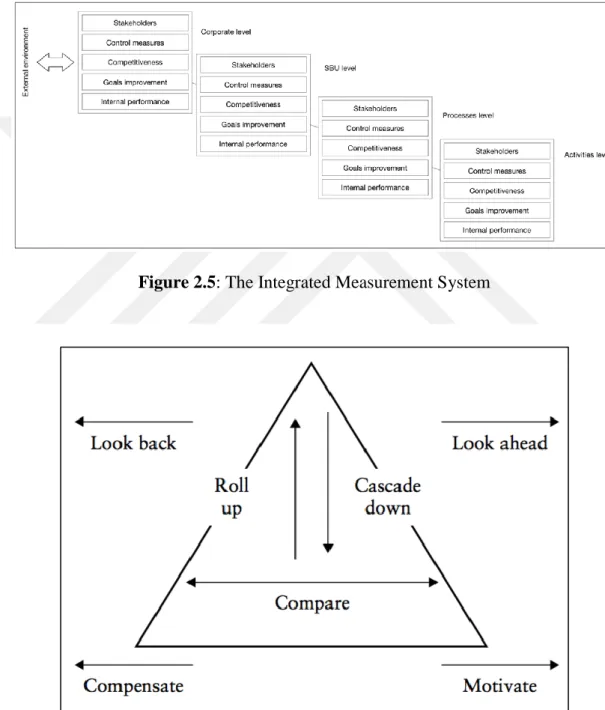
Other models also exist such as Integrated Performance Measurement System shown in Figure 2.5 focus on making sure the performance management system functions. Accordingly, each level contains five factors for considering throughout the performance measurement process (Bititci, Carrie, & McDevitt, 1997). There is a tension between different performance view, performance, the act of performing and execution and accomplishment is different from the economic definition which focuses on future benefits resulting from the achievements. Performance measurement is a concept bridged between these two definitions. The measures
defined in the CPM‟s need to motivate compensate they should be able to forecast (envision) and also continuously look back for feedbacks of any gaps in the system (Meyer, 2003). In Figure 2.6 the envisioning and “looking back” steps are placed at the tip of the pyramid, this is because they apply to the entire organization and the compensation and motivation are placed in the lower part of the pyramid, this is because they define individual drives in the organization.
Figure 2.5: The Integrated Measurement System
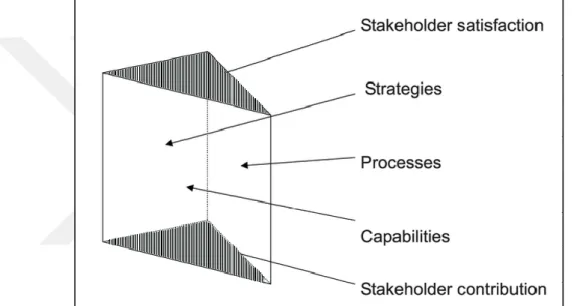
Another model worth mentioning is the performance prism displayed in Figure 2.7 (Kurien & Qureshi, 2011; Tangen, 2004). This model is categorized by;
Satisfying the stakeholder (employees, business environment)
Strategies utilized to fulfill organizational needs (brand, product, service)
Defining the processes within our strategies (generating demand, developing products)
Required capabilities to operate the processes (technology, people, practices)
Maintaining our capabilities through stakeholders‟ contribution.
Figure 2.7: The Performance Prism
The concept of balanced scorecard as we see is relatively straightforward, but the execution of tasks that balance financial and non-financial objectives vary to a large extent. Although the application is inevitable in organizations productiveness, Callado argues that it is difficult to find commonality within the framework among different groups of competitors and only satisfying the customer has been considered a universal metric common between the distributors. (Cunha Callado & Jack, 2015)
3. RESEARCH METHODLOGY
Between different tools that executives use for everyday decision making, benchmarking is among the top, alongside strategic planning and mission and vision statement (Rigby & Bilodeau, 2015). Conventional benchmarking uses key performance indicators (KPI) that show the prospects of success for the firm. Scorecards use it all the time for different perspectives but it was well-known purely for financial accounts (Taylor & Baines, 2012). The KPIs we used for financial analysis include Debt Ratio, Return on Assets (ROA), Return on Investment (ROI) and Earnings per Share (EPS). There is an implicit assumption that the differences in output between SBAs and large corporations legitimately have proportional inputs and outputs (Karpagam, 2013). In our research, we used survey data in a group of companies in Iran, and for that, we consider constant return to scale, this means, we assume income per asset does not necessarily depend on the firm‟s size. The purpose is to benchmark different indicators so that with real-time data generated by the business, we get to best ideal preferential utility; this concept is further shown in Figure 3.1 below;
The ideal preference is the equal tradeoff between the two outputs, and the high utility is the tradeoff of one output exceeding the other. This shows that with high performance also we need tradeoffs that either is equally distributed or it is the case of one indicator having more utility than the other and as a result having more weight attached to it. As we see in Figure 3.1, all alternatives below our ideal curve are feasible.
Benchmarking as a concept of rank ordering is the comparison of two or more productive units. Organizations that have a stable benchmarking structure at place whether for the financial success or internal success, should not emphasize on monopolizing the firm nor they should cherish inefficiency in the system, and a stable ranking that benefits employees, as well as stakeholders, should be implemented.
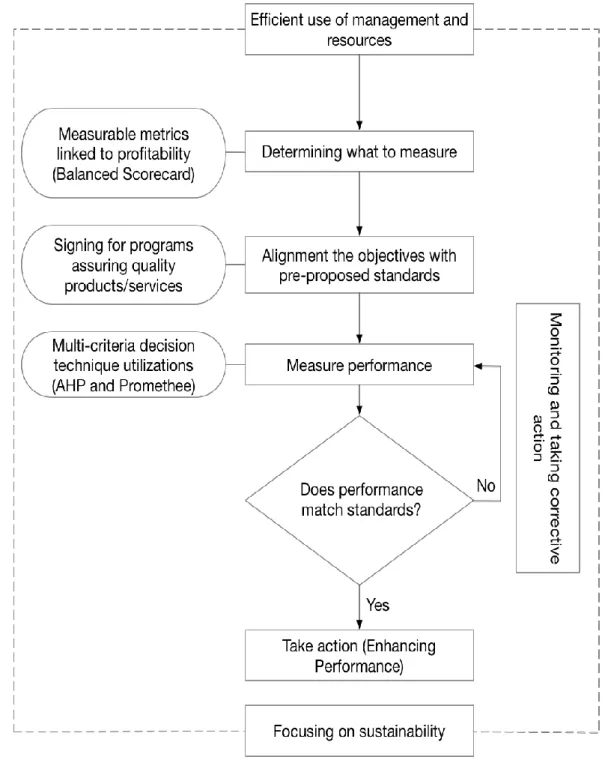
Designing and implementing a strategy has been the fundamental managerial responsibility, the strategic plans need integration and commitment, this phase is critical because it ensures a sustainable procedure. After this the organization can focus on competitive advantage, this requires clean implementation and control which linked with benchmarking decision techniques and scorecards, it can be strengthened and correctly applied such that each business unit is aware of its drawbacks. The performance enhancement process of the research is elaborately illustrated in Figure 3.2. The process starts with brainstorming and exploiting measurement attributes, and then aligning them with control standards pre-proposed in the organization, creating a structure. The measuring attributes are afterward divided between the four perspectives of BSC for benchmarking using Multi-criteria decision-making techniques. The evaluation procedure will result in a collaboration of the benchmarked measures corresponding with the pre-determined standards. Benchmarking allows organizations to know their weaknesses and to recognize their robust qualities, not only it explains their position and objective but it also shows that to what extent their KPI‟s differ from each other. Market share was one of the KPI‟s used in the research which is the ratio of the firm‟s share in the market for specific accounting values. These measures evaluate the state of the organization which can be a crucial indicator to reference.
The below model helps to transform strategic planning into actionable steps and also monitor business performance, decreasing the errors within its processes. Ideally, a
firm‟s strength in the competition depends on its ability to use the resources effectivity to pursue its goals and preferences.
3.1 Measuring Organizational Productivity
The whole model in Figure 3.2 emphasis on sustainability, stability and efficient use of resources which ultimately results in enhanced performance. Within the model, it‟s essential to determine the measurement criteria via team members insight or expert‟s opinions in the companies which were surveyed. Our chosen controls and measures following the BSC framework include sales, financial debt ratio, ROI, EPS, ROA for financial perspective.
In customer perspective, there is a particular indicator of customer satisfaction which itself lead to higher stock returns, profits per customer which is an essential factor in determining market share rate, customer retention rate which helps grow loyal customers and lastly customer acquisition rate.
Internal processes tend to have a systematic view of the firm in such a way that without an organized system, the objectives lose their guiding attribute. Furthermore, there should be monitoring measure for sales along internal processes ensuring better customer complaint procedure and other service-oriented ratios. Lastly, a sustainable organization guaranteeing efficiency throughout the chain needs well-trained employees with an organizational culture that encourages innovation. After determining the measures, the process will focus on making the outcomes purposeful and aligning them with organization‟s standards whether it is health standard or system-oriented standard. The research‟s theoretical framework consists of finding measures, aligning them with the specified standards for ensuring quality, and the third stage is measuring the actual performance which displays the research usage of two Multi-criteria decision tools, each having a different purpose in developing a coherent framework. Many Multi-criteria decision-making tools exist each having unique characteristics and distinct goals in the realm of decision making.
3.2 MCDM Method Overview
The first measuring tool, Simple Additive Weighting (SAW) method part of compensatory group family, is one the most straightforward methods among multi-criteria decision tools, in the purest form the model lacks accuracy and the results may not be logical (shiwoei, 2013). Because of lack of objectivity and the need for
pairwise comparison feature of Analytical Hierarchical Process, this method was not considered useful to the research.
The PROMETHEE ranking methods first developed by Professor Brans (1982), the technique introduced new profitable perspective to decision tools. In the procurement strategy, the method focuses on minimizing the price paid to suppliers while simplifying the buying decisions, and it uses the key performance indicators and location decision, all in one package for business decisions from sustainable development to environmental and social issues.
Other popular methods such as Technique for the Order of Prioritization by Similarity to Ideal Solution (TOPSIS) aim at simplicity and being structured but according to Velasquez and Hester lack consistency in the process (Abbasi, 2013). Lastly, Analytical Hierarchical Process (AHP) due to ease of use and scalability is the subject of many articles, one of the usages of this method Is problems dealing with performance (Yaghoobi & Haddadi, 2016). One the features of this technique especially crucial for the survey-based research is the pairwise comparison, this feature enabled us to take a survey of our selected companies experts and compare different BSC measures against each other to benchmark them and track the HR performance efficiently and purposefully.
3.3 Enterprise Resource Planning Integration
During the last decade of twentieth century the use of technology, especially in mass data interpretation had a significant impact on businesses. Integrating and automating the management processes across the departments had a drastic impact on their performance. This integration is extremely important for merging organizational measurement tools such as BSC with business process management tools such as enterprise resource planning (ERP) and organizational dashboards.
There are many ERP packages which are extremely expensive and have a high risk of implementation associated to them, for this reason, evaluation for choosing the right package is needed before investment (Ufuk Cebeci, 2009), Integrating the ERP and BSC can be beneficial since both aim at improving and measuring organizational performance (Shen, Y.-C., Chen, P.-S., & Wang, C.-H, 2016).
Managing the organizational changes resulted from deliberate implementation of the research framework will contribute to the overall decision-making process and the execution of the ERP system will reduce the levels of complexity and operational performance.
4. DATA COLLECTION AND ANALYSIS
The goal of this section is to build a structured network of objectives (top level) and alternatives (sub-levels), using the Analytical Hierarchical Process we can assess the firm‟s performance focusing on as the name implies hierarchical level, the process is as follows;
First the system comprises of four primary criteria which are related to the Balanced Scorecard (BSC), it compares the performance of customer, internal processes, financial and training and innovation. The objective is to create a platform for continuous growth and productive environment (Bentes, Carneiro, da Silva, & Kimura, 2012). In this case, sustainability is key to ensuring change throughout the organization, and this is why this paper focuses on a structured, systematic framework using both decision analytics and performance tools.
With a hierarchy system of ranking the most effective performance indicators, we can prioritize our objectives, especially this method weights the indicators (W1 to
Wn) using the opinions of team members within the chosen companies to assess the
alternatives (X1 to Xn) concerning the overall objective,
* + ( ) * + ( )
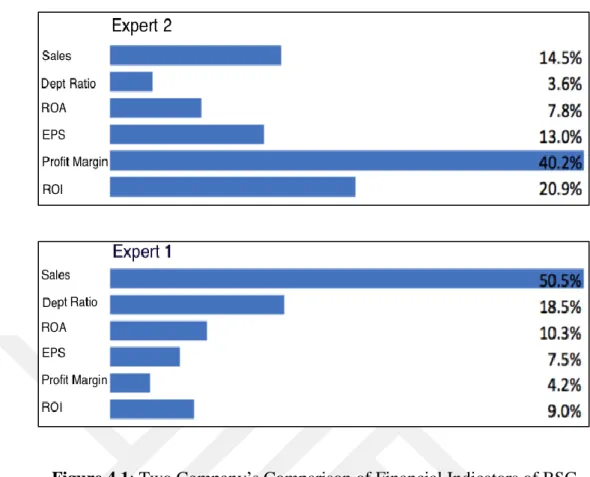
In the context of analytical hierarchy process, the priority of over depends on the weights given by individuals in the companies participated in the research, this means is preferred to only if . Different individuals ideally have different perceptions; this is shown explicitly in the results of our survey which is illustrated in Figure 4.1, as you can see for the first company the notion of profitability is more important than other financial perspectives and for the second company, this change drastically with sales having the highest weight.
Figure 4.1: Two Company‟s Comparison of Financial Indicators of BSC The process of breaking down these decision objectives and developing a model leads us to the next step, which is prioritizing the indicators for more proportionality and consistency. For this pairwise comparison is used to help to compare deferent alternatives concerning each other. At the core, AHP Is about proportional measurements; we are interested in knowing the relative comparison rather than exact measurement. The proportions are gathered in a relative pairwise comparison matrix which are displayed below,
( ) (
) ( )
Each alternative preferential degree is considered to be larger than zero in value and it is weighted relatively,
( )
Therefore, the rewritten version will be, ( ) ( ) ( )
elements of our decision matrix are constructed using survey data collection cited in the Appendix part of this research which is gathered from selected companies in Iran. The graphical representation of the hierarchy for the decision of performance evaluation is depicted in Figure 4.2 below which consists of 51 pair comparisons progressively evaluating the goal and objective. Each criterion in the graphical hierarchy model possess separate matrix, and therefore the alternatives are compared on the basis of criteria (Saaty 1977). The four criteria are shown with respect to their attributes which includes six measures in the financial perspective, five measures respectively in customer, internal business processes and training and innovation. César Álvarez Pérez Vicente odríguez Montequín Francisco Ortega Fernández Joaquín Villanueva Balsera 2017
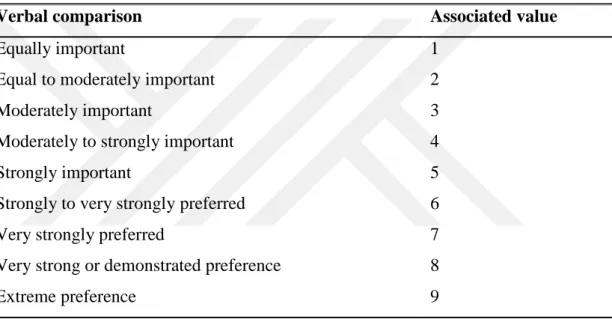
For determining the rate of relative comparison, reported in table 4.1 are nine scales associated to the verbal descriptions which were incorporated into the survey. In the research comparison between the sales performance and the number of new service items, in the case which one company was valued 5 for the Internal business process criterion. It is not necessary for the members to make a second comparison between the number of new service items and sales performance for the opposite comparison. Thus, in the method used if the preference value of sales performance for the number of new service items is valued 4, the preference for the number of new service items for sales performance will be valued 1/4 or 0.25.
Table 4.1: Preference Scale (Taylor, Bernard 2013)
Verbal comparison Associated value
Equally important
Equal to moderately important Moderately important
Moderately to strongly important Strongly important
Strongly to very strongly preferred Very strongly preferred
Very strong or demonstrated preference Extreme preference 1 2 3 4 5 6 7 8 9
Members of each company evaluated the indicators, and the best strategy will be selected accordingly with regard to the ratings for a more sustainable decision. The next stage will be normalizing those matrices which are obtained by dividing the columns of each alternative by its corresponding sum of the column. The average value of the rows will give the priority vector between the indicators. The product of this vector and the matrix specify the Parron‟s eigenvector which in case of the first company experts for the consolidated weight (which is showed in the transpose form) of the balanced scorecard (BSC) is shown below which is more precisely displayed in the Appendix section of the research.
-Divided by the corresponding row weight will result in the preference vector which we use for developing the spectral radius of a criterion. The computed
consistency index (CI) for the consolidated weighted mean of the balanced scorecard perspectives is approximately 0.09 which divided by the random index defined in Table 4.2 will be 0.0712, this level of consistency is lower than 0.10 which is satisfactory.
Table 4.2: Random Index (Taylor, Bernard 2013)
n 2 3 4 5 6 7 8 9
RI 0 0.5247 0.8816 1.1086 1.2479 1.3417 1.4057 1.4499
The Consistency Index (CI) and the calculated Consistency rate ensure more objectified results rather than subjective judgment for making decisions (Erbasi & Parlakkaya, 2012), the equation is as follows and the internal business perspective is applied in the formula.
( ) ( )
As mentioned the four perspectives of balanced scorecard surveyed from the participants of the companies were aggregated using the consolidated weighted mean, the geometric mean will result in a combined decision matrix consisting of all the weights given by experts in the companies participated in the research. The equation for the aggregation is as follows:
[ ∑ ( )
] (∏
) ( )
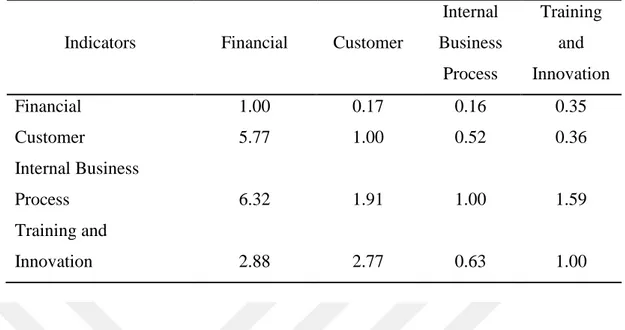
In the equation, N is the number of participants which are team members within three companies within the same industry and is decision indicators elements. The results of the aggregated pairwise comparison for BSC perspectives are shown in table 4.3 below,
Table 4.3: Aggregated Comparison of BSC
Indicators Financial Customer
Internal Business Process Training and Innovation Financial 1.00 0.17 0.16 0.35 Customer 5.77 1.00 0.52 0.36 Internal Business Process 6.32 1.91 1.00 1.59 Training and Innovation 2.88 2.77 0.63 1.00
The results are astonishingly relevant and significant; it shows that the same decision made by individual will be more accurate if aggregated by the members and group of people. The result of the BSC aggregated comparison indicates that although Financial wellbeing of the organization is essential, the emphasis always should be to better serve customer needs and wants. Training of the employees and sustainability of the company has a crucial role in the motivation of the employees and thus more productive behavior throughout the system.
The aggregated financial comparison chart is depicted in table 4.4, the table shows comparisons for the financial attributes which were surveyed from the selected companies in healthcare industry. Diagonally, all numbers in the matrix are one, meaning that the indicators are compared to each other. Between these indicators, the earning per share in relation to sales has higher preference; moreover, financial debt ratio in relation to sales has a higher preference.
Table 4.4: Aggregated Comparison of Financial Perspective
A company with high debt relative to equity shows that the company is overleveraged which can be extremely dangerous because there is no breathing room for mistakes and difficulties in the future. This chart also displays the vital nature of debt reduction and that it should be controlled but it can be inevitable due to competition and market risk features. Additionally, from the chart, it can be interpreted that profits from capital, encourage the performance and sales motivation towards sustainability. Return on assets is the ratio of earnings available for common stakeholders which is dividends on total assets generated from the company which is more emphasized than the return of investment which is defined by the ratio of the earnings to the total equity.
One indicator that is used most often in equity stocks is Earnings per share (EPS), this measures the earnings by the number of shares of outstanding stocks and it is shown that the importance is less highlighted with respect to sales and profit margin and ROI but more prominent than debt ratio and ROA and EPS respectively.
Indicators Sales Financial Debt Ratio Return on Assets (ROA) Earnings Per Share (EPS) Net Profit Margin Return on Investment (ROI) Sales 1.00 5.85 4.12 6.07 2.11 1.64 Financial Debt Ratio 0.17 1.00 1.34 0.65 0.50 0.69 Return on Assets (ROA) 0.24 0.75 1.00 0.33 1.34 0.64 Earnings Per Share (EPS) 0.16 1.53 3.00 1.00 0.41 0.46 Net Profit Margin 0.47 2.00 0.75 2.47 1.00 0.69 Return on Investment 2.00 1.44 1.55 2.15 1.44 1.00
The following table (4.5) shows the aggregated comparison matrix for customer perspective; this perspective is included in almost all business models; the satisfaction of the customers is an essential function of marketing and business. Table 4.5: Aggregated Comparison of Customer Perspective
Table 4.5 illustrates the importance of customer and satisfying the customer is the most important indicator of all customer perspective measures.
Profits from the customers can be less important than the whole stock share rate and more budget should spend on acquiring new customers which ultimately increase the shares and customer satisfaction.
This cycle will be not possible without systematically designing and monitoring processes leading to creative thinking among the members which this requires sustainable organizational culture (Emerald Group, 2013). Without continuous innovation and innovative thinking, there is a big probability of being left out of the competition. Indicators Customer Satisfaction Profits Per Customer Market Share Rate Customer Retention Rate Customer Acquisition Rate Customer Satisfaction 1.00 7.32 6.95 2.00 2.60 Profits Per Customer 0.14 1.00 0.21 0.20 0.17
Market Share Rate 0.14 4.76 1.00 0.46 0.58
Customer Retention Rate 0.50 4.93 2.15 1.00 0.91 Customer Acquisition Rate 0.39 5.94 1.71 1.10 1.00
The aggregated business internal process is displayed in table 4.6. The table shows that in the aggregated comparison, number of new service items is preferred in relation to the sales performance.
Table 4.6: Aggregated Comparison of Internal Process
Managers use different systems for evaluation and implementation of the processes; Table 4.6 suggests that the process of auditing the customer complaints is “strongly to very strongly” preferred to sales performance and very strong preference to the number of newly added service items. The chart also shows that the efficient use of transaction is also necessary in sales and new services added to the process but having rationalized processes in place and retaining and creating loyal customers through continuously having a system for feedbacks is also crucial in developing customer relationship.
Lastly training and innovation programs are preventive actions which is also part of ISO 9001 which is required because it ensures the competency of the individual who performs the action which is necessary for the processes.
Indicators Sales Performance Rationalized Processes Customer Complaint Number of New Service Items Transaction efficiency Sales Performance 1.00 0.15 0.16 2.92 0.93 Rationalized Processes 6.54 1.00 1.59 3.27 6.00 Customer Complaints 6.35 0.63 1.00 7.27 6.65 Number of New Service Items 0.34 0.31 0.14 1.00 0.58 Transaction efficiency 1.08 0.17 0.15 1.71 1.00
The aggregated training and innovation is displayed in table 4.7, The table shows that in the aggregated comparison of training and innovation process organization competence is preferred in relation to professional training. Moreover, customer service replication is more preferred in relation to professional training.
Table 4.7: Aggregated Comparison of Training and Innovation Process
Indicators Professional Training Employee Satisfaction Organization Competence Employee Stability Customer Service Replication Professional Training 1.00 2.65 5.19 0.63 4.58 Employee Satisfaction 0.38 1.00 2.01 1.59 4.58 Organization Competence 0.19 0.50 1.00 1.71 1.71 Employee Stability 1.59 0.63 0.58 1.00 2.52 Customer Service Replication 0.22 0.22 0.58 0.40 1.00
4.1 Consolidated Preferences of the Perspectives
After the normalization process which is evaluated by the equation (4.10), the weighted arithmetic mean was deduced, for the comparison matrix ̂ , ̂ - and the consolidated vectors ranking the perspectives are displayed in following tables,
∑ ( )
The table 4.8 suggests that training the employees is worth the investment and the processes that are implemented contribute to the success of the company. Having