CEPSTRAL METHODS FOR IMAGE FEATURE
EXTRACTION
a thesis
submitted to the department of electrical and
electronics engineering
and the institute of engineering and science
of bilkent university
in partial fulfillment of the requirements
for the degree of
master of science
By
Serdar C
¸ akır
August 2010
I certify that I have read this thesis and that in my opinion it is fully adequate, in scope and in quality, as a thesis for the degree of Master of Science.
Prof. Dr. A. Enis C¸ etin(Supervisor)
I certify that I have read this thesis and that in my opinion it is fully adequate, in scope and in quality, as a thesis for the degree of Master of Science.
Assoc. Prof. Dr. Uˇgur G¨ud¨ukbay
I certify that I have read this thesis and that in my opinion it is fully adequate, in scope and in quality, as a thesis for the degree of Master of Science.
Assist. Prof. Dr. Sinan Gezici
Approved for the Institute of Engineering and Sciences:
Prof. Dr. Levent Onural
ABSTRACT
CEPSTRAL METHODS FOR IMAGE FEATURE
EXTRACTION
Serdar C
¸ akır
M.S. in Electrical and Electronics Engineering
Supervisor: Prof. Dr. A. Enis C
¸ etin
August 2010
Image feature extraction is one of the most vital tasks in computer vision and pattern recognition applications due to its importance in the preparation of data extracted from images.
In this thesis, 2D cepstrum based methods (2D mel- and Mellin-cepstrum) are proposed for image feature extraction. The proposed feature extraction schemes are used in face recognition and target detection applications. The cepstral features are invariant to amplitude and translation changes. In addition, the features extracted using 2D Mellin-cepstrum method are rotation invariant. Due to these merits, the proposed techniques can be used in various feature extraction problems.
The feature matrices extracted using the cepstral methods are classified by Common Matrix Approach (CMA) and multi-class Support Vector Machine (SVM). Experimental results show that the success rates obtained using cepstral feature extraction algorithms are higher than the rates obtained using standard baselines (PCA, Fourier-Mellin Transform, Fourier LDA approach). Moreover, it
is observed that the features extracted by cepstral methods are computationally more efficient than the standard baselines.
In target detection task, the proposed feature extraction methods are used in the detection and discrimination stages of a typical Automatic Target Recogni-tion (ATR) system. The feature matrices obtained from the cepstral techniques are applied to the SVM classifier. The simulation results show that 2D cepstral feature extraction techniques can be used in the target detection in SAR images.
Keywords: Image Feature Extraction, 2D cepstrum, 2D mel-cepstrum, 2D
Mellin-cepstrum, Fourier-Mellin Transform, Face Recognition, Target Detection, SAR images
¨
OZET
˙IMGE ¨OZN˙ITEL˙IK C¸IKARIMI ˙IC¸˙IN KEPSTRAL
Y ¨
ONTEMLER
Serdar C
¸ akır
Elektrik ve Elektronik M¨uhendisliˇgi B¨ol¨um¨u Y¨uksek Lisans
Tez Y¨oneticisi: Prof. Dr. A. Enis C
¸ etin
A˘gustos 2010
˙Imgelerden ¸cıkarılan bilgilerin hazırlanmasındaki ¨oneminden dolayı, imge ¨oznitelik ¸cıkarımı, bilgisayarla g¨orme ve ¨or¨unt¨u tanıma alanlarındaki en ¨onemli ¸calı¸sma alanlarından biridir.
Bu tezde, imgelerden ¨oznitelik ¸cıkarımı i¸cin, iki boyutlu (2B) kepstrum tabanlı y¨ontemler (2B mel- ve Mellin-kepstrum) sunulmaktadır. Onerilen¨ ¨oznitelik ¸cıkarım teknikleri, y¨uz tanıma ve hedef tespit uygulamalarında kullanılmı¸stır. Kepstral ¨oznitelikler, genlik ve ¨oteleme de˘gi¸simlerine kar¸sı de˘gi¸simsizdir. Buna ek olarak, 2B Mellin-kepstrum kullanılarak ¸cıkarılan ¨oznitelikler, d¨onme de˘gi¸simsizdir. Sa˘gladı˘gı bu faydalardan dolayı, ¨onerilen y¨ontemler ¸ce¸sitli ¨oznitelik ¸cıkarım problemlerinde kullanılabilir.
Kepstral y¨ontemler kullanılarak ¸cıkarılan ¨oznitelik matrisleri, Ortak Ma-tris Yakla¸sımı (CMA) ve ¸cok sınıflı Destek Vekt¨or Makinası (SVM) kulla-narak sınıflandırılmı¸stır. Deneysel sonu¸clar, kepstral ¨oznitelik ¸cıkarım algorit-maları kullanılarak elde edilen ba¸sarı oranlarının standart temel y¨ontemlerle (Temel Bile¸sen Analizi, Fourier-Mellin D¨on¨u¸s¨um¨u, Do˘grusal Ayırta¸c Analizi) elde edilen ba¸sarı oranlarından y¨uksek oldu˘gunu g¨ostermi¸stir. Dahası, kepstral
y¨ontemlerce ¸cıkarılan ¨ozniteliklerin, hesaplama y¨uk¨u bakımından daha verimli oldu˘gu g¨ozlemlenmi¸stir.
Hedef tespiti g¨orevinde, ¨onerilen ¨oznitelik ¸cıkarım y¨ontemleri, tipik Otomatik Hedef Tanıma (ATR) sisteminin, tespit ve ayrımsama a¸samalarında kul-lanılmaktadır. Kepstral y¨ontemlerden elde edilen ¨oznitelik matrisleri SVM sınıflandırıcısına uygulanmı¸stır. Benzetim sonu¸cları, 2B kepstral ¨oznitelik ¸cıkarım y¨ontemlerinin SAR imgelerinde hedef tespitinde kullanılabilece˘gini g¨ostermi¸stir.
Anahtar Kelimeler: ˙Imge ¨Oznitelik C¸ ıkarımı, ˙Iki Boyutlu (2B) Kepstrum, 2B mel-kepstrum, 2B Mellin-kepstrum, Fourier-Mellin D¨on¨u¸s¨um¨u, Y¨uz Tanıma, Hedef Tespiti, SAR imgeleri
ACKNOWLEDGMENTS
I would like to express my gratitude to Prof. Dr. A. Enis C¸ et˙ın for his supervi-sion, guidance and suggestions throughout the development of this thesis.
I would also like to thank Assoc. Prof. Dr. Uˇgur G¨ud¨ukbay and Assist. Prof. Dr. Sinan Gezici for reading, reviewing and making suggestions on this thesis.
I wish to extend my thanks to all colleagues who have helped me in the development of this thesis. Special thanks to Osman G¨unay and Kıvan¸c K¨ose.
I would also like to thank T ¨UB˙ITAK for providing financial support through-out my graduate study.
I would like to express my special thanks to my parents. Thank you for your love, support and encouragement.
And last, but certainly not the least, I would like to thank my girlfriend, Tu˘gba Leblebici, for her love, patience and continuous support.
Contents
1 Introduction 1
2 Facial Image Feature Extraction using Cepstral Methods 4
2.1 Related Work on Facial Image Feature Extraction . . . 5
2.1.1 2D cepstrum . . . 6
2.1.2 Fourier-Mellin Transform . . . 7
2.1.3 Rotation, Scale and Translation Invariance . . . 7
2.2 2D Mel-cepstrum Method . . . 9
2.3 2D Mellin-cepstrum Method . . . 13
2.4 Face Databases . . . 16
2.4.1 AR Face Database . . . 16
2.4.2 ORL Face Database . . . 17
2.4.3 Yale Face Database . . . 18
2.4.4 FRGC Version 2 Face Database . . . 18
2.5.1 Classifier . . . 19
2.5.2 Procedure . . . 21
2.6 Experimental Results . . . 24
2.7 Summary . . . 29
3 Feature Extraction from SAR Images using Cepstral Methods 31 3.1 Related Work on SAR Image Feature Extraction . . . 32
3.2 SAR Image Feature Extraction Using Cepstral Methods . . . 33
3.3 SAR Image Database . . . 34
3.4 Target Detection Strategy . . . 36
3.4.1 Classifier . . . 37
3.5 Experimental Results . . . 37
3.6 Summary . . . 40
4 Conclusion 41
APPENDIX 44
A Non-uniform grids used in Cepstral Computations 44
List of Figures
2.1 2D cepstrum calculation steps. . . 6
2.2 2D FMT calculation steps. . . 7
2.3 2D mel-cepstrum based feature extraction algorithm. . . 11
2.4 A representative 2D mel-cepstrum grid in the DTFT domain. Cell sizes are smaller at low frequencies compared to high frequencies. 11 2.5 35 × 35 normalized weights for emphasizing high frequencies. . . . 12
2.6 Magnitude of 35 × 35 2D mel-cepstrum of a face image matrix. . . 13
2.7 2D Mellin-cepstrum feature extraction algorithm. . . 14
2.8 35 × 35 2D Mellin-cepstrum of the face image matrix. . . 16
2.9 Sample images from AR face database. . . 17
2.10 Sample images from ORL face database. . . 17
2.11 Sample images from Yale face database. . . 18
2.12 Sample images from “Experiment 1 subset” of FRGC version 2 database. . . 19
2.13 Illumination compensated sample images for randomly selected
subjects from AR face database. . . 22
2.14 Illumination compensated sample images for randomly selected subjects from ORL face database. . . 23
2.15 Illumination compensated sample images for randomly selected subjects from Yale face database. . . 23
2.16 Illumination compensated sample images for randomly selected subjects from FRGC version 2 face database. . . 24
3.1 Stages of a typical SAR ATR system (Reprinted from [1]). . . 31
3.2 DH-6 Twin Otter Aircraft (Reprinted from [2]). . . 34
3.3 Sample target & clutter images. . . 35
3.4 The flow diagram of the target detection strategy. . . 36
A.1 49 × 49 non-uniform grid used in the cepstral feature extraction techniques. The DFT size is 255 × 255. . . 45
A.2 39 × 39 non-uniform grid used in the cepstral feature extraction techniques. The DFT size is 255 × 255. . . 46
A.3 35 × 35 non-uniform grid used in the cepstral feature extraction techniques. The DFT size is 255 × 255. . . 47
A.4 29 × 29 non-uniform grid used in the cepstral feature extraction techniques. The DFT size is 255 × 255. . . 48
List of Tables
2.1 Recognition Rates (RR) that are obtained when cepstral features extracted using different Non-uniform Grids (NGs) are applied to CMA classifier. . . 25 2.2 Recognition Rates (RR) that are obtained when cepstral features
extracted using different Non-uniform Grids (NGs) are applied to multi-class SVM classifier. . . 26 2.3 Recognition Rates (RR) of CMA classifier with different databases
and feature sets. IC stands for Illumination Compensation. . . 27 2.4 Recognition Rates (RR) of multi-class SVM classifier with
differ-ent databases and feature sets. IC stands for Illumination Com-pensation. . . 28
3.1 The target detection accuracies and false alarm rates obtained with different Non-uniform Grids used in the calculation of 2D mel- and Mellin-cepstrum features. NG: Non-uniform Grid. . . 38 3.2 The target detection accuracies and false alarm rates obtained
using region covariance and region codifference methods with SVM classifier. The results are adopted from [1]. . . 39
Chapter 1
Introduction
Rapid advances in computer technology encouraged scientist and researchers to perform tremendous amount of research in the fields of computer vision and pattern recognition. Extracting meaningful and important information from an image is one of the most important tasks in these fields [3]. The first step in many image and video processing methods is feature extraction. The features are used to represent patterns and objects in various applications such as detection, recognition and registration. Feature extraction process not only provides better pattern representation but also lowers the computational complexity. Many tech-niques have been developed to extract various features [4]. Feature extraction techniques can be grouped into two main categories as low-level and high-level methods. The low-level features can be extracted directly from input image and high-level features are based on low-level features. The high-level features are ex-tracted from low-level features by performing various techniques [5]. Modalities (low-level features) and classifiers are used in a data-fusion framework in order to extract high level features [6]. The features can be grouped more systematically as general features and domain-specific features [7].
General features include pixel-level, local and global features. Pixel-level features can be calculated in each pixel using color, intensity and first/second derivative information. Pixel-level features are used successfully in computer vision applications [8, 9].
The local features are based on the appearance of the objects at particular interest points. These features are ideally invariant to illumination, amplitude variations as well as rotational and scale changes. The calculation of local features is based on extracting special information in the Region of Interest (ROI) [1]. The local features can be calculated over the outputs of image segmentation [10] and edge detection [11] algorithms. An example to a such feature is object shape. Global features include calculation of statistical properties such as histogram, mean and moment over the whole or part of the image [12, 13, 14, 15]. The part or ROI of the image is represented with a single histogram, mean or moment value. Therefore histogram, mean and moment methods provide additional dimensional reduction by combining the values in the ROI.
Domain-specific features are application dependent. Depending on the char-acteristics of the pattern used in a certain application, appropriate feature types and extraction techniques are determined. The feature extraction techniques can be used individually as well as cascaded one after another.
The goal of this thesis is to propose a feature extraction technique to repre-sent images better and to use this technique in various image feature extraction problems. The main objective of the thesis is to develop a feature extraction method that provides translation, illumination and rotation invariant features which can eliminate variations and changes in various images including facial and SAR images.
In this thesis, 2D mel-cepstrum based feature extraction techniques are pro-posed for image feature extraction. Mel-cepstral analysis is one of the most
popular feature extraction techniques in speech processing applications includ-ing speech and sound recognition and speaker identification [16]-[20]. Two-dimensional (2D) cepstrum, 2D extension of the 1D frequency cepstrum, is also used in image registration and filtering applications [21, 22, 23, 24]. To the best of our knowledge 2D mel-cepstrum which is a variant of 2D cepstrum is not used in image feature extraction, classification and recognition problems. In this work, proposed cepstral methods are used in both face recognition and SAR image tar-get detection applications. Common Matrix Approach (CMA) and multi-class Support Vector Machine (SVM) are used as classification engines.
The computation of proposed cepstral features includes the logarithm opera-tor. Due to the logarithm operator, the cepstral features are invariant to ampli-tude changes. Since the cepstral features are based on Fourier transform, they are independent of translational shifts. Moreover, the cepstral method described in Section 2.3 produces rotation invariant features resulting from the log-polar conversion. The cepstral feature calculation steps also include non-uniform grid and weighting operations. The Fourier transform of the input image is applied to the non-uniform grid. The non-uniform grid includes bins that are smaller at low frequencies compared to high-frequencies. The DFT values are grouped in each cell of the logarithmic grid by computing the mean value. In this way, the dimensions of the 2D mel-cepstrum based features become smaller than the dimensions of the original image.
The rest of the thesis is organized as follows. In Chapter 2, 2D mel- and Mellin-cepstrum feature extraction methods are proposed and used in the face recognition problem. The procedure, classifiers, dataset and simulation results are presented in the same chapter. In Chapter 3, the proposed cepstral features are used in feature extraction from SAR images in target detection application. Conclusions are made and the contributions are stated in the last chapter.
Chapter 2
Facial Image Feature Extraction
using Cepstral Methods
In this chapter, 2D mel-cepstrum and 2D Mellin-cepstrum are proposed for fea-ture extraction from images. These feafea-tures are applied to the face recognition problem and used for extracting facial features. The cepstral feature matrices are applied to the Common Matrix Approach (CMA) classifier [25] and multi-class Support Vector Machine (SVM) [26].
The performance of the proposed cepstral features are compared with the original pixel value based features and the features extracted by using standard baseline methods such as 2D PCA, 2D PCA with illumination compensation algorithm [27], Fourier LDA [28] and Fourier-Mellin transform [29].
The rest of the chapter is organized as follows. In Section 2.1, related work in facial image feature extraction is presented. 2D mel- and Mellin-cepstrum feature extraction methods are proposed and explained in Sections 2.2 and 2.3, respec-tively. AR face database [30], ORL face database [31], Yale face database [32] and FRGC version 2 database [33] are used in the experimental studies for facial feature extraction. These face databases are briefly introduced in Sections 2.4.1,
2.4.2, 2.4.3 and 2.4.4 respectively. In Section 2.5, the face recognition strategy and the classifiers used in the experiments are described. Finally, experimental results and observations are presented in Section 2.6. The experimental studies and simulations are carried out using MATLAB R2009b computational envi-ronment.
2.1
Related Work on Facial Image Feature
Ex-traction
Facial image feature extraction is the most important step in face recogni-tion [34, 35] that is still an active and popular area of research due to its various practical applications such as security, surveillance and identification systems. Significant variations in the images of same faces and similarities between the images of different faces make it difficult to recognize human faces. Principal Component Analysis (PCA) and Linear Discriminant Analysis (LDA) are well known techniques that were used in face recognition [36, 37, 38]. Although PCA is used as a successful dimensional reduction technique in face recognition, direct LDA based methods cannot provide good performance when there are large vari-ations and illumination changes in the face images. LDA with some extensions such as quadratic LDA [39], Fisher’s LDA [40], and direct, exact LDA [41] were proposed. PCA is known as a popular linear feature extraction method that is used in one of the most famous techniques called eigenfaces. In the eigenface method, image space is simply projected to a low dimensional feature space [42]. That is how the dimensional reduction is achieved.
In order to extract better representative features from facial images, re-searchers have performed frequency domain analysis techniques. Jing et al. select appropriate frequency bands for image representation using separability judgment [28]. In another work, Jing et al. use fractional Fourier transform
developed from conventional Fourier transform to extract discriminative Fourier transform based features [43]. Lai et al. use holistic Fourier invariant features to represent face images [44]. These features provide translation, scale and on-plane rotation invariance by combining wavelet and Fourier transforms. 2D cepstrum and Fourier-Mellin transform are also used in image processing applications.
In Subsections 2.1.1 and 2.1.2, two important works (2D cepstrum and Fourier-Mellin transform) regarding the proposed cepstral feature extraction methods are briefly explained.
2.1.1
2D cepstrum
Mel-cepstral analysis is a commonly used method in speech processing applica-tions including speech and sound recognition and speaker identification [16]-[20]. Two-dimensional (2D) cepstrum, 2D extension of the 1D frequency cepstrum, is proposed for image registration and filtering applications [21, 22, 23, 24]. The cepstrum can be defined as spectrum of the log spectrum of the energy signal and the calculation of the cepstrum of a 2D signal, e.g., an image, is illustrated in Figure 2.1.
Figure 2.1: 2D cepstrum calculation steps.
2D cepstrum provides features that are independent of pixel amplitude vari-ations (scale invariance) or gray-scale changes, which leads to robustness against illumination variations. Since it is a FT based method it is also independent of translational shifts. The scale invariance property of cepstral features is given
in Equations 2.10 and 2.11 and translation invariance property of a 2D signal is explained in Section 2.1.3.
2.1.2
Fourier-Mellin Transform
Fourier-Mellin transform (FMT) is a mathematical feature extraction tool which is used in some pattern recognition applications [45, 29]. The FMT is gener-ally implemented by performing a log-polar mapping followed by the Fourier transform (FT) [29]. The illustration of the FMT is given in Figure 2.2.
Figure 2.2: 2D FMT calculation steps.
The main idea behind this technique is to represent rotation and scaling as translations along some axes and to take advantage of the translation invariance property of the Fourier transform. Rotation, scale and translation invariance properties are given in the following subsection.
2.1.3
Rotation, Scale and Translation Invariance
Consider a 2D signal, e.g. an image, ymod(n1, n2) that is the rotated scaled and translated version of y(n1, n2). The relation between y and ymod is given as
follows:
ymod(n1, n2) = y (β(n1cos α0+ n2sin α0) + n1,0, β(−n1sin α0+ n2cos α0) + n2,0) (2.1)
where α0, β and (n10, n20) are rotation, scale and translation parameters, respec-tively.
Let Y and Ymodbe the Fourier transforms of y and ymod. The relation between
Y and Ymod is given as follows:
Ymod(u, v) = 1
β2e
−j2π(n10u+n20v)Y (u cos α0+ v sin α0
β ,
−u sin α0+ v cos α0
β )
(2.2) If one calculates the magnitude of the expression in Equation 2.2, the following equation is obtained: |Ymod(u, v)| = 1 β2 ¯ ¯ ¯
¯Y (u cos α0+ v sin α0β ,−u sin α0β+ v cos α0) ¯ ¯ ¯
¯ (2.3)
which is translation invariant. Log-polar conversion is performed by considering the coordinates such that:
u = eρcos θ
v = eρsin θ (2.4)
By substituting u and v in Equation 2.3, the following equation is obtained:
|Ymod(eρcos θ, eρsin θ)| = β12
¯ ¯ ¯Y (eρcos(θ−α0) β , eρsin(θ−α 0) β ) ¯ ¯ ¯ = 1 β2 ¯
¯Y (eρ−log βcos(θ − α
0), eρ−log βsin(θ − α0)) ¯
¯ (2.5)
Let YLP and Ymod,LP denote log-polar mappings of Y and Ymod, respectively.
Then, Equation 2.5 can be rewritten as:
Ymod , LP(ρ, θ) = 1
β2YLP(ρ − log β, θ − α0) (2.6) where YLP(ρ, θ) = |Y (e
ρcos θ, eρsin θ)|
Ymod , LP(ρ, θ) = |Ymod(eρcos θ, eρsin θ)|
According to Equation 2.6, the rotation and scale changes appear in the calcu-lations as translational shifts after performing log-polar conversion. These trans-lational shifts can be eliminated by taking the absolute value of Equation 2.6. At the end, extracted features become invariant to rotation and translation. The scaling factor ( 1
β2) in Equation 2.6 can be removed by using the scale invariance
2.2
2D Mel-cepstrum Method
In this section, 2D mel-cepstrum feature extraction technique that is based on the cepstrum of a 2D signal is proposed. In the literature, the 2D cepstrum was used for shadow detection, echo removal, automatic intensity control, enhancement of repetitive features and cepstral filtering [21, 22, 23].
2D mel-cepstrum is based on the classical 2D cepstrum ˆy(p, q) of a 2D image y(n1, n2), which is given by:
ˆ
y(p, q) = F−1
2 (log(|Y (u, v)|2)), (2.7)
where (p, q) denote the 2D cepstral quefrency coordinates, F−1
2 denotes 2D In-verse Time Fourier Transform (IDTFT) and Y (u, v) is the 2D Discrete-Time Fourier Transform (DTFT) of the image y(n1, n2). The cepstral feature domain is neither frequency domain, nor time domain. Therefore, Bogert et al. chose to refer this special domain as “quefrency domain” [46]. In the calculation of DTFT of a given signal, Fast Fourier Transform (FFT) algorithm is used in practice.
Because of the logarithm operation in Equation 2.7, the 2D cepstrum is in-dependent of pixel amplitude variations or gray-scale changes. This leads to robustness against illumination variations. Since it is an FT based method it is also independent of translational shifts. Similarly, 2D mel-cepstrum which is based on both logarithmic spectrum and logarithmic decomposition of frequency domain grid also has the same shift and amplitude invariance properties as the 2D cepstrum.
In 2D mel-cepstrum, the DTFT domain data is divided into non-uniform bins in a logarithmic manner as shown in Figure 2.4 and the energy |G(m, n)|2 of each bin is computed as follows:
|G(m, n)|2 = X
k,l∈B(m,n)
where Y (k, l) is the Discrete Fourier Transform (DFT) of y(n1, n2), and B(m, n) is the (m, n) − th cell of the logarithmic grid. Cell or bin sizes are smaller at low frequencies compared to high-frequencies. This approach is similar to the mel-cepstrum computation in speech processing. Similar to speech signals most natural images, including face images, are low-pass in nature. Therefore, there is more signal energy at low-frequencies compared to high frequencies. Logarithmic division of the DFT grid emphasizes high frequencies which may have more discriminative power. After this step, 2D mel-frequency cepstral coefficients, ˆ
ym(p, q), are computed using either inverse DFT or DCT as follows:
ˆ
ym(p, q) = F2−1(log(|G(m, n)|2)) (2.9) The size of the Inverse DFT (IDFT) is smaller than the size of the forward DFT used to compute Y (k, l) because of the logarithmic grid shown in Figure 2.4. Since several DFT values are grouped together in each cell, the resulting 2D mel-cepstrum sequence computed using the IDFT has smaller dimensions than the original image. It is also possible to apply different weights to different bins (cells) to emphasize certain bands as in speech processing. The steps of the 2D mel-cepstrum based feature extraction scheme is summarized below.
N × N 2D DFTs of input images are calculated. The DFT size N should be larger than the image size. It is better to select N = 2r >
dimension(y(n1, n2)) to take advantage of the FFT algorithm during DFT computation.
The non-uniform DTFT grid is applied to the resultant DFT matrix and the energy |G(m, n)|2 of each cell is computed. Each cell of the grid can be also weighted with a coefficient. The new data size is M × M where
M ≤ N
2D IDFT or 2D IDCT of the M × M data is computed to get the M × M mel-cepstrum sequence.
The flow diagram of the 2D mel-Cepstrum feature extraction technique is given in Figure 2.3.
Figure 2.3: 2D mel-cepstrum based feature extraction algorithm.
Figure 2.4: A representative 2D mel-cepstrum grid in the DTFT domain. Cell sizes are smaller at low frequencies compared to high frequencies.
In a face image, edges and important facial features generally contribute to high frequencies. In order to extract better representative features, high fre-quency component cells of the 2D DFT grid are multiplied with higher weights
compared to low frequency component cells in the grid. As a result, high fre-quency components are further emphasized. In order to emphasize the high frequency component cells of the 2D DFT grid further, the normalized weights are organized as in Figure 2.5. White values corresponds to 1 and black values corresponds to 0 in Figure 2.5. The smallest value used in Figure 2.5 is 0.005.
Figure 2.5: 35 × 35 normalized weights for emphasizing high frequencies.
Invariance of cepstrum to pixel amplitude changes is an important feature. In this way, it is possible to achieve robustness to illumination invariance. Let
Y (u, v) denote the 2D DTFT of a given image matrix y(n1, n2), then cy(n1, n2) has a DTFT cY (u, V ) for any real constant c. The log spectrum of cY (u, V ) is given as follows:
log(|cY (u, v)|) = log(|c|) + log(|Y (u, v)|) (2.10)
and the corresponding cepstrum is given as follows:
ψ(p, q) = ˆaδ(p, q) + ˆy(p, q) where δ(p, q) = 1 p = q = 0 0 otherwise (2.11)
Therefore, the cepstrum values, except at (0, 0) location (DC Term), do not vary with the amplitude changes. Since the Fourier Transform magnitudes of y(n1, n2)
and y(n1− k1, n2− k2) are the same, the 2D cepstrum and mel-cepstrum are shift invariant features.
Another important characteristic of 2D cepstrum is symmetry with respect to ˆy[n1, n2] = ˆy[−n1, −n2]. As a result only half of the 2-D cepstrum or MxM 2D mel-cepstrum coefficients are enough when IDFT is used.
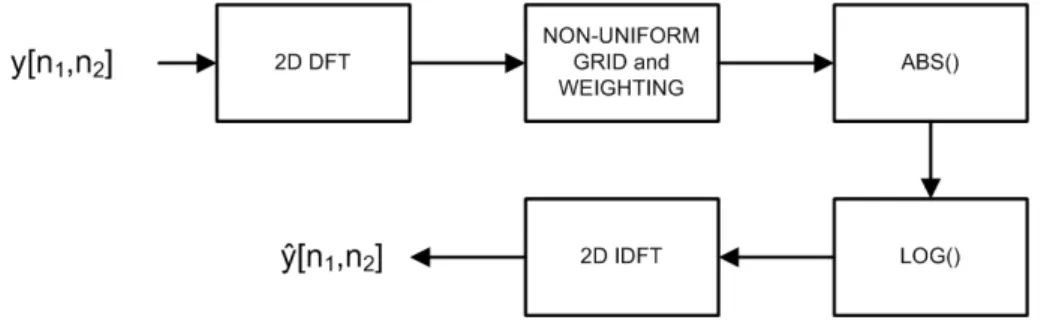
In this thesis, the dimensions of cepstral features are selected as M=49, 39, 35, 29 to represent various size face images. The size of the cepstral features differs, because different non-uniform grids group frequency coefficients in a different manner. 35 × 35 2D mel-cepstrum of a face image is displayed in Figure 2.6. The symmetric structure of 2D mel-cepstrum domain features can be observed in the figure.
Figure 2.6: Magnitude of 35 × 35 2D mel-cepstrum of a face image matrix.
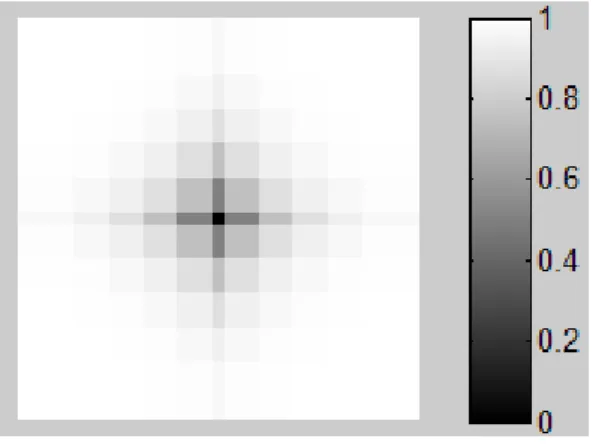
2.3
2D Mellin-cepstrum Method
In this subsection, 2D Mellin-cepstrum feature extraction method is proposed to obtain rotation invariant features. The 2D Mellin-cepstrum feature extraction technique is a modified version of the 2D mel-cepstrum algorithm. It takes
advantage of the Mellin transform and provides rotation, scale and illumination invariant features. Fourier-Mellin transform based features are rotation, scale and translation invariant [29].
2D Mellin-cepstrum feature extraction algorithm is explained below and the flow diagram of this technique is given in Figure 2.7.
Figure 2.7: 2D Mellin-cepstrum feature extraction algorithm.
Steps of 2D Mellin-cepstrum feature extraction method are summarized be-low:
N × N 2D DFTs of input images are calculated. The DFT size N should be larger than the image size. It is better to select N = 2r >
dimension(y(n1, n2)) to take advantage of the FFT algorithm during DFT computation.
Logarithm of magnitudes of the DFT coefficients are computed.
The non-uniform DFT grid is applied to the resultant matrix and the energy
|G(m, n)|2of each cell is computed. Each cell of the grid is represented with this energy and the cell is weighted with a coefficient. The new data size is M × M where M ≤ N
Cartesian to Log-polar conversion is performed using bilinear interpolation. This is the key step of the Fourier-Mellin transform providing rotation and scale invariance.
2D IDFT of the M × M data is computed.
Absolute values or energies of the IDFT coefficients are calculated to get the M × M Mellin-cepstrum sequence.
Since 2D Mellin-cepstrum features are Fourier transform based features, they are independent of translational shifts. They are also invariant to pixel amplitude changes due to the logarithm operator. In addition, 2D Mellin-cepstrum has rotation and scale invariance properties.
Since there exists a log-polar conversion step in the calculation of 2D Mellin-cepstrum features, these features are not symmetric with respect to ˆy[n1, n2] = ˆ
y[−n1, −n2]. Therefore, one half of the 2D Mellin-Cepstrum features is not suf-ficient to represent the image. As a result, the size of the 2D Mellin-Cepstrum features is twice size of the 2D mel-cepstrum based features.
Different sized 2D Mellin-cepstrum features are calculated using different non-uniform grids and weights given in Section 2.2. As an example, 35 × 35 2D Mellin-cepstrum of a face image is displayed in Figure 2.8.
Figure 2.8: 35 × 35 2D Mellin-cepstrum of the face image matrix.
2.4
Face Databases
In this section, the databases used in experimental simulations are introduced.
2.4.1
AR Face Database
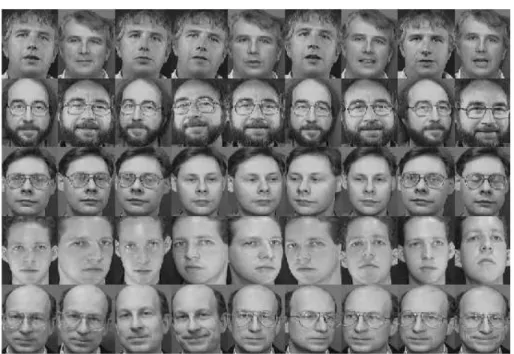
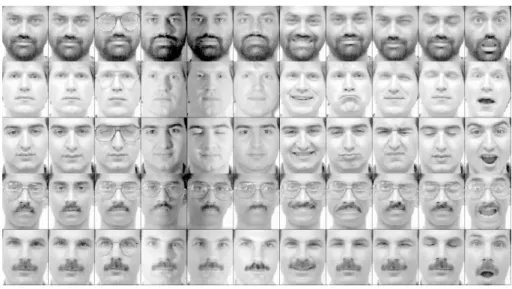
AR face database, created by Aleix Martinez and Robert Benavente, contains 4000 facial images of 126 subjects. 70 of these subjects are male and the remain-ing 56 subjects are female. Each subject has different poses includremain-ing different facial expressions, illumination conditions, and occlusions (sun glasses and scarf). The face images are all in the dimensions of 768 × 576 pixels. In this work, 14 non-occluded poses of 50 subjects are used. Face images are converted to gray scale, normalized, cropped and resized to 100x85. Sample poses for randomly selected five subjects from AR face database are shown in Figure 2.9.
Figure 2.9: Sample images from AR face database.
2.4.2
ORL Face Database
The second database used in this section is ORL face database. ORL database contains 40 subjects and each subject has 10 poses. The images are captured at different time periods, different lighting conditions and different accessories for some of the subjects. In this work 9 poses of each subject are used. In ORL face database, images are all in gray scale with dimensions of 112x92. Sample images from the ORL face database are shown in Figure 2.10.
2.4.3
Yale Face Database
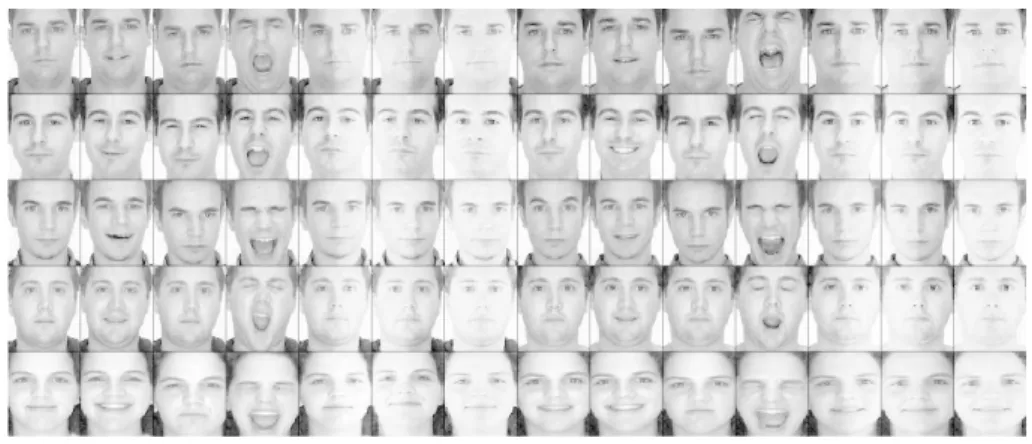
The third database used in this section is the Yale face database. Yale database contains gray scale facial images with sizes of 152x126. The database contains 165 facial images belonging to 15 subjects. Each pose of the subjects has different facial expressions and illuminations. Sample images from Yale database are shown in Figure 2.11.
Figure 2.11: Sample images from Yale face database.
2.4.4
FRGC Version 2 Face Database
The FRGC version 2 database [33] contains 12776 images belonging to 222 sub-jects. In our experiments, the image set previously used in the experiment 1 [33] is used. The experiment 1 subset images are taken in a controlled environment under different illumination and facial expressions. The dataset contains 16028 images of 225 subjects and the number of poses for each person varies between 32 and 88. In order to have a dataset with equal number of poses for each subject, 32 poses of each subject are randomly selected. At the end, we have a subset including 7200 facial images. The images are cropped and resized to 50 × 50 by
using a simple face detection algorithm [47]. Sample images of FRGC Version 2 database are displayed in Figure 2.12.
Figure 2.12: Sample images from “Experiment 1 subset” of FRGC version 2 database.
2.5
Face Recognition Strategy
After the extraction of features using cepstral methods, the extracted features are applied to two different classifiers (Common Matrix Approach and Support Vector Machine) in order test the cepstral features’ performance. In the following subsections, CMA and SVM classifiers are briefly explained.
2.5.1
Classifier
In this section, the classifiers used in the experimental studies, Common Matrix Approach (CMA) and multi-class SVM, are presented. The CMA directly uses feature matrices as input. On the other hand, SVM needs an additional step to convert the 2D cepstral domain feature matrices into vectors. In the next subsection, the CMA method is described. Then, the multi-class SVM method is mentioned.
Common Matrix Approach (CMA)
The Common Matrix Approach (CMA) is a 2D extension of Common Vector Approach (CVA), which is a subspace based pattern recognition method [48]. The CVA was successfully used in finite vocabulary speech recognition [49]. The CMA is used as a classification engine in this article. In order to train the CMA, common matrices belonging to each subject (class) are computed. In an image dataset, there are C classes that contain K face images. Let yc
i denote the ith
image matrix belonging to the class c. The common matrix calculation process starts with selecting a reference image for each class. Then, the reference im-ages are subtracted from the remaining K − 1 imim-ages of each subject. After the subtraction, the remaining matrices of each class are orthogonalized by using Gram-Schmidt Orthogonalization. The orthogonalized matrices are orthonor-malized by dividing each matrix to its frobenius norm. These orthonororthonor-malized matrices span the difference subspace of the corresponding class. Let Bc
i denote
the orthonormal basis matrices belonging to class c where i = 1, 2, ..., K − 1 and
c = 1, 2, ..., C. Any image matrix yc
i belonging to class c can be projected onto
the corresponding different subspaces in order to calculate difference matrices. The difference matrices are determined as follows:
yc dif f,i= K−1X s=1 hyc i, Bsci Bsc (2.12)
Next, common matrices are calculated for each image class:
ycomc = yic− ydif f,ic (2.13) In the test part of the CMA algorithm, test image T is projected onto the dif-ference subspaces of each class then the projection is subtracted from the test
image matrix. D1 = T − K−1P s=1 hT, B1 si Bs1 D2 = T − K−1P s=1 hT, B2 si Bs2 . . DC = T − K−1P s=1 T, BC s ® BC s (2.14)
The test image T is assigned to class c for which the distance kDc− ycomc k2 is
minimum.
Multi-Class Support Vector Machine (SVM)
SVM, developed by Vladimir Vapnik, is a supervised machine learning method based on the statistical learning theory [50]. The method constructs a hyper-plane or a set of hyperhyper-planes in a high dimensional space that can be used in classification tasks. In this work, SVM with a multi-class classification sup-port, namely C-SVC [26] with RBF kernel is used. The multi-class SVM uses “one-against-one” strategy [51]. In the experiments, SVM parameters are set as “cost = 1000, gamma = 0.008”, after performing a cross validation process.
2D cepstral domain feature matrices are converted to vectors in a raster scan approach before training and classification. The raster scan starts with ˆym(0, 0).
If there are pixel intensity variations, ˆym(0, 0) is ignored and the scan starts from
ˆ
ym(0, 1).
2.5.2
Procedure
In order to compare performances of various features, original image pixel ma-trices, 2D PCA based features, 2D PCA of illumination compensated images,
Fourier LDA, Fourier-Mellin transform and proposed cepstrum based features are applied to CMA and multi-class SVM as inputs.
For the purpose of achieving robustness in recognition results, leave-one-out procedure is used. Recall that, K denotes number of poses for each person in a database. In the test part of the classifier, one pose of each person is used for testing. Remaining K − 1 poses for each person are used in the training part of the classifier. In the leave-one-out procedure, the test pose is changed in each turn and the algorithm is trained with the new K − 1 images. At the end, a final recognition rate is obtained by averaging the recognition rates for each selection of the test pose.
Due to the invariance of 2D mel-cepstral features to pixel amplitude changes, the 2D mel-cepstrum can cope with large illumination changes in a dataset. In order to observe the mel-cepstral feature’s robustness to illumination variations, a second experiment was carried out. An illumination compensation algorithm (LogAbout method [27]) is implemented and used as a preprocessing step before extracting features using 2D PCA. The illumination compensated image samples of each database are displayed in Figures 2.13, 2.14, 2.15 and 2.16 respectively.
Figure 2.13: Illumination compensated sample images for randomly selected sub-jects from AR face database.
Figure 2.14: Illumination compensated sample images for randomly selected sub-jects from ORL face database.
Figure 2.15: Illumination compensated sample images for randomly selected sub-jects from Yale face database.
Figure 2.16: Illumination compensated sample images for randomly selected sub-jects from FRGC version 2 face database.
Since proposed cepstral features are based on Fourier transform, the perfor-mance of these features are also compared with other Fourier transform based methods such as Fourier LDA [28] and Fourier-Mellin transform [29]. Fourier LDA approach was proposed to select appropriate frequency bands for image representation by using a two-dimensional separability judgment.
Fourier-Mellin transform (FMT) is a mathematical feature extraction tool which is used in some pattern recognition applications [45, 29]. The FMT is gen-erally implemented by performing a log-polar mapping followed by the Fourier transform (FT) [29]. The main idea behind this approach is to represent rota-tion and scaling as translarota-tions along some axes and to take advantage of the translation invariance property of the Fourier transform.
2.6
Experimental Results
In the extraction of the cepstral features, different non-uniform grids1 are used. Due to these different non-uniform grids, M × M 2D mel- and Mellin-cepstrum
features are generated in different dimensions (M=49, 39, 35, 29). These cepstral features are applied to CMA and SVM classifiers to obtain the non-uniform grid providing the best recognition results. The non-uniform grid and corresponding cepstral features giving the highest recognition rate are used in the comparison with actual image matrices, 2D PCA based features, 2D PCA of illumination compensated images, Fourier LDA and Fourier-Mellin transform based features. The cepstral features giving the best performance are stated with bold characters in Tables 2.1 and 2.2. In Table 2.1, the recognition rates obtained by applying different sized cepstral features to the CMA classifier, are presented.
Table 2.1: Recognition Rates (RR) that are obtained when cepstral features extracted using different Non-uniform Grids (NGs) are applied to CMA classifier.
Face Databases RR and Feature Sizes Cepstral Features
Proposed 2D mel-cepstrum Proposed 2D Mellin-cepstrum
NG1 NG2 NG3 NG4 NG1 NG2 NG3 NG4 AR RR 98.85% 99.00% 97.57% 97.00% 99.28% 99.14% 99.00% 98.57% Feature Size 25 × 49 20 × 39 18 × 35 15 × 29 49 × 49 39 × 39 35 × 35 29 × 29 ORL RR 98.61% 98.61% 99.44% 98.61% 98.88% 99.16% 99.44% 100% Feature Size 25 × 49 20 × 39 18 × 35 15 × 29 49 × 49 39 × 39 35 × 35 29 × 29 YALE RR 77.57% 77.57% 76.36% 75.15% 77.57% 77.57%% 77.57% 76.96% Feature Size 25 × 49 20 × 39 18 × 35 15 × 29 49 × 49 39 × 39 35 × 35 29 × 29 FRGC RR 96.34% 95.90% 95.23% 95.58% 96.75% 96.50% 96.43% 96.50% Feature Size 25 × 49 20 × 39 18 × 35 15 × 29 49 × 49 39 × 39 35 × 35 29 × 29
The 2D mel- and Mellin-cepstrum features are also classified by using multi-class SVM and recognition results are presented in Table 2.2.
Table 2.2: Recognition Rates (RR) that are obtained when cepstral features extracted using different Non-uniform Grids (NGs) are applied to multi-class SVM classifier. Face Databases RR and Feature Sizes Cepstral Features
Proposed 2D mel-cepstrum Proposed 2D Mellin-cepstrum
NG1 NG2 NG3 NG4 NG1 NG2 NG3 NG4 AR RR 98.71% 98.71% 98.71% 98.42% 98.71% 98.71% 98.85% 98.42% Feature Size 1225 780 6305 435 2401 1521 1225 841 ORL RR 98.05% 98.61% 98.61% 99.16% 98.05% 98.88% 98.88% 99.44% Feature Size 1225 780 6305 435 2401 1521 1225 841 YALE RR 98.18% 96.96% 96.96% 96.96% 95.75% 96.96% 95.75% 95.15% Feature Size 1225 780 6305 435 2401 1521 1225 841 FRGC RR 96.18% 95.58% 96.18% 93.80% 93.67% 94.87% 96.18% 94.63% Feature Size 1225 780 6305 435 2401 1521 1225 841
Based on the recognition rates presented in Tables 2.1 and 2.2, Non-uniform Grid 2 provides better representative features for the 2D mel-cepstrum technique in AR Face database. 2D Mellin-cepstrum features extracted using Non-uniform Grids 1 and 3 perform better than other Mellin-Cepstrum features in AR face database. In ORL database, Non-uniform Grids 3 and 4 provide best perfor-mance in both cepstral methods. In Yale face database, cepstral features ex-tracted using Grid 2 provide better performance than other non-uniform grids. Non-uniform Grid 1 provides higher recognition rates in 2D mel- and Mellin-cepstrum when FRGC version 2 database is used.
The performance of actual image pixel matrices, 2D PCA based feature ma-trices, 2D PCA with illumination correction, Fourier LDA, Fourier-Mellin and 2D mel-cepstrum based feature matrices are tested by applying these matrices to the classifiers. The recognition rates obtained by applying feature matrices to CMA are displayed in Table 2.3. Table 2.4 contains recognition rates obtained by converting various types of feature matrices into vectors and applying them to the multi-class SVM classifier.
Table 2.3: Recognition Rates (RR) of CMA classifier with different databases and feature sets. IC stands for Illumination Compensation.
Face Databases RR and Feature Sizes Features Raw Images 2D PCA 2D PCA with IC Fourier LDA 2D FMT Proposed 2D Mel-Cepstrum Proposed 2D Mellin-Cepstrum AR RR 97.42% 97.71% 98.00% 97.42% 98.28% 99.00% 99.28% Feature Size 100 × 85 100 × 12 100 × 12 100 × 10 60 × 60 20 × 39 49 × 49 ORL RR 98.33% 98.33% 99.16% 98.88% 98.61% 99.44% 100.00% Feature Size 112 × 92 112 × 15 112 × 15 112 × 10 60 × 60 18 × 35 29 × 29 YALE RR 71.52% 71.52% 73.33% 73.33% 73.33% 77.57% 77.57% Feature Size 152 × 126 152 × 9 152 × 9 152 × 10 60 × 60 20 × 39 35 × 35 FRGC RR 92.58% 93.22% 93.75% 93.82% 93.80% 96.34% 96.75% Feature Size 50 × 50 50 × 6 50 × 6 50 × 10 60 × 60 25 × 49 49 × 49
Table 2.4: Recognition Rates (RR) of multi-class SVM classifier with different databases and feature sets. IC stands for Illumination Compensation.
Face Databases RR and Feature Sizes Features Raw Images 2D PCA 2D PCA with IC Fourier LDA 2D FMT Proposed 2D Mel-Cepstrum Proposed 2D Mellin-Cepstrum AR RR 96.85% 96.85% 97.28% 97.42% 97.85% 98.71% 98.85% Feature Size 8500 1200 1200 1000 3600 780 1225 ORL RR 98.05% 98.33% 98.88% 98.88% 98.61% 99.16% 99.44% Feature Size 10304 1680 1680 1120 3600 435 841 YALE RR 88.00% 87.87% 89.09% 88.00% 90.90% 98.18% 96.96% Feature Size 19152 1368 1368 1520 3600 1225 1521 FRGC RR 93.22% 93.67% 93.75% 94.63% 93.80% 96.18% 96.18% Feature Size 2500 300 300 500 3600 1225 1225
Based on the experimental results listed in Tables 2.3 and 2.4, raw image matrices and 2D PCA, 2D FMT, Fourier LDA based features do not provide better results than the proposed 2D cepstral features. Moreover, the 2D mel-and Mellin-cepstrum methods are computationally efficient algorithms.
Fourier LDA feature extraction method consists of Fourier transform, linear separability judgment including the calculation of between and within class scat-ter matrices, eigenvalue-eigenvector decomposition and linear matrix transforma-tion. Therefore, the computational complexity of this algorithm is significantly more than the computational complexity of proposed cepstral features.
The cost of computing a 2D mel-cepstrum sequence for an N × N image is O(N2log(N) + M2log(M)) and an additional M2/2 logarithm computations which can be implemented using a look-up table.
Recall that, K denotes the number of poses for each person in a database. The computational cost of 2D PCA for a P × Q image (N > (P, Q) > M) is (P2Q)K +P3+SP2 where S denotes the number of eigenvectors that correspond to largest eigenvalues in order to construct linear transformation matrix. It can be observed from the computations that the cost of 2DPCA is clearly much more than 2D mel-cepstral features.
Another advantage of 2D cepstral features is their invariance to illumina-tion variaillumina-tions. Even 2DPCA of illuminaillumina-tion compensated (LogAbout method) images cannot perform better than the proposed 2D cepstral features in image representation and elimination of illumination changes.
In the literature, Liao et. al proposed a technique based on salient region extraction and gradient orientation [52]. It is reported that a face verification rate of 97.63% is obtained when “Experiment 1” image set of FRGC version 2 database is used [52]. This recognition rate is comparable to the recognition rates obtained in this thesis, but it is achieved at the expense of very high com-putational cost.
2.7
Summary
In this section, 2D cepstral feature extraction algorithms are proposed and used in facial feature extraction. The proposed cepstral features are compared with standard baseline feature extraction methods (2D PCA, Fourier LDA, Fourier-Mellin Transform) by classifying these features using CMA and multi-class SVM.
Experimental results point out that, 2D cepstral features outperform other clas-sical features both in recognition rate and computational complexity.
2D mel- and Mellin-cepstral features provide illumination invariant features due to logarithm operator in their calculations. Also, they are independent of translational shifts since these features are Fourier transform based features. Moreover, 2D mel-cepstrum features have symmetry property with respect to ˆ
y[n1, n2] = ˆy[−n1, −n2]. In addition to these, 2D Mellin-cepstrum method takes the advantage of Mellin Transform and provides rotational invariant features. The work presented in this chapter is published in [53, 54, 55].
Chapter 3
Feature Extraction from SAR
Images using Cepstral Methods
In this chapter, 2D mel- and Mellin-cepstrum are used for feature extraction from SAR images for target detection. The extracted features are classified by using an SVM classifier described.
In the literature, many SAR Automatic Target Recognition (ATR) algorithms have been developed [56, 57, 58, 59]. A general ATR system consists of five stages as shown in the Figure 3.1.
Figure 3.1: Stages of a typical SAR ATR system (Reprinted from [1]).
The proposed 2D cepstrum based methods can be used in the detection and discrimination stages of a classical ATR system as feature extraction techniques. Target detection and discrimination stages hold an important role in the perfor-mance of ATR systems.
SAR images used in this chapter are obtained from MSTAR (Moving and Stationary Target Recognition) database which is the only publicly available SAR image database. The images obtained from MSTAR database are divided into training and test subsets. The system matches the test feature to target or clutter by using SVM classifier with RBF kernel. The simulation results of cepstral features are compared with a regional covariance and codifference based methods that are used in target detection problem [1].
The proposed cepstral feature extraction methods provide illumination, trans-lation and rotation invariant features. Due to these properties cepstral features can be used in various applications including target detection. Promising tar-get detection accuracies and false alarm rates are obtained using the proposed cepstral features in experimental simulations. The experimental simulations are carried out in MATLAB R2009b computational environment.
The following sections of this chapter are organized as follows. In Section 3.1, related works on SAR image feature extraction are presented. The cepstral fea-ture extraction algorithms defined in Sections 2.2 and 2.3 are revisited in Sec-tion 3.2. The MSTAR SAR image database and its contents are briefly explained in Section 3.3. Target detection strategy and the classifier used in detection task are described in Section 3.4. Finally, experimental results are presented at the end of this chapter.
3.1
Related Work on SAR Image Feature
Ex-traction
SAR image feature extraction is the most important part of the target detection and discrimination stages of a classical ATR system due to its importance in increasing the ATR system’s performance.
Many feature extraction algorithms have been developed in order to extract features from SAR images [60, 61, 62, 63]. Qiu et al. compare the performance of PCA and 2D-PCA in target classification in SAR images [61]. Lu et al. pro-pose a mixed PCA/ICA method that forms a mixed subspace in order to extract features from SAR images [64]. The proposed mixed method achieves slightly better recognition results compared to the results obtained by PCA and ICA. Sun et al. extract linear features by modifying ROA (Ratio-Of-Averages) al-gorithm with improved Hough transform [65]. The modified ROA alal-gorithm detects majority of the linear features successfully and eliminates the noise and fake edges. Fu and Lv propose invariant moment based SAR image feature ex-traction technique [15]. The wavelet transform and fractal features are combined in order to be used in target detection in SAR images [66, 67]. Yuan et al. inves-tigate the multiresolution framework for target detection in wavelet domain [68]. Matzner et al. propose a feature extraction scheme for SAR images in frequency domain [69]. Amein et al. develop a new version of the Chirp Scaling Algo-rithm (CSA) using fractional Fourier transform [70]. Fourier-Mellin invariant (FMI) descriptor, a Fourier transform based method, is also used in SAR image registration [71]. Due to the rotation and translation invariance properties of Fourier-Mellin transform, the FMI descriptors produce more exact and precise registration than classical techniques.
3.2
SAR Image Feature Extraction Using
Cep-stral Methods
In this chapter, feature extraction from SAR images is performed by using pro-posed 2D mel- and Mellin-cepstrum methods described in Sections 2.2 and 2.3. The extracted feature matrices are converted into vectors and applied to the SVM classifier.
The 2D mel-cepstrum based features are illumination invariant due to the logarithm term in their computation. They are also symmetric features because of the IDFT. Since the 2D mel-cepstrum is Fourier Transform based method, it is also independent of translational shifts.
The 2D Mellin-cepstrum based features are also invariant to illumination and translation. In addition, these features are rotational invariant due to the log-polar conversion in their calculation. Rotation invariant 2D Mellin-cepstrum method can be successfully used in the feature extraction from SAR images, since SAR images include significant rotational differences.
3.3
SAR Image Database
In this chapter, MSTAR (Moving and Stationary Target Recognition) database, including SAR images captured by a sensor (Twin Otter SAR sensor) operating at 10 GHz (X band), is used in the experimental simulations. Twin Otter SAR sensor is carried by DHC-6 Twin Otter aircraft (displayed in Figure 3.2), and the SAR data is collected under the DARPA (Defense Advanced Research Projects Agency) MSTAR program via this aircraft.
The images have 0.3m x 0.3m resolution. All SAR images are acquired at angle of depressions of 15◦ and 17◦. Besides, target images are available in all
orientations in the database, i.e., the shots are made over 360◦ target aspect. In
this thesis, all images are treated in an equal manner and all target and clutter images are divided into training and test datasets.
The MSTAR database includes target and clutter images. Target image sub-set contains images of armored personnel carriers (BMP-2, BTR 70) and main battle tank (T-72). The clutter image subset consists of non-target objects such as open fields, forests, farms, roads, building and structures. The target images are provided in 128 × 128 pixels. The original clutter images are 1476 × 1784 sized images. Therefore the 128 × 128 clutter images are randomly cropped from the original clutter images. Sample images of 128×128 target and clutter images are displayed in Figure 3.3.
(a) Sample target images.
(b) Sample clutter images.
3.4
Target Detection Strategy
As mentioned earlier, cepstral features of target/clutter training and test images are extracted using the proposed cepstral methods and these features are classi-fied by SVM. The flow diagram of the target detection strategy is illustrated in Figure 3.4.
Figure 3.4: The flow diagram of the target detection strategy.
First, the MSTAR database is divided into subsets as training and test images. Then feature vectors of images are calculated using cepstral feature extraction methods. These feature vectors are applied to the SVM classifier and SVM, as a decision maker, assigns the test image as target or clutter.
As mentioned in Section 2.2, 2D mel-cepstrum features matrices have sym-metry property. Therefore, there is no need to use the entire 2D mel-cepstrum feature matrix. Instead, one half of the feature matrix is used.
3.4.1
Classifier
In the experimental work of this chapter, SVM classifier described in Section 2.5.1 is used. The SVM parameters are selected after a cross validation process. The cepstral features are also applied to SVM with a polynomial kernel, but poly-nomial kernel performs inferior to RBF kernel. False alarm rate of the system significantly increases if SVM with polynomial kernel is used. Therefore, the simulation results belonging to polynomial kernel is not included in Section 3.5. The MSTAR database is divided into two main sub-categories as training and test. SAR images belonging to training set are used in order to train the SVM and extract the SVM model. Once the SVM model is obtained, there is no need to re-train the SVM unless new training images are added to the training subset. The SVM model is the decision mechanism which decides whether the test image is target or clutter.
3.5
Experimental Results
MSTAR SAR image database is used in experimental studies and image feature extraction is carried out using the proposed cepstral methods. The features extracted from the cepstral methods are converted into vectors and applied to the SVM with RBF kernel. Simulations are repeated with SVM with Polynomial kernel but the false alarm rate dramatically increases. Therefore, the results obtained using SVM with polynomial kernel are not presented in this section.
In the experimental simulations of this chapter, the MSTAR database is di-vided into two subsets (training and test). Training image subset consists of 132 target and 132 clutter images, and test image subset consists of 2627 target and 13346 clutter images. The ratio between the sizes of test and training image set is approximately 20:1 for target images, and 100:1 for clutter images. The high ratios examine the features’ robustness in the problem of target detection.
In Table 3.1, the target detection accuracies and false alarm rates of the proposed cepstral features calculated using different non-uniform grids are listed. The SVM with RBF kernel is used in the simulations.
Table 3.1: The target detection accuracies and false alarm rates obtained with dif-ferent Non-uniform Grids used in the calculation of 2D mel- and Mellin-cepstrum features. NG: Non-uniform Grid.
Simulation results of 2D mel-ceptrum based features Simulation results Non-uniform grids Detection and false
alarm rates NG1 NG2 NG3 NG4
Target detection
accuracies 26192627 (99.69%) 26252627 (99.92%) 26242627 (99.88%) 26242627 (99.88%)
False alarm rates 2590
13346 (19.40%) 2008 13346 (15.04%) 1176 13346 (8.81%) 1071 13346 (8.02%)
Simulation results of 2D Mellin-ceptrum based features Simulation results Non-uniform grids Detection and false
alarm rates NG1 NG2 NG3 NG4 Target detection accuracies 25962627 (98.82%) 2602 2627 (99.04%) 2611 2627 (99.39%) 2612 2627 (99.42%)
False alarm rates 67
13346 (0.5%) 1334620 (0.15%) 133464 (0.03%) 1334611 (0.08%)
According to the results listed in Table 3.1, 2D Mellin-cepstrum outperforms 2D mel-cepstrum based features. Although target detection accuracy obtained
using 2D mel-cepstrum is slightly higher than the detection accuracy obtained using 2D Mellin-cepstrum, mel-cepstrum method has far too many false alarms. Since MSTAR database includes SAR images having rotational variations, 2D mel-cepstrum features cannot cope with these rotational changes and this causes too many false alarms. 2D Mellin-cepstrum features, including log-polar conversion in their calculation, can cope with such rotational changes. Therefore 2D Mellin-cepstrum method can be used in target recognition tasks.
The detection results of cepstral features are compared with region covariance and codifference matrix based methods presented in [1]. The results obtained using region covariance matrix, codifference matrix and SVM classifier are given in Table 3.2.
Table 3.2: The target detection accuracies and false alarm rates obtained using region covariance and region codifference methods with SVM classifier. The results are adopted from [1].
Simulation results of Region Covariance and Codifference based features
Simulation results Region Covariance Method Region Codifference Method
Target detection accuracies 2617 2627 (99.62%) 2626 2627 (99.96%)
False alarm rates 6
13346 (0.05%) 133461 (0.007%)
Based on the simulation results presented above, 2D Mellin-cepstral features can be used in feature extraction from SAR images for target detection. Al-though covariance based methods are quite successful in these tasks, an alter-native solution to SAR image feature extraction is provided by using cepstral
methods. Moreover, proposed cepstral features can cope with large illumination changes due to the logarithm operator in their structures. Therefore, the pro-posed cepstral features may outperform covariance based methods, if the SAR image dataset includes large illumination variations.
3.6
Summary
In this chapter, the proposed 2D mel- and Mellin-cepstrum methods are used in the feature extraction from SAR images for target detection task. The fea-ture matrices obtained from these techniques are converted into feafea-ture vectors and applied to the well-known SVM classification engine. The SVM used in experimental simulations has RBF kernel and its parameters are set using a cross-validation process.
MSTAR database, the only publicly available dataset, is used in the experi-mental studies. The SAR data in MSTAR database is divided into two subsets as training and test. Training subset is used in the learning of SVM model and the test images are assigned to the target or clutter classes by using this trained model.
Experimental results indicate that, proposed 2D Mellin cepstrum feature ex-traction algorithms can also be used in target detection using SAR images. The 2D Mellin-cepstrum feature extraction technique provides illumination, transla-tion and rotatransla-tion invariant features. Due to these merits, it eliminates amplitude and rotational variations in SAR images. Therefore 2D Mellin-cepstrum feature extraction method can be used in such target detection tasks. Since 2D mel-cepstrum cannot cope with rotational variations in a dataset, it produces too many false alarms and is not appropriate for feature extraction from SAR im-ages.
Chapter 4
Conclusion
In this thesis, cepstral feature extraction techniques are proposed and these tech-niques are used to extract features from images in face recognition and target detection tasks in SAR images.
Cepstral methods include non-uniform grid and weighting operations in the Fourier domain. The non-uniform grids consist of bins that are larger in high fre-quencies compared to low frefre-quencies. In the calculation of the cepstral features, energy of each bin is calculated. In this way, the coefficients in each bin are com-bined to represent each bin with a single value. That is how the dimensionality reduction is achieved.
The proposed feature extraction techniques are based on Fourier transform. Therefore, the features extracted using these techniques are independent of trans-lational shifts. The cepstral methods also include the logarithm operator in their calculations. Due to the fundamental properties of the logarithm operator, the features extracted using the cepstral methods are invariant to amplitude (gray-scale) changes. In addition, 2D mel-cepstrum method generates symmetric fea-tures. Therefore, only half of these feature matrices are sufficient to represent an image. The symmetric structure of the 2D mel-cepstrum based features enables
further dimensionality reduction. Different from the 2D mel-cepstrum method, the 2D Mellin-cepstrum feature extraction technique contains log-polar conver-sion process. The log-polar converconver-sion process introduces rotational invariance to the feature extraction scheme. Thus, the features extracted using 2D Mellin-cepstrum are rotation invariant.
In the thesis, the cepstral methods are first used in the feature extraction of facial images for face recognition. The features extracted using the proposed techniques are classified by CMA and multi-class SVM. The experimental simu-lations are carried out using AR, ORL, Yale and FRGC version 2 face databases. In the experiments, a cross validation algorithm, “leave-one-out” procedure, is performed to obtain robust results. The recognition rates obtained using the proposed cepstral techniques are compared with the rates obtained using well-known standard baseline methods such as PCA, Fourier LDA and FMT. The simulation results show that, the proposed feature extraction techniques out-perform these standard baselines. A second experiment is carried out in order to test the performance of the cepstral features in illumination invariance. In this experiment, the performances of the cepstral techniques are compared with illumination compensation process followed by PCA. The illumination compen-sation is performed by implementing LogAbout method [27] as a preprocessing stage before PCA. Experimental results show that, the recognition rates obtained using cepstral methods are still higher than the rates obtained using PCA with illumination compensation. The illumination invariance of the cepstral features are observed with this experiment.
The proposed cepstral feature extraction methods are also used in target detection task in SAR images. The feature matrices extracted from the cep-stral techniques are converted into vectors and applied to the SVM classifier. In the experimental simulations, MSTAR SAR image database is used. The
SAR images in MSTAR database contain rotational variations. Since 2D mel-cepstrum features are not rotation invariant features, the system using the 2D mel-cepstrum technique produces too many false alarms. The problem is solved using 2D Mellin-cepstrum technique in SAR image feature extraction. The 2D Mellin-cepstrum method eliminates rotational variations and produces satisfac-tory results. Experimental results point out that the cepstral feature extraction techniques can also be used in SAR image feature extraction. Although region covariance based techniques [1] are quite successful in SAR image feature extrac-tion, an alternative solution to this problem is provided.
In this thesis, 2D cepstrum based feature extraction techniques are proposed for facial and SAR image feature extraction. Experimental results indicate that the cepstral features may be used in various feature extraction problem including face recognition and target detection.
APPENDIX A
Non-uniform grids used in
Cepstral Computations
The 2D DFT of the image is rearranged (fftshift) to have low-frequency compo-nents at center and inner bins of the non-uniform grid. High-frequency coeffi-cients are located at the outer part of the DFT matrix. As can be observed from the Figures A.1, A.2, A.3 and A.4, cell sizes are smaller at low frequencies com-pared to high frequencies. In the following figures, the center of each non-uniform grid represents zero frequency and each line is located at a certain distance to the zero frequency. The locations of these lines are given as real numbers in each figure.
Figure A.1: 49 × 49 non-uniform grid used in the cepstral feature extraction techniques. The DFT size is 255 × 255.
The location of lines separating the non-uniform grid into bins be-longing to 49 × 49 non-uniform grid:
Location of horizontal lines [-127, -92, -66, -43, -32, -24, -18, -17, -16, -15, -14, -13, -12, -11, -10, -9, -8, -7, -6, -5, -4, -3, -2, -1, 0, 1, 2, 3, 4, 5, 6, 7, 8, 9, 10, 11, 12, 13, 14, 15, 16, 17, 18, 24, 32, 43, 66, 92, 127]
Location of vertical lines [-127, -92, -66, -43, -32, -24, -18, -17, -16, -15, -14, -13, -12, -11, -10, -9, -8, -7, -6, -5, -4, -3, -2, -1, 0, 1, 2, 3, 4, 5, 6, 7, 8, 9, 10, 11, 12, 13, 14, 15, 16, 17, 18, 24, 32, 43, 66, 92, 127]