FINANCIAL PERFORMANCE OF THE TURKISH TEXTILE & READY TO WEAR INDUSTRY
FOR THE PERIOD BETWEEN 1986-1994
by
DiDEM GÜQBiLMEZ
A Thesis
Submitted to the Department of Management And the Graduate School of Business Administration
in partial fulfillment of the requirements for the degree of Master of Business Administration
Bilkent University January, 1996
H L.)
a« 6
I certify that I have read this thesis and in my opinion it is fully adequate, in scope and quality, as a thesis for the degree of Master of Business Administration.
Assoc. Prof. Can §imga Mugan
\
I certify that I have read this thesis and in my opinion it is fully adequate, in scope and quality, as a thesis for the degree of Master of Business Administration.
Assoc. Prof. Kür§at Aydogan
I certify that I have read this thesis and in my opinion it is fully adequate, in scope and quality, as a thesis for the degree of Master of Business Administration.
Assoc. Prof. GCilnur Muradoglu,
' \ ^
/1
/ /Approved for the Graduate School of Business Administration.
FINANCIAL PERFORMANCE OF THE TURKISH TEXTILE & READY TO WEAR INDUSTRY
FOR THE PERIOD BETWEEN 1986-1994 Didem Gu^bilmez
MBA
Supervisor: Assoc. Prof.Can §imga Mugan February 1996, 65 PAGES
A B S T R A C T
The Textile & Ready to Wear Industry, with its share of 31.8% among all Turkish Consumption Goods Production and approximately 40% of share among all Turkish Exports clearly plays an important role in the overall Turkish Economy. Therefore the financial performance of such an important industry is worth investigation. Apart from the total industry, analyzing the financial performance of the sectors within the industry is as important in order to understand sector differences.
The aim of this study is to analyze the financial performance of the Turkish Textile and Ready to Wear Industry and compare the financial performances of the Textile and Ready to Wear Sectors within the industry for the period between 1986 and 1994. The method that will be used is Ratio Analysis based on four criteria which are leverage, liquidity, profitability and market value.
Key Words; Textile & Ready to Wear Industry, Textile Sector, Ready to Wear Sector, Ratio Analysis, Leverage, Liquidity, Profitability, Market V alue..
ÖZET
TÜRK TEKSTİL VE KONFEKSİYON ENDÜSTRİSİ’NİN 1986 İLE 1994 YILLARI
ARASINDAKİ MALİ PERFORMANSI Didem Güçbilmez
Yüksek Lisans Tezi
Tez Yöneticisi; Doç. Dr. Can Şımga Muğan Şubat 1996, 65 SAYFA
Türk Tekstil ve Konfeksiyon Endüstrisi, toplam Türk Tüketim Malları
Üretimi içindeki % 31.8 ‘lik payı ve tüm Türkiye İhracatı içindeki % 40 ‘a yakın payı ile Türkiye Ekonomisinde önemli bir rol oynamaktadır. Bundan dolayı, böyle büyük bir endüstri’nin mali performasının incelenmesi önemlidir. Endüstrinin tümünden ayrı olarak, endüstri içindeki sektörlerin mali
performanslarını da incelemek, sektör farklılıklarını anlamak açısından önem taşımaktadır.
Bu çalışmanın amacı, Türk Tekstil ve Konfeksiyon Endüstrisinin mali performansını ve endüstri içerisinde yer alan tekstil ve konfeksiyon
sektörlerinin karşılaştırmalı olarak mali performanslarını 1986 ile 1994 yılları arasındaki dönem için incelemektir. Kullanılacak metod rasyo analizi olup kaldıraç, likidite, karlılık ve piyasa değeri kriterleri baz alınacaktır.
Anahtar Kelimeler; Tekstil ve Konfeksiyon Endüstrisi, Tekstil Sektörü, Konfeksiyon Sektörü, Rasyo Analizi, Kaldıraç, Likidite, Karlılık, Piyasa Değeri.
ACKNOWLEDGEMENT
This study is conducted under the supen/ision of Assoc. Prof. Can Şımga Mugan to whom I wish to express my deep gratitude for her invaluable guidance and productive criticisms throughout the completion of this master thesis.
I would like to express my thanks to Assoc. Prof. Kürşat Aydogan and Assoc. Prof. GCilnur Muradoğlu for serving on my thesis commitee. I also would like to thank them for their suggestions and corrections.
Finally, I am sincerely grateful to my family, my aunt Ferda Kıratlı, my friend Emrah Hadi Tercan and all my other friends who helped me in my thesis, the employees of the Capital Markets Board who helped me in my thesis and my managers and friends at Citibank for their help and encouragement for the completion of this thesis.
TABLE OF CONTENTS
Page ABSTRACT
ÖZET
ACKNOWLEDGEMENT
I. PURPOSE OF THE STUDY
II. THE TEXTILE & READY TO WEAR INDUSTRY 2.1. Production and Cost of Production
2.2. Exports 2. 3. Imports 1 3 3 5
III. FINANCIAL STATEMENT ANALYSIS 3.1. Financial Ratio Analysis
3.2. Credit Granting and Investment Decisions 3.3. Measures for Comparing Financial Ratios IV. METHODOLOGY
4.1. Data Collection 4.1.1. Source of Data
4.1.2. Method of Data Compilation 4.2. Analyzing the Data
7 7 9 10 12 12 12 14 16
V. PRESENTATION, ANALYSIS AND RESULTS
5.1. Financial Performance of the industry as a Whole 5.2. The Textile and Ready to Wear Sectors
5.2.1. Characteristics of Firms that Operate within the Sectors 5.2.2. Financial Performance 17 17 24 25 27
VI. CONCLUSION 34 6.1. Financial Performance if the Industry and the Sectors within
6. 1. 1. Leverage 6 .1 .2 . Liquidity 6 .1 .3 . Profitability 6 .1 .4 . Market Value
6. 2. Implications for Creditors and Investors REFERENCES
APPENDICES Appendix A
Imports and Exports of the Industry for the January - April Period of 1993, 1994 and 1995
Appendix B
Ratios Used in the Study Appendix C
Equal Weighted Mean Ratio Calculations for the Industry as a Whole Appendix D
Equal Weighted Mean Ratio and Variability Measure Calculations for the Textile and Ready to Wear Sectors
Appendix E
Graphs of Equal Weighted Mean Ratios for the Industry a Whole
34 35 35 36 37 39 40 41 42 51 60
LIST OF TABLES
Page
1. Growth in Turkish Textile and Ready to Wear Production 4
2. Walsh’s Categorization of Mostly Used Ratios 8
3. Gibson’s Categorization of Mostly Cited Ratios 9
4. Equal Weighted Mean Ratios and Variance Measures 18
for the Industry as a Whole
5. The Price - Earnings and Dividend Yield Market Averages & the 23
Textile & Ready to Wear Industry Price - Earnings and Dividend Yield Ratios for the period between 1986 and 1994.
6. Equal Weighted Mean Ratios and Variance Measures 28
for the Textile and the Ready to Wear Sectors
7. The Price - Earnings and Dividend Yield Market Averages & the 32
Textile & Ready to Wear Sectors' Price - Earnings and Dividend Yield Ratios for the period between 1990 and 1994.
The Turkish Textile & Ready to Wear Industry has a share of 31.8% among the Total Turkish Consumption Goods’ production, and 8.4% among the Total Turkish production. The industry also has a large share among the Total Turkish Exports, which is approximately 40% (Ertug, 1994, p.152). Based on these numbers, it is clear that the Turkish Textile & Ready to Wear Industry has a very important place in the Turkish Economy which is worth investigating.
The purpose of this study is to analyze and understand the financial performance of the Turkish Textile & Ready to Wear Industry and the sectors that operate within the industry, i.e. the Textile and Ready to Wear Sectors, during the period of 1986 to
1994. In the analysis four criteria will be used. These are( Brealey & Myers, 1991,pp. 675- 684):
1. Leverage which shows how heavily the industry uses debt as its financing. 2. Liquidity which measures how easily the industry can lay its hands on cash. 3. Profitability which shows how efficiently the industry is using its assets.
4. Market Value which shows how highly the industry is valued by investors and the chances of foreign investment
CHAPTER I. PURPOSE OF THE STUDY
The analysis will benefit Creditors in terms of understanding the credibility of the industry in credit granting decisions , and benefit Turkish and Foreign Investors in understanding the market value of the industry and in making investment decisions.
In the second chapter information about the Turkish Text.le & Ready to Wear Industry and its developments are summarized. In the third chapter information about the techniques that are used for this study are provided. Chapter four
presents the methodology followed in the study. In the fifth chapter the presentation, analysis and results of the study are provided. Finally, conclusion is provided in the last chapter.
The Turkish Textile & Ready to Wear Industry, which plays an important role in the Turk'Sh economy has gone through some major developments over the years. The Industry will be explained under the headings of;
-Production & Cost of Production -Exports
-Imports
The data source for the information in this section is the Istanbul Hazır Giyim ve Konfeksiyon İhracatçıları Birliği (İTKİP), which has used the data of the Statistics Institute of Turkey. The numbers provided are based on 1988 constant prices (TL/$=1420) (Ertug, 1994, p.127).
2 . 1 . Production and Cost of Production
CHAPTER II. THE TURKISH TEXTILE & READY TO WEAR INDUSTRY
The Turkish Textile & Ready to Wear Industry constitutes 31.8% of the Total Turkish Consumption Goods' production and 8.4% of the Total Turkish Production. It ranks as second among all Turkish production industries following the food industry, first (Ertug, 1994, p.152).
The textile sector production includes the production of all cotton thread, cotton wool and cotton cloth. The production of the ready to wear sector includes all ready to wear clothing and knitted goods (Ertug, 1994, p.152).
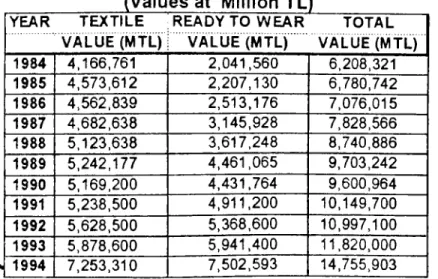
Table 1 below summarizes the growth in production over the years of 1984 to 1993 at 1988 constant prices (TL/$=1420) (Ertug, 1994, p.147):
(Table 1) Growth in Turkish Textile and Ready to Wear Production
YEAR TEXTILE READY TO WEAR TOTAL
VALUE (MTL):i VALUE (MTL) VALUE (MTL)
1984 4,166,761 2,041,560 6,208,321 1985 4,573,612 2,207,130 6,780,742 1986 4,562,839 2,513,176 7,076,015 1987 4,682,638 3,145,928 7,828,566 1988 5,123,638 3,617,248 8,740,886 1989 5,242,177 4,461,065 9,703,242 1990 5,169,200 4,431,764 9,600,964 1991 5,238,500 4,911,200 10,149,700 1992 5,628,500 5,368,600 10,997,100 1993 5,878,600 5,941,400 11,820,000 1994 7,253,310 7,502,593 14,755,903
* The figures for 1994 are the planned amounts in the last 5 years’ development plan.
From table 1 it is clear that although the production for both of the sectors has increased during the years, the production of the ready to wear sector has increased at a higher rate than the textile sector. Although the total ready to wear production has increased by 163% over the period of 1984 to 1993, the total textile production has only increased by 35.1% for the same period. The major reasons for the slower growth in the textile production can be summarized as high costs of production, decrease in productivity and inefficient use of capacity. On average the yearly growth in the Textile & Ready to Wear Production has been 8.7% for the period of 1984 to 1993.
The cost of production for the textile sector is higher than that of the the ready to wear sector. Based on 1991 average figures the cost of production for the textile sector is 3.12 $ per hour, whereas it is 2.31$ per hour for the ready to wear sector in the same year. Turkey ranks 30th in textile cost of production, whereas it ranks 28th in ready to wear cost of production among all world countries (Ertug, 1994, pp. 238- 248).
2 . 2 . Exports
The export activities of the Turkish Textile & Ready to Wear Industry has started with the export of cotton wool during the 1970's. During the beginning of 1980's Turkey has become the number one cotton wool exporter country to the European Community (Ertug, 1994, p. 155). After 1984, the exports of the ready to wear sector have increased at a high rate whereas the exports of the textile sector have increased at a slower rate.
The exports of the Textile & Ready to Wear Industry can be summarized by the table in Appendix A. It is clear from the numbers that the exports of the Textile & Ready to Wear Industry make up approximately 40% of the 1995 January - April Total Turkish exports and that the exports of the Ready to Wear sector make up nearly 75% of the total industry’s exports for the same period. Also, the trend has been similar for the last three years. It is also clear that the European Community is the number one importer of our textile and ready to wear goods.
2 . 3 . Imports
While the exports of textile & ready to wear goods have increased during the 1980’s and 1990’s, the imports of the industry have also increased. Most of the imports consist of textile goods, i.e. cotton goods, the major reason being the high cost of producing textile goods (Ertug, 1994, p.178).
The imports of Textile & Ready to Wear Industry can be summarized by the table in Appendix A. It is clear from the table that the Turkish Textile & Ready to Wear Industry makes up 9% of the 1995 January - April Total Turkish Imports and that the Textile Industry makes up nearly 100% of the industry’s imports for the same
period. It is also clear again that most of our trade is performed with the European Community.
CHAPTER til. FINANCIAL STATEMENT ANALYSIS
3 . 1 . Financial Ratio Analysis
The major tool in Financial Statement Analysis is Ratio Analysis. In Financial Ratio Analysis on aims to evaluate the financial performance of the firm over time (time series analysis) or across firms (cross sectional analysis) (Martikainen, 1992). Financial ratios are usually classified as leverage, liquidity, profitability and market value ( See Appendix B). As stated before leverage shows how heavily the industry uses debt as its financing, liquidity measures how easily the industry can lay its hands on cash, profitability shows how efficiently the industry is using its assets and market value shows how highly the industry is valued by investors.
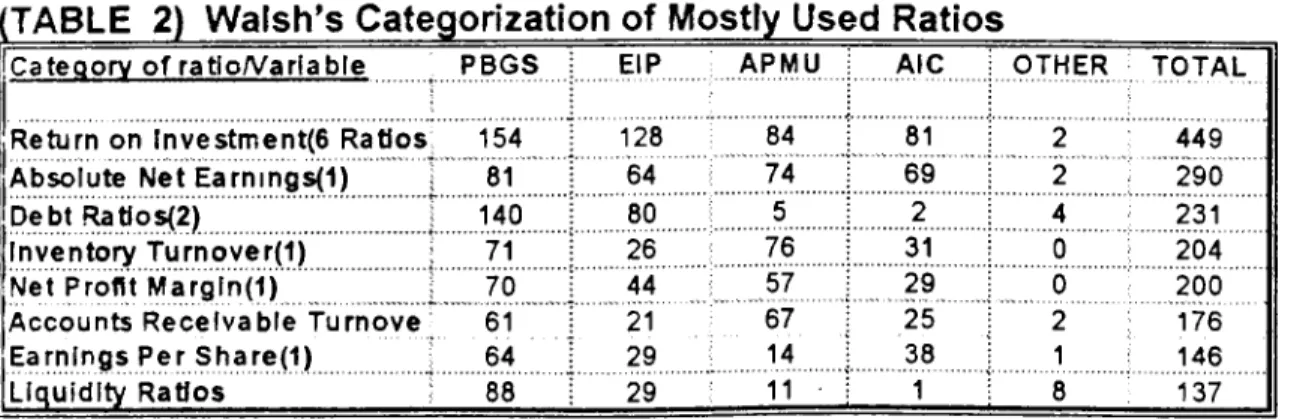
Several questionnaire based studies have examined the relative importance managerial respondents give to individual financial ratios and / or variables. A representative study is Walsh (1984), where " the primary purpose was to learn the preferences of a representative group of Chief Executive Officers and other S ^ io r Executives concerning the ratios and other financial indicators that they use
regularly for various types of decision making". Questionnaires were sent to the CEO's of 500 of the Fortune 1000 industrial companies and 50 firms in service industries. A total of 101 usable survey responses was received. Respondents were asked to note the "decision making activities" in which individual ratios were used. These activities were grouped into the following categories:
- Appraising Performance of Managers and Units (APMU) - Awarding Incentive Compensation(AIC)
- Other
Table 2 below summarizes a subset of the responses. Ratios relating to return on investment were the most frequently mentioned by the respondents. Walsh also concluded that based on " the number of times that each indicator was ranked first in importance, return on investment and absolute net earnings receive the most such mentions".
TABLE 2) Walsh^s Categorization of Mostly Used Ratios
C a t e a o r v o f r a t i o / V a r i a b l e P B G S EIP A P M U i A lC O T H E R T O T A L R e tu rn on I n v e s t m e n t ( 6 R a t i o s 154 128 84 81 2 4 4 9 A b s o lu t e N e t E a r n in g s ( 1 ) 81 64 74 69 2 2 9 0 D e b t R a tio s (2 ) 140 80 5 2 4 231 I n v e n t o r y T u r n o v e r ( 1 ) 71 26 76 31 0 2 0 4 N e t P ro fit M a r g i n ( 1 ) 70 44 57 29 0 2 0 0 A c c o u n t s R e c e i v a b l e T u r n o v e 61 21 67 25 2 176 E a r n in g s P e r S h a r e ( 1 ) 64 ... 29 14 1 38 1 146 L iq u id it y R a t i o s 88 29 11 · i 1 8 137
Gibson (1982a) surveyed the opinions of the controllers of companies listed in Fortune’s 500 firms. The conclusion was that controllers rated profitability ratios as the most significant:
Gibson (1982b) also made a study of the annual reports of 100 U.S. companies in the Fortune 500 listing of industrial firms. Using the financial ratio categories of liquidity, debt, and profitability, he reported that the ratios in Table 3 were most frequently c ite d :
(Table 3) Gibson’s Categorization of Mostly Cited Ratios Frecuency of Appearance jLiquidity Current Ratio 47 :Debt Ratios Debt to capital 23 ’ Debt to Equity 19 i Profitability 1 Return on equity 62 Profit Margin 58 ; Return on Capital 21
Gibson reported consistency in the way companies computed the current ratio but inconsistency in the other ratios cited. Foster is also concerned about similar issues and believes that different accounting policies may lead to the
noncomparison of financial ratios and that these differences should be taken into account while performing cross sectional or time series analysis (Foster, 1986, p. 184).
3 . 2 . Credit Granting and Investment Decisions
Credit Granting
Brealey and Myers (1991, p. 679) state that it is safer to lend to a company that has relatively little leverage and a predominance of liquid assets. They state that if you are extending credit or lending to a company, you are not interested only in the total asset coverage of debt. You want to know whether the company will be able to lay its hands on cash to repay you. That is why credit analysts and bankers look at several measures of leverage and liquidity.
Bareley and Myers (1991, p. 683) state that investors look at price-earnings ( P/E ) and dividend yield ratios in making investment decisions. The price-earnings ratio is a common measure of the esteem in which the company is held by investors. It is the stock price divided by the earnings per share. They state that if a
company's dividends are expected to grow at a steady rate, then a high P/E ratio might indicate that (1) investors expect high dividend grov/th; or (2) the stock has low risk and therefore the investors are content with a low prospective return; or (3) the company is expected to achieve average grovv^h while paying out a high proportion of earnings.
The stock's dividend yield is simply the expected dividend as a proportion of the stock price. In a company with a steady expected growth in dividends, a high yield may indicate that investors expect low dividend growth or that investors require high return.
3 . 3 . Measures for Comparing Financial Ratios
Foster describes several measures for comparing financial ratios. Two of these measures a re ;
1) Central Tendency(Foster, 1986, p.178);
A most widely used measure of central tendency is the Equal Weighted Mean (EWM), which is computed by adding the ratio of each firm and then dividing the total by the number of firms in the analysis.
2) Variability Measure ( Foster, 1986, p.72):
An approach that is gaining popularity in the literature is to compute variability measures for financial ratios over time. This is a ratio of standard deviation. It
shows the dispersion of a certain measure. It is computed by subtracting the minimum value in the data series from the maximum value and then dividing the result by the average of the data series.
CHAPTER IV. METHODOLOGY
4 . 1 . Data Collection
4 . 1 . 1 . Source of Data
The data for the analysis are obtained from all the Textile & Ready to Wear firms trading in the Istanbul Stock Exchange (ISEX) as of 31/12/1994. There are 17 firms in total.
All the audited balance sheets and income statements of the firms for the years ending 1986 through 1994 are obtained from the Turkish Capital Markets Board and the Istanbul Stock Exchange (1995). Only the audited financial
Statements are taken into consideration to maximize reliability and comparibility.
The beginning year for the study is taken as 1986 because firms were first quoted to the Istanbul Stock Exchange in this year.
The major limitation to this approach is that the number of data points for each year are not equal, as the firms in the analysis have been quoted on the ISEX at different years. Therefore their audits have started at different years. The firms, the year they have entered the analysis and the year they have been quoted to ISEX is given on the next page:
FIRM YEAR OF ENTERING ANALYSIS QUOTATION AT ISEX
Akal Tekstil Sanayii A.Ş.
Aksu Dokuma ve Boya Apre Fabrikaları A.Ş. Altınyıldız Mensucat ve Konfeksiyon Fab. A.Ş. Derimod Konfeksiyon Sanayii A.Ş.
Edip İplik Sanayii A.Ş.
Karsu Tekstil San. ve Tic. A.Ş.
Koniteks Konfeksiyon Endüstri ve Tic. A.Ş. Kordsa Kord Bezi San. ve Tic. A.Ş.
Köytaş Tekstil San. ve Tic. A.Ş. Lüks Kadife Tic. ve San. A.Ş. Okan Tekstil San. ve Tic. A.Ş. Polylen Sentetik iplik Sanayi A.Ş. Sifaş Sentetik İplik Fabrikaları A.Ş. Söksa Sinop örme ve Konfeksiyon
San. ve Tic. A.Ş. Sönmez Filament Sentetik İplik ve
Elyaf Sanayii A.Ş. Sönmez Pamuklu Sanayii A.Ş. Yünsa Yünlü San. ve Tic. A.Ş.
1986 1986 1986 1989 1989 1986 1990 1986 1986 1986 1989 1986 1986 1986 1989 1993 1989 1989 1993 1991 1991 1991 1994 1993 1986 1987 1991 1989 1986 1987 1990 1991 1994 1990
In order to analyze the financial performance of the textile industry 18
operating ratios are computed for each audited firm for each year. Overall there are 4 leverage ratios, 4 liquidity ratios, 7 profitability ratios, and 3 market value ratios analyzed. These ratios are presented in Appendix B.
Another limitation of the study is that it is not possible to get information about the accounting policies of the firms. The effect of this limitation is that if firms are using different accounting policies, we might be comparing ratios of different content which might bias the study.
4 .1 . 2. Method of Data Compilation
All the collected balance sheets and income statements are entered into a excel worksheet to calculate the data, i.e. the ratios of each company, that are the basis to the analysis. Because it is important to understand the trend of each ratio in order to analyze the profitability, liquidity, leverage, and the market performance of the
industry over the 1986-1994 period, the data are compiled in terms of each ratio, i.e. each firm and its relating ratio is listed under the ratio examined (See Appendix C and D)
In order to get a thorough understanding of the industry, two kinds of
compilations are performed. In the first one, all the firms are taken as one industry without looking at the sectors they operate in (Appendix C).
In the second one, the industry is dividec into two groups according to the sectors that the firms operate within the industry, i.e. the textile or ready to wear sectors (Appendix D). The tw^o sectors and the firms in each sector are listed below;
The Textile Sector:
Akal Tekstil Sanayii A Ş.
Aksu Dokuma ve Boya Apre Fabrikaları A.Ş. Edip iplik Sanayii A.Ş.
Karsu Tekstil San. ve Tie. A.Ş. Kordsa Kord Bezi San. ve Tie. A.Ş. Köytaş Tekstil San. ve Tie. A.Ş. Lüks Kadife Tie. ve San. A.Ş. Okan Tekstil San. ve Tie. A.Ş. Polylen Sentetik İplik Sanayi A.Ş. Sifaş Sentetik İplik Fabrikaları A.Ş.
Sönmez Filament Sentetik İplik ve Elyaf Sanayii A.Ş. Sönmez Pamuklu Sanayii A.Ş.
Yünsa Yünlü San. ve Tie. A.Ş.
The Ready to Wear Sector
Altinyildiz Mensucat ve Konfeksiyon Fab. A.Ş. Derimod Konfeksiyon Sanayii A.Ş.
Koniteks Konfeksiyon Endüstri ve Tlc. A.Ş.
Söksa Sinop Örme ve Konfeksiyon San. ve Tie. A.Ş.
İt is important to make such a classification in order to understand the sectors differences within the industry.
4 . 2 . Analyzing the Data
The proposed measures of Foster, i.e equal weighted mean ratios and variability measures are calculated for the compiled data mentioned in section 4.1.2. in order to make a time series and cross sectional analysis of the data (Foster, 1986, pp. 72 -178).
The stock market averages of the price-earnings and dividend yield ratios from 1989 to 1994 are obtained from the Istanbul stock exchange monthly bulletin in order to make a comparative study about the market value of the Textile and Ready to Wear Industry and the sectors within. Such a comparison will enable a much healthier analysis.
CHAPTER V. PRESENTATION, ANALYSIS AND RESULTS
In this chapter the ratios that will be the basis to the analysis of the leverage, liquidity, profitability and market performance of the Textile & Ready to Wear Industry and the sectors within are presented and analyzed.
The analysis is performed in two stages. Firstly, all the firms are included in the analysis. Secondly, the industry is divided into two groups based on the sector in which the firms operate, i.e. the Textile Sector and the Ready to Wear Sector.
5 . 1 . Financial Performance of the Whole Industry
The financial performance of the whole industry is analyzed under the following subsections using the Equal Weighted Mean Ratios and Variability Measures;
-Leverage -Liquidity -Profitability -Market Value
Table 4 shows the equal weighted mean ratios and variability measures used in the analysis. Appendix C presents the calculations of the equal weighted mean ratios and Appendix E presents the graphs of the equal weighted mean ratios.
(TABLE 4) EQUAL WEIGHTED AVERAG E RATIOS A 'JD VARIABIL TY MEASURES FOR THE INDUSTRY AS A WHOLE
EQUAL WEIGHTED AVERAGE 1986 1987 1988 ^ 1989 1990 1991 1992 1993 1994
LEVERAGE RATIOS
' 0U82 “ 0.290
Capitalization Ratio 0.274 0.232 0.155 0.222 0.288 0.247 0.207
Debt/Equity Ratio 2.267 1.564 1.606 1.653 1.394 2.714 1 1.412 1.300 0.973
Times Interest Earned Ratio 2.851 2.894 1.744 3.670 5.303 2.505 1 3.838 4.231 3.524
Short Term Liabilities/Total Liabilities 0.722 0.764 0.817 0.795 0.787 0.787 0.794 0.747 0.807
LIQUIDITY RATIOS
Current Ratio 1.848 1.795 1.640 1.523 1.796 1.572 1.578 1.741 1.776
Quick Ratio 1.141 1.161 1.055 0.867 1.089 0.948 1.001 0.996 0.885
Cash Ratio 0.179 0.203 0.090 0.107 0.282 0.137 0.188 0.188 0.255
Net Working Capital/Total assets 0.270 0.298 0.261 0.219 0.264 0.193 0.168 0.145 0.211
P r o f it a b il it y r a t io s
Sales to Total Assets - 1.392 1.487 1.102 1.327 1.410 1.557 1.384 1.789
Sales/Net Working Capital - 4.945. 5.395 4.295 5.787 5.456 8.283 6.372 5.779
Net Profit Margin 0.218 0.227 0.258 0.195 0.185 0.164 0.122 0.119 0.219
Inventory Turnover Ratio - 8.125 8.723 5.643 6.754 7.649 8.112 7.072 7.473
Average Collection Period - 115 117 67 81 98 82 73 52
Return on Assets - 0.305 0.372 0.204 0.253 0.229 0.217 0.179 0.375 Return on Equity - 0.796 0.962 0.536 0.714 0.771 0.731 0.692 0.793 Payout Ratio - - - 0.043 14.913 12.681 22 312 26.500 12 51.126 17 Number of Firms 10___ 10 10 15 11 11 11 MARKET VALUE I^ T IO S 14.956 Price-Earnings ratio 10.466 5.519 1.815 13.804 10.195 9.694 14.387 19.176
Dividend Yield Ratio - - - 0.050 0.073 0.026 0.063 0.027 0.085
Market to Book Value Ratio 1.235 1.921 0.671 1.921 1.467 1.896 0.919 2.634 1.822
17
The debt to equity ratio shows that until 1994 the industry is mostly financed by debt rather than equity. Debt financing is the highest in the years of 1986 and 1991 in which the ratios are above 2. In the rest of the years the ratio is usually between 1.3 and 1.6. After 1992 the share of debt has started to decrease, and in 1994 the share of debt and equity are almost equal with a ratio close to 1.
The short term liabilities to total liabilities ratio shows that during the period of 1986 and 1994 the debt structure of the industry is mostly short term debt. The ratio has been stable over the years at values between 0.7 and 0.8.
The low capitalization ratio between 1986 and 1994 is another indicator that long term debt is not a major long term financing tool. The ratio varying between 0.15 and 0.3 has been quite stable during the 1986 -1994 period.
A low 'times interest earned’ ratio shows that the industry is not generating much earnings in excess of its interest expenses and this has been the case for this industry as well. The ratio increased from 2.8 to 5 between 1986 and 1990, but has dropped to 3.5 in 1994 again. So, it can be stated that, in terms of generating excess earnings the industry has performed its best in 1990. It can also be stated that the cost of capital is very high during the period between 1986 and 1994 .
The variability measures of the leverage ratios show that these ratios have not widely fluctuated over the period, the most stable ratio being the short term liabilities to total liabilities ratio.
Liquidity:
The liquidity ratios have shown stability during the period between 1986 and 1994 with low variability measures The most volatile ratio has been the cash ratio but, because this ratio has been very low over the period, a variability measure of 1 is not relevant for the analysis.
During the same period the current ratio shows a steady trend with values
between 1.55 and 1.8 , meaning that the industry has enough current assets to meet its current liabilities. However, at this point it is important to look at the quick, cash and net working capital to total assets ratios.
During the same period the quick ratio is close to 1 and it has shown a steady trend. The cash ratio has also shown a steady trend with values between 0.1 and 0.25. So, it can be stated that the share of the most liquid current assets are less than the share of the less liquid current assets. This indicates that the current assets are composed mostly of inventories and receivables.
Although the current ratios of approximately 2 indicate that this is a liquid industry,
the quick and the cash ratios with low values indicate that there is still liquidity risk. Therefore it is important to analyze the receivables collection and the inventory turnover ratios of the industry, which will be dealt with under the profitability section.
The low net working capital to total assets ratio between 0.15 and 0.3 during the 1986 -1994 period is another indicator that the industry is not as liquid as the
Profitability;
The variability measures for the profitability ratios show that there have not been large fluctuations during the 1986 -1994 period. There have been only minor ups and downs except for the payout ratio. The payout ratio which has a variability measure of 3,607 during the period is explained below.
The Sales to Total Assets ratio has increased gradually from 1.1 to 1.5 between 1989 and 1992, slightly decreased to 1.4 in 1993 and reached its maximum in 1994 with a value of 1.7. The increase in the ratio from 1.1 to 1.7 is an indicator of grov^rth as prior investment activities are producing their returns.
Nevertheless, at this point it is required to look at net profit margin. Although the assets are efficiently generating sales, the net profit margin of the industry is low over the same period. The highest value is 0.258 in 1988. The reason for such a low profit margin is that the cost of goods sold, the cost of capital and other expenses for the industry are very high. However, during the 1986-1994 period, the profit margins have been positive indicating that the industry has never been in loss, although its costs are very high. The only firm that has been in loss is Soksa after 1991.
The inventory turnover ratio has decreased from 8.7 to 5.6 between 1986 and 1989. In 1994 it has increased again to 7.5 with minor ups and downs in between. On the average the ratio is between 5,5 to 8.5 during the period. These figures show that the industry is efficiently utilizing its inventories and the utilization rate has increased after 1989. The average collection period ratio has decreased from 115 to 52 in during the period between 1986 and 1994. This shows that the time
are also important in terms of liquidity because, it is very important to turn
inventories into sales (i.e, cash and receivables) and easily collect receivables in order to become liquid.
Even though the assets of the industry are efficiently utilized in generating sales, the return on assets ratio has been quite low over the same period. The ratio has changed between 0.2 and 0.37 over the period. Such a low ratio shows that
although the assets have generated a lot of sales, they are not generating as high a profit as expected, due to high costs of production and expenses.
Another important indicator of profitability, which is return on equity has shown a steady trend with minor ups and downs in between. It has varied between 0.5 and 0.96 during the 1986 -1994 period which is an indication that equity is being
utilized efficiently in generating profits. But this is an expected result as the industry has been debt oriented rather than equity oriented during the same period.
It is clear from the payout ratio in table 4 that the firms have not paid any dividends between 1986 and 1988. However, between 1989 and 1994 the payout ratio has increased tremendously from 0.043 to 0.51. This is why the variability measure of the payout ratio is very high between 1986 and 1994.
Market Value:
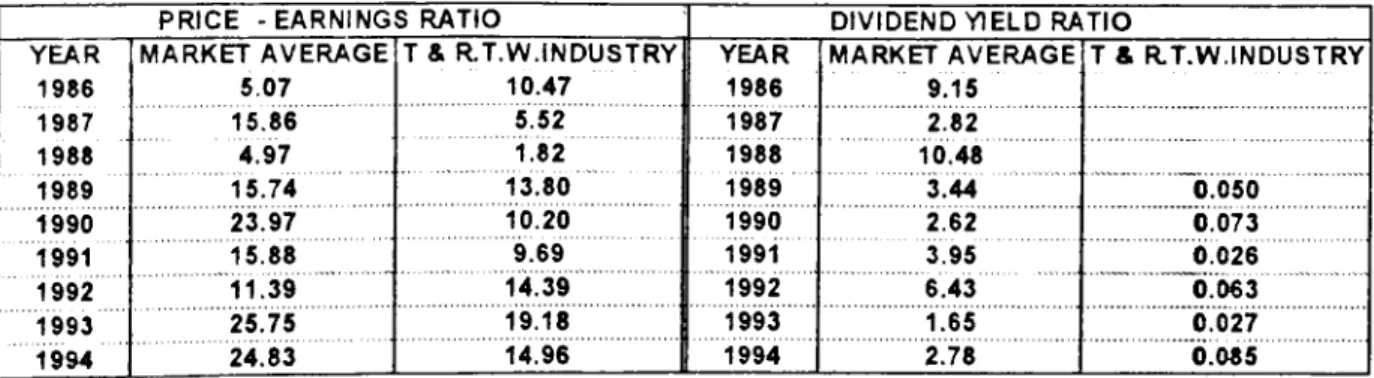
In order to analyze the market performance of the Textile and Ready to Wear Industry, it is important to compare the industry values to the market averages. Table 5 presents the market average values for the price-earnings and the dividend yield ratios for all of the stocks trading at the Istanbul Stock Exchange ( December 1994) and the price - earnings and dividend yield ratios of the Textile and Ready to Wear Industry for the period between 1986 and 1994.
(Table 5 ) The Price - Earnings and Dividend Yield Market Averages and Textile & Ready to Wear Industry Price- Earnings and Dividend Yield Ratios
for the period between 1986 and 1994
P R IC E - EARNINGS R ATIO D IV ID E N D YIELD R ATIO
YEAR 19S6 1987 1988 1989 1990 1991 1992 1993 1 9 9 4 M A R K E T A VE R A G E 5.07 15.86 4.97 15.74 23.97 15! 88 11.39 25.75 24.83 T & R .T .W .IN D U S T R Y 10.47 5.52 1.82 13.80 10.20 9.69 14V39 19.18 14!96 YEAR 1986 1987 1988 1989 1990 1991 1992 1993 1994 MARKET AVER AG E 9.15 2.82 10.48 3.44 2762 3.95 6.43 l76j5 ■■2.78 ■■ T & R .T .W .IN D U S T R Y 0.050 0.073 6.026 6.063 0.627 6.085
T & R . T W . I N D U S T R Y : Textile & Ready to Wear Industry
The price-earnings ratio value for the industry has generally been lower than the market average value during the period between 1986 and 1994. This means that the price of the industry's stock has been cheaper than the price of the average stock in the market. The price-earnings ratio of the market as well as the Textile & Ready to Wear Industry has increased over the period with some up and down in between.
Table 5 shows that the dividend yield ratio of the industry during the period between 1989 and 1994 has been quite low compared to the market average value. This implies that the industry is paying very low dividends in comparison to the average stock in the market. Even though the dividend yield ratio has increased from 0.05 to 0.085 between 1989 and 1994, the ratio has actually shown instability as it has fluctuated up and down during the same period.
included in the analysis not to bias the ratios because, they are outliers to the data points with very high values relative to the other values. Their values are 2997, 85 and 209 respectively.
The market to book value ratio of the industry has not been very volatile over the period. Its lowest value is 0.671 in 1988 for which the price-earning ratio is
the lowest as well. This could mean that the market is in contraction during this year. Its highest value is 19.176 in 1993 for which the price - earnings ratio has been the highest as well. This could mean that the market was in boom during this year. In the rest of the years the ratio is above one indicating that the market values the industry higher than what the stockholders have put into it.
5. 2. The Textile and Ready to Wear Sectors
In this section, firstly, the characteristics of the firms that operate within the
Textile and Ready to Wear sectors are presented. Then, the financial performances of the two sectors are compared using the same methodology as in section 5.1.
5.2.1. Characteristics of Firms that Operate within the Sectors
The firms within the Textile and Ready to Wear Industry can be grouped according to their kind of production. The firms in the Textile sector produce any textile material that can be used as raw material in any other sector or industry. However, the firms in the Ready to Wear sector mostly produce clothing for direct consumption by end users. The by-products that are produced by the Ready to Wear sector firms are used in the production of the end products of the this sector. In this study the firms have been classified into textile and ready to wear sectors by taking into account these characteristics. The sectors are presented below;
As stated before, the firms in the Textile sector produce by-products for other industries. The firms operating in this sector mainly produce yarn with only a few exceptions. The firms grouped under the Textile sector and their main type of production are listed below:
T h e Textile Sector:
FIRM
Akal Tekstil Sanayii A.Ş.
Aksu Dokuma ve Boya Apre Fab. A.Ş Edip İplik Sanayii A.Ş.
Karsu Tekstil San. ve Tic. A.Ş. Kordsa Kord Bezi San. ve Tic. A.Ş. Köytaş Tekstil San. ve Tic. A.Ş. Lüks Kadife Tic. ve San. A.Ş. Okan Tekstil San. ve Tic. A.Ş. Polylen Sentetik İplik Sanayi A.Ş. Sifaş Sentetik İplik Fabrikaları A.Ş. Sönmez Filament Sentetik İplik
ve Elyaf Sanayii A.Ş. Sönmez Pamuklu Sanayii A.Ş. Yünsa Yünlü San. ve Tic. A.Ş.
PRODUCTION Acrylic Yarn
Woolen & Synthetic Textile Yam
Yarn
Cord Fabric
Printing, Finishing, Dying, Treatment Cordery
Cotton Yam Polyester Yam
Synthetic Yam
Polyester Yam
Cotton Yarn, Artificial Yarn Wool Yarn, Texture
Within the textile sector there are firms that are heavy exporters as well as firms that are not. For example, Karsu Tekstil, Köytaş, Okan Tekstil, Polylen, Sifaş and Sönmez Pamuklu do not export much of what they produce, and their export rates are below 12%. On the other hand, the other firms export more than 20% of their
The production of the Ready to Wear sector includes any kind of ready to wear or knitted clothing. Although the firms in the Textile sector, with only a few
exceptions, mostly produce yarn, the firms in the Ready to Wear sector produce different kinds of clothing. The firms grouped under the Textile sector and their main type of production are listed belov/:
The R eady to W e a r Sector:
FIRM
Altınyıldız Mensucat ve Konfeksiyon
Fabrikaları. A.Ş. Derimod Konfeksiyon Sanayii A.Ş.
Koniteks Konfeksiyon Endüstri ve Tic. A. Ş. Soksa Sinop Örme ve Konfeksiyon San.
ve Tic. A.Ş.
PRODUCTION
Texture and Texture Clothing
Leather Wear and Shoes Blue Jean (Lee Cooper)
Knitted Wear and Texture Clothing
The firms in the Ready to Wear sector are heavy exporters. For example. Soksa exports nearly 90% of its production and the other companies export at least 20% of their production.
Both of the sectors are heavy importers of cotton. The import rates are usually around 20-30% of their Cost of Production. For example, for Sönmez Pamuklu and Yünsa in the Textile sector and Derimod in the Ready to Wear sector the import rates are 60%, 85% and 80% respectively.
Table 6 shows the Equal Weighted Mean ratios and the Variability Measures used in the financial performance comparisons of the two sectors. Also Appendix D presents the calculations of these ratios for the two sectors.
Leverage:
The debt to equity ratios of the textile and the ready to wear sectors show that both of the sectors have used debt as their major source of funding until 1990. The ratios of the two sectors have been quite close until this year. After 1990 the share of debt has increased for the ready to wear sector, whereas the textile sector has increased its share of equity. Actually, the ready to wear sector has increased its share of debt to at least twice of that of the textile sector after this year. Also, the debt to equity ratio for the textile sector has been quite stable, whereas the ratio for the ready to wear sector has been more volatile between 1986 and 1994.
The low capitalization ratios and short term liabilities to total liabilities ratios above 0.5 for both of the sectors show that the debt structure of the sectors has been short term. The share of short term debt has been higher for the textile sector until 1988 but after this year the situation has reversed. Even though the short term liabilities to total liabilities ratio has been stable for the textile sector between 1986 and 1994, the ratio has nearly doubled for the ready to wear industry.
The times interest earned ratios between 1986 and 1994 show that the ratios for the textile sector are much higher than the ratios of the ready to wear sector.
Another observation is that the ratio has increased for the textile sector whereas it has decreased for the ready to wear sector during the same period. Therefore, it is clear that the textile sector has been more efficient in generating earnings in excess
TA3LE 6) EQUAL vVEiGhfTEC MEAN RATIOS AND VARIANCE MEASURES ¡^OR THE TEXTILE AND THE i=*-A^Y t q S^^'^ORS _ C A P IT A L IZ A T IO N R A T IO 1 9 8 6 1 9 8 7 1 9 8 8 1 9 8 9 ' 1 9 9 0 : 1991 1 9 9 2 1 9 9 3 1 9 9 4 v a r ia s,·. it y
TEXTILE SECTOR EWM | 0 2 X ; 0 193 0 1 43 0 23 1; C '6 5 | 0267: 0 2 9 6 0 235 0 -6 3! : 721 KEADY TO WEAR SECTOR EWM 0 57 0 389: 0 203 C 1815! 0 -7 5| 0 ^ 6 1 ' 0 265 0 257 0 354' *2 7 6
7 ^ ^ ^ ■ i
D E B T /E Q U IT Y R A T IO ' I 1 ^ r
TEXTILE SECTOR EWM 16 2 3 1.54i3 1 665' 1 639| 1 16'7\ 1 5 0 7 1 : 4 1 l ' 1 434 1 04,8 : ^26 READY TO WEAR SECTOR EWM 4 844| 1 62(3 1 368 1 70<9 2 07-4 6 333i 2 921; 2 334 2 96:^ - 707
j ^ ^ ^ ---T IV IE S IN ---T E R E S ---T E A R N E D I 1 1 I---^ ^
---TEXTILE SECTOR EWM 3 270! 3 1 3 :> 1 999 3 93:2 6 53^1 3 059: 4.979 5 242: 4 3313! '1 1 9 READY TO WEAR SECTOR EWM 1.1761 1 9301 0.725· 2 62'! 1 60f3 C 54-4 0 414; 0 946' 0 6781 '7 8 3
1 ---1---;---1 1
S H O R T T E R M L lA B .r r O T . L IA B . j 1 i
TEXTILE SECTOR EWM 0.761 0 8oe1 0 852’ 0 777^ 0 76:? 0 76'1 0 758! 0 730 0 80^1 : i 5 6 READY TO WEAR SECTOR EWM 0 56e 0 58£) 0 674 0 867' 0 85C) 0S 58| 0 672! 0 8011 C 81i3I : 397
1 1
C U R R E N T R A T IO 1
TEXTILE SECTOR BWM 1 85€ 1.7541 1.595i 1.5641 1 957 1.717^ 1.72-r 1 92i3 1.9811 :2 3 3 READY TO WEAR SECTOR EWM 1 .8 ie 1 963I 1 82'1 1 35SI 1 312I 1 13£) 1.14^1 1 129i 1 l i e ) : 600
1
Q U IC K R A T IO 1
TEXTILE SECTOR EWM 1 195 1.1811 1 036·' 0 934 1 2801 1 0831 1.1431 1 1031 i.c3ei : 311 READY TO WEAR SECTOR EWM 0 925 1 080| 1130' 0 5 9 8 0.515 0 545• 05741 0 648·' 0 393i - 035
I
C A S H R A T IO I
TEXTILE SECTOR EWM 0.220 0.246 0 076; 0.114 0 359 0 - 6 5 ' 0 2231 0.2251 0.298 ' 312 READY TO WEAR SECTOR EWM 0 016 0 0321 01 41j 0 078 0 054 0 052 0 083 0.058 0 075 - 878
I N E T W O R K IN G C A P ./ T .A S S E T S i
TEXTILE SECTOR EWM 0.259 0.289 0.262' 0 226 0 302 0.227 0 245 0.191 0.277 3 439
READY TO WEAR SECTOR EWM 0 315 0 336 0.258 : 0.193 0.149 0 089 -0 061 -0 005• -0 002 2 817 _______ i__________
S A L E S T O T O T A L A S S E T S
TEXTILE SECTOR EWM 1 436 1 551 1 234 1 424 1 365 1 568 1 409 1.763 - 363
READY TO WEAR SECTOR EWM 1.215 1.233 1.476 1 378 1542 1 522 1 654 1 807 - 375
N E T P R O F IT M A R G IN
TEXTILE SECTOR EWM 0.219 0 225 0.259 0.180 0.181 0.151 0.139 0 1 3 6 | 0.240 : 539
READY TO WEAR SECTOR EWM 0 2 1 4 0.237 0.2531 0 255 0 198 0 202 0 070 0.0641 0.151 - 050 I
I IN V E N T O R Y T U R N O V E R
TEXTILE SECTOR EWM 9.157 9 706 8 992 6 020 6.512 9.115 7 925 7.965 - 259
READY TO WEAR SECTOR EWM 3 9 9 5 4 793 i 6 353 3 941 5061 5 101 6281 5 8 7 3 - 381
I
A V G . C O L L E C T IO N P E R IO D I
TEXTILE SECTOR EWM 103 106 94 91 106 86 81 54 - 325
READY TO WEAR SECTOR EWM 111 106| 84 65 73 69 66 46 - 611
R E T U R N O N A S S E T S 1
TEXTILE SECTOR EWM 0.314 0 390 i 0.302 0.259 0 2 0 5 0.222 0.201 0.406 C.714
READY TO WEAR SECTOR EWM 0.266 0 300 0 325 0311 0.301 0.200 0 1 5 6 0 272 - 372
II
R E T U R N O N E Q U IT Y
---TEXTILE SECTOR EWM 0 793 1019; 0 801 0 642 0 540 0 6 16 0.617 0.777 - 553
READY TO WEAR SECTOR EWM 0 809 0.732: 0 820 1 238 1 164 0 526 0.733 0.522 - 702
i I
--- P A Y O u T T O m o I
TEXTILE SECTOR EWM ; 0 040 16 673 14 550 25 618 33 685; 67 511 3 B34
READY TO WEAR SECTOR EWM T ; 0 0 8 6 9 033 7 074 11.795! ‘>'>571 14.751 2 444
I i
# OF TEXTILE FIRMS 8 8 8 I 12 12 12 12 13 13
« OF READY TO WEAR FIRMS 2 2 2 3 4 4 4 4 4
P R IC E E A R N IN G S R A T IO
TEXTILE SECTOR EWM 10.466 5 5 1 9 1815' 13 804 9.719 96 6 6 10.666 20.044 11 614 1 708
READY TO WEAR SECTOR EWM I 13.528 9791 14 189 12 532 22.267 2 772
i
D IV ID E N D Y IE L D R A T IO T \
TEXTILE SECTOR EWM ! 0 050 0 076 0 031 0 078 0 030 0.105 2 544
READY TO WEAR SECTOR EWM 0.050 0 010 0 015 0021 0.023 3 794
M E R K E T T O B O O K V A L U E
TEXTILE SECTOR EWM 1 235 1.921 0.671 1 921 1.485 1.888 0.897 2.765 2.247 '! 254
The times interest earned ratio has been more volatile for the ready to wear sector during the same period.
Liquidity:
The current ratio shows that both of the sectors have enough current assets to meet their current liabilities. Although the ratio for the ready to wear sector is higher until 1988, the ratio has increased for the textile sector and decreased for the ready to wear sector after this year, meaning that the liquidity of the textile sector has increased whereas the liquidity of the ready to wear sector has decreased.
Nevertheless, it is important to analyze the performances of the at the quick, cash and net working capital to total assets ratios.
Table 6 shows that the quick ratios are smaller than the current ratios and the cash ratios are smaller than the quick ratios for both of the sectors, the ratios being smaller for the ready to wear industry. This is important because it shows that the share of the most liquid assets are less than the share of the less liquid assets. Upon this analysis, it can be stated that the textile sector is more liquid than the ready to wear sector but both of the sectors have high shares of receivables and inventories, which increase their liquidity risk and that the risk is higher for the ready to wear sector. It is important to understand the performance of the inventory
turnover and receivables turnover ratios to see if the firms have decreased their liquidity risk, which is explained under the profitability section.
The net working capital to total assets ratios below 0.3 for both of the sectors confirm that the sectors are not very liquid. This ratio has been higher for the textile sector after 1988, confirming that the textile sector is more liquid than the ready to
between 1986 and 1994, the decrease for the ready to wear sector has been tremendous during the same period.
In general the liquidity ratios for the textile sector have been more stable than those of the ready to wear sector as their variability measures are higher for the ready to wear sector.
Profitability:
The sales to total assets ratios of both of the sectors show that they use their assets efficiently in turning into sales and that the utilization rates have increased between 1986 and 1994 because of the investments incurred in prior years.· The ratios for the sectors are very close to each other during the analyzed period.
Although asset are efficiently used in generating profits, the low profit margins and returns on assets ratios for both of the sectors indicate that the cost of
production and the expenses for the sectors are very high. Until 1989 the textile sector has had higher profit margins, between 1989 and 1992 the ready to wear industry has performed better and afterwards the trend has been for the textile
sector to perform better again. The profit margins have increased for the textile and decreased for the ready to wear sector between 1986 and 1994.
Inventory utilization is efficient for both of the sectors between 1986 and 1994, however, the utilization has been better for the textile sector. Although in relative terms the textile sector has used inventories much more efficiently, the inventory turnover ratios have actually inc^'eased for the ready to wear sector and decreased for the textile sector during the same period. The average collection period ratios for both of the sectors have decreased between 1986 and 1994. The firms in the sectors have improved in terms of turning receivables into cash. Table 6 shows that
the decrease in the average collection period ratios is actual'y higher for the ready to wear sector. The decrease has been 60% for the ready to wear industry whereas it is approximately 47% for the textile sector. Because the ready to wear sector has performed better in terms of increasing its inventory turnover and decreasing its collection period more than the textile sector shows that the ready to wear sector is actually better in decreasing its liquidity risk, even though, it is less liquid than the textile sector.
The return on equity ratio has been quite high relative to the return on assets ratio for both of the sectors. This ratio has generally been higher for the textile industry between 1986 and 1994 except in 1990 and 1991. This is an expected result as the sectors have been debt oriented rather than equity oriented during the period.
The payout ratios have increased tremendously for both of the sectors. However, the increase has been 1686% for the textile sector but only 170% for the ready to wear sector between 1986 and 1994. The payout ratios have continously increased even though the profit margins have fallen until 1993. The highest increase is in 1994 in which the profit margins have increased as well.
All of the profitability ratios in general have been more volatile for the ready to wear industry between 1986 and 1994 except for the payout ratio. There has been a wider fluctuation in the value of the payout ratio for the textile sector.
Market Value:
ratios fo- all of the stocks trading at the Istanbul Stock Exchange ( Decejnber 1994), along with the ratios of the Textile and Ready to Wear Sectors for the period
between 1990 and 1994. The period starts from 1990 because The Ready to Wear sector firms were first quoted to the ISEX in this year.
(Table 7) Price - Earnings and Dividend Yield Market Averages and Textile & Ready to Wear Sectors' Price- Earnings and Dividend Yield Ratios
for the period between 1990 and 1994
PRICE - EARNINGS RATIO DIVIDEND YIELD RATIO
YEAR MRKT AVG. TEXTILE S. R.T.W.S. YEAR MRKT AVG. TEXTILE S. R.T.W.S.
1990 23.97 9.72 13.53 1990 2.62 0.076 0.05 1991 15.88 9.67 9.80 1991 3.95 0.031 0.01 1992 11.39 10.67 14.19 1992 6.43 0.078 0.015 1993 25.75 20.04 12.53 1993 1.65 0.03 0.021 1994 24.83 11.61 22.27 1994 2.78 0.105 0.023 M R K T A V G : M a rk e t A v e ra g e T E X T IL E S. : T e x tile S e c to r R .T .W . S .: R e a d y to W e a r S e c to r
The price-earnings ratio value for the both of the sectors has generally been lower than the market average value during the period between 1990 and 1994. This means that the price of the sectors' stocks have been cheaper than the price of the average stock in the market. Over the same period the price - earnings ratios for the textile sector have usually been lower than the price - earnings ratios of the ready to wear sector which implies that the price of the textile sector stocks have been cheaper and its earnings have been higher than those of the ready to wear sector.
Table 7 shows that the dividend yield ratio of the sectors during the period
between 1990 and 1994 have been quite low when compared to the market average value. This implies that both of the sectors are paying very low dividends in
comparison to the average stock in the market. Also, it is important to state here that the dividend yield ratios of the textile sector have been higher than those of the ready to 'A'ear sector. Table 7 also shoves that the even though the dividend yield of the textile sector has increased during 1990 to 1994 with some ups and downs in between, the dividend yield of the ready to wear sector has actually decreased.
It is important to indicate that some firms have not been included into the calculation of the price-earnings ratio of the industry in certain years. These firms are Okan Tekstil in 1991 and Polylen in 1990 and 1993. They have not been included in the analysis not to bias the ratios because, they are outliers to the data points with very high values relative to the other values. Their values are 2997, 85 and 209 respectively.
The higher market to book value ratios of the ready to wear sector also imply that the price of the ready to wear sector stock is much more expensive than the stock of the textile sector.
The market value ratios have been more volatile for the ready to wear sector between 1990 and 1994 when compared to the textile sector.
6 . 1 . Financial Performance of the Industry and the Sectors within
6 . 1 . 1 . Leverage
The Whole Industry
The industry has been financed by short term debt until 1993. After this year there is a turnover towards equity financing. Because the industry has been financed by short term debt the financial expenses have been high as well. Even though the trend is towards equity financing after 1993, the financial expenses are still high because of the interest payments of debt that was obtained in previous years.
The Textile and Ready to Wear Sectors
The major financing tool for both of the sectors has been debt until 1993. After 1993 the textile sector has increased the share of equity in its financing.
The debt structure of both of the sectors is short term debt betw-een 1986 and 1994. However the share of short term debt has been higher for the ready to wear sector. The share of short term debt in total liabilities has increased for the ready to wear sector, whereas, it has not changed for the textile sector during the same period. Because the ready to wear sector has used more d e b t, the financial expenses of this sector are higher as well.
CHAPTER VI. CONCLUSION
6. 1. 2. Liquidity
The Whole Industry
The current assets structure of the industry is not very liquid. The current assets are mostly composed of receivables and inventories which are not as liquid as cash and marketable securities. Even though the industry is not very liquid, it has
decreased its receivables collection period and improved its inventory turnover between 1986 and 1994, thus decreasing its liquidity risk.
The Textile and Ready to Wear Sectors
The current assets structure of both of the sectors is not very liquid. The current assets are mostly composed of receivables and inventories which are not as liquid as cash and marketable securities. Although the liquidity of the ready to wear sector is lower than the liquidity of the textile sector, the ready to wear sector has
performed better in terms of decreasing its receivables collection period and increasing its inventory turnover, thus decreasing its liquidity risk.
6 . 1 . 3 . Profitability
The Whole Industry
The industry generates high volume of sales via using its assets and capital efficiently, but due to high costs of production and high financial expenses it is not as efficient in turning its resources into high profits.
Even though the industry has not been able to generate high profits relative to its resources, the share of dividend payouts has increased tremendously during the same period.
The Textile and Ready to Wear Sectors
Although both of the sectors use their assets eRciently they have low profit margins because of high costs of production and financial expenses. The profit margins are generally higher for the textile sector indicating that this sector is more profitable between 1986 and 1994. The higher dividend payout and inventory turnover ratios for the textile sector also imply that this sector is more profitable than the ready to wear sector.
Despite of the fact that the textile sector is more profitable, the ready to wear sector has performed better in terms of reducing its receivables collection period and improving its inventory utilization. This implies that the ready to wear sector might be more profitable in the future.
6 . 1 . 4 . Market Value
The market has valued the Textile & Ready to Wear Industry and the sectors within the industry at market prices above the generated earnings and the dividend returns. In terms of the individual sectors the market value has been higher for the ready to wear sector.
The conclusions presented in this section will be based on the two sectors within the industry as there are some differences in terms of their performances.
6 . 2 . 1 . Creditors
The credit institutions like to know about the leverage and liquidity ratios of the companies in credit granting decisions. In this respect, it is more probable that they will grant credits to the textile sector.
The ready to wear sector has a high debt rate that is increasing every year. Parallel to this the financial expenses of the sector are also very high as the times interest earned ratios are very low ( below 1 ). The liquidity of this sector is very low and the quick ratio has shown a decreasing trend throughout the years. Therefore this is a high risk sector for which the credit institutions would hesitate to grant credit.
On the other hand, the Textile sector has decreased its share of debt and its interest payments throughout the years, its times interest earned ratios are
improving ( the rates being above 4) and the trend for the textile sector has turnover to equity financing. The quick ratios are above 1 throughout the years and its net working capital to total assets ratio has improved throughout the years. Therefore this sector is a potential for credit granting decisions.
However, credit institutions should watch out for the average collections period and inventory turnover ratios of the sectors in the future. These ratios effect the liquidity of the companies in terms of improving the cash collection cycle and as the
between 1986 and 1994, the liquidity of this sector may actually increase in the future
6. 2. 2. Turkish and Foreign investors
Investors gain money from the dividend payments of stocks and/or from price differences of the stocks. Therefore they like to watch the trend of the Price- Earnings and Dividend Yield Ratios of the companies.
As discussed in the market value section of chapter 5, the dividend yield ratios for the industry and both of the sectors are very low compared to the dividend yield ratio of the average stock in the market. Therefore investors would not invest in either of the sectors in order to gain from dividend payments.
On the other hand the price - earnings ratios for the textile and ready to wear sectors are lower than the price - earnings ratios of the average stock in the
market. Therefore the prices of the stocks of the two sectors are cheaper relative to average market price. Therefore investors could invest in both of the sectors as they have cheap prices in order to take advantage of price changes.
When we compare the two sectors, we can see that the textile sector is more promising as it has higher dividend yield and lower price - earnings ratios than the ready to wear sector.