• Т В
: Z & o o
FINANCIAL PERFORMANCE OF TURKISH DEFENSE FIRMS: A COMPARATIVE ANALYSIS
MBA THESIS
ENGİN COŞKUN ANKARA, September 2000
H Ь
• Т 5
FINANCIAL PERFORMANCE OF TURKISH DEFENSE FIRMS; A COMPARATIVE ANALYSIS
A THESIS
Submitted to the Department of Management and Graduate School of Business Administration ol
Bilkenl University
In Partial Fulfillment of the Requirements For tlie Degree of
Master of Business Administration
By
ENGiN CO$KUN September, 2000
I certify that I have read this thesis and in my opinion it is fully adequate, in
scope and in quality, as a thesis for the degree of Master of Business
Administration.
„ „ . A
Assoc. Prof. Can §mM^ Mugan
I certify that I have read this thesis and in my opinion it is fully adequate, in
scope and in quality, as a thesis for the degree of Master of Business
Administration.
.
_____
Prof Dr. Kiii'^at Aydogan
1 certify that I have read this thesis and in my opinion it is fully adequate, in
scope and in quality, as a thesis for the degree of Master of Business
Administration.
Asst. Prof Zeynep Önder
Approved for the Graduate School of Business Administration.
ABSTRACT
FINANCIAL PERFORMANCE OF TURKISH DEFENSE FIRMS: A COMPARATIVE ANALYSIS
BY
ENGİN COŞKUN M.B.A.
SUPERVISOR: ASSOC. PROF. CAN ŞIMGA MUGAN SEPTEMBER, 2000
The importance of the Turkish defense firms that sell various products to the Turkish Armed Forces has been gradually increasing in the last decade. Furthermore, companies in defense industry have an important role in economy. Sales to the Turkish Armed Forces make up about 40% of their total revenues on average. However, the Turkish defense industry has not been examined financially yet, so the main objective of this study is to determine the financial performance of the Turkish defense industry firms by using financial ratios, and compare it with the manufacturing sector. The study period covers from 1994 to 1998, and .seventeen ratios are used in four main categories for 30 firms in category.
ÖZET
TÜRK SAVUNMA SANAYİİ ŞİRKETLERİNİN FİNANSAL PERFORMANSI: KARŞILAŞTIRMALI BİR ANALİZ
ENGİN COŞKUN
YÜKSEK LİSANS TEZİ, İŞLETME FAKÜLTESİ TEZ DANIŞMANI; DOÇ. DR. CAN ŞIMGA MUGAN
EYLÜL, 2000
Ülkemizde Türk Silahlı Kuveellerinin çeşitli ihtiyaçlarına yönelik üretim yapmakta olan savunma sanayii şirketlerinin ve savunma sanayiinin önemi gün geçtikçe artmaktadır. Ayrıea savunma sanayii şirketlerinin ekonomideki önemli rolü açıktır. Bu şirketlerin toplam gelirlerinin ortalama 40%'ı Türk Silahlı Kuvvetlerine yapılan satışlardan gerçekleşmektedir. Ancak, yapılan araştırma sonucunda Türk Savunma Sanayii şirketlerinin finansal olarak incelenmediği görülmüştür. Bu yüzden bu çalışmanın amaeı finansal oranları kullanarak Türk Savunma Sanayii'nde çalışan şirketlerin finansal yapısını ortaya çıkarmak, ve bulguları imalat sektörü ile karşılaştırmaktır. Çalışma 1994 ile 1998 yılları arasını kapsamakta olup, toplam 60 şirket için dört ana kategoride toplam onyedi oran kullanılmıştır.
1 am grateful to Assoc. Prof. Can Şımga Muğan for her supervision, motivating encouragement and constructive comments throughout this study. I would also like to express my thanks to the other members of the examining committee for their contribution.
I would also like to thank sincerely to my dear wife Dilek Kösemehmet Coşkun for her support and encouragement during the prcpai ation of this thesis.
ACKNOWLEDGEMENTS
LIST OF TABLES
Table 1: Sales of control group (million TL) Table 2; Sales of defense sector (million TL) Table-3; Total assets of control group (million TL) Table-4: Total assets of defense sector (million TL) Tablc-5: Mean and median of total assets (million TL) Table-6: Mean and median of sales (million TL) Table-7: Results of current ratio
Table-8: Results of quick ratio Table-9: Results of cash ratio
Table-10; Results of inventories / assets ratio Table-11: Results of debt ratio
Table-12; Results of debt to equity ratio
Table-13: Results of current liabilities / total debt ratio Table-14: Results of PPE / OE ratio
Table-15; Results of account receivable / total assets ratio Table-16: Results of ROA ratio
Table-17: Results of ROE ratio
Table-18: Results of return on sales ratio Table-19: Results of inventory turnover ratio
20 21 22 23 24 24 28 29 31 32 34 35 37 39 40 42 43 44 47 IV
Table-20; Results of asset turnover ratio Table-21: Results of OE turnover ratio Table-22: Results of WC turnover ratio
Table-23: Results of account receivable turnover ratio
48 50 51 53
TABLE OF CONTENTS ABSTRACT ÖZET ACKNOWLEDGEMENTS in LIST OF TABLES IV 1. INTRODUCTION
2. EVOLUTION AND CHARACTERISTICS OF TURKISH DEFENSE INDUSTRY
3. BRIEF OVERVIEW OF RATIO ANALYSIS 10
4. DATA 19 5. METHODOLOGY 25 6. RESULTS 27 6.1 Liquidity ratios 6.1.1 Current ratio 6.1.2 Quick ratio 6.1.3 Cash ratio
6.1.4 Inventories / Assets ratio 6.2 Leverage ratios
6.2.1 Debt ratio
6.2.2 Debt to equity ratio
27 27 29 30 32 33 34 35
6.2.3 Current liabilitie.s / Total debt ratio
6.2.4 Property, plant, and equipment / Ownens' equity ratio 6.2.5 Account receivable / Total assets ratio
6.3 Profitability ratios
6.3.1 Return on assets ratio 6.3.2 Return on equity ratio 6.3.3 Return on sales ratio 6.4 Efficiency ratios
6.4.1 Inventory turnover ratio 6.4.2 Asset turnover ratio
6.4.3 Owners’ equity turnover ratio 6.4.4 Working capital turnover ratio 6.4.5 Accounts receivable turnover ratio
37 38 40 41 41 43 44 46 46 48 49 51 52
7. CONCLUSION AND DISCUSSIONS 54
APPENDIX 57
1. INTRODUCTION
Defense industry is a group of public and private companies which produce strategical and tactical, offensive and defensive weapon systems and military accessories, and have a close cooperation with all economic activity areas mainly industries that produce investment goods (Şimşek 1989, p.31).
Decreasing the defense spendings will shorten the period of economic development, however no country can undervalue the importance of defense. Especially Turkey has to pay more attention to defen.se than many other countries. After the cold war, contrary to many countries Turkey found herself in a critical part of the world with full of crisis. Three sides covered with .seas and connecting two continents, Turkey has a very special and geostrategic position (Milli Savunma Bakanlığı 1998, p.5). Because of many threats in the region, Turkey has become a front country instead of a wing country after the cold war. So being strength and balance element, Turkey pays more attention to defense.
Defense spendings account for an important part of the national budget, hence any difference in the spendings will affect the budget severely. Also employment rate, industrialization of the country, technology usage, training of the work force and the amount of the international political force will all be affected by the defen.se industry. Another important role will be on the quality side. Since standardization and quality are
the most important elements of the defense products, quality of the products are expected to improve as well.
Being an important part of the economic structure of the country, defense industry has some differences from other industries. These are (Şimşek 1997):
It needs .sensitive production techniques with high technology. It needs special quality .standards.
It requires trained manpower.
It always uses the newest technology, and therefore R&D activities are crucial.
It requires large amount of investment.
Since there is only one buyer, it requires limited production according to the needs.
The companies in this industry need to enter to international markets, in order to survive.
More attention is paid to safety and secrecy. Some other differences are:
Price has secondary importance according to quality and timing. Also price is set according to the co.st, unlike the price setting mechanism in highly competitive markets (Akgiil 1986, p.40).
Companies in this industry are not autonomous becau.se the government sets the main policy and then companies .set their own policies according to the main policy, and they al.so go under government in.spection (Şimşek 1989, p.37).
These companies generally don't have the flexibility to transform the production to civilian products (Şimşek 1989, p.39).
Although it is obvious that the companies in defense industry have an important role in economy, in Turkey the companies working for defense industry haven't been studied financially. Therefore, analyzing the financial positions of the defense firms is the aim of this study. In this study the defense firms and manufacturing sector will be compared by financial ratios, since the most important tool in understanding the industry's financial structure is ratio analysis. In the following parts of the thesis defense firms will be called as defense industry or defense scctoi' and manufacturing sector will be called as control group.
There are some assumptions about defense .sector at the beginning of the study. Owing to the fact that they are usually getting advance money, their account receivables would be less. Also they would have less debt. In addition their inventory management would be better than the control group. So generally they would be more profitable.
The evolution and characteristics of the Turkish defense industry are explained in chapter 2. Then brief information about ratio analysis is given in chapter 3. Also chapter 4 and chapter 5 explain data and methodology. Chapter 6 contains the results of the studies. Finally conclusion and discussions appear in chapter 7.
2. EVOLUTION AND CHARACTERISTICS OF TURKISH DEFENSE INDUSTRY
Defense industry has a long history for Turks. During most of the life of the Ottoman Empire, defense industry was very strong. But after the E' World War there was no ability to produce weapons anymore. The sector was constructed mainly during 1945- 1950 period. Until 1965, it was in an unproductive period. The accelerating trend of the defense industry began with the crisis in Cyprus after the embargo of USA in 1974. The Undersecretariat for defen.se industries (SSM) coordinates the activities in this industry. Today 65% of all needs and 21% of main systems needs of Turkish Armed Forces are met by the Turkish defense industry (Milli Savunma Bakanlığı 1998, p.II)
There are three main groups in this .sector. They are;
Military factories, shipyards and reinforcement centers
Public corporations and corporations related with the Turkish Armed Forces Strengthening Foundation
Private companies
The undersecretariat for defense industries (SSM) was established in 1985 by parliamentary legislation as a separate legal entity with a budget of its own and has been given the re.sponsibility of developing the national defen.se industry, while meeting the modern defense equipment needs of the Turkish Armed Forces. SSM finances the
projects with the Defense Industry Support Fund whose annual revenue totals some US$ I billion.
SSM's main duties and functions are stated as (Undersecretariat for Defense Industries, 1997):
To develop the capabilities of the national defense industry in order to satisfy the modernization requirements of the Turkish Armed forces,
- To organize and integrate the existing industrial capabilities in line with the requirements of the defense industry.
To co-ordinate off-set trade issues and export of defense industry products.
To promote export-oriented joint ventures between Turkish and foreign companies that are willing to bring in state-of-the art technologies.
To plan the production of required weapon systems and equipment in state and private establishments,
- To research and develop modern weapon systems and equipment, to have their prototypes manufactured.
To determine the terms and conditions of procurement.
To make feasibility studies, technical and economic evaluations and to undertake contract negotiations, sign contracts, and execute production-iollow-on quality control activities.
It is well known that overspending in defense will decrease the prosperity of that country. But it is very hard to find the optimum amount of spending. To find that point a strategic planning is done. It has four steps (Maliye Bakanlığı, 1993);
Country safety benefits and commitments Threat acceptance and threat evaluation Defining defense policy and strategy
Buying the necessary weapon systems and improving armed forces according to the strategic and political evaluations.
Turkey also has a strategic target plan. It contains 6 years period and is revised in 2 years time.
Defense spendings are always increasing according to the improvements in technology. The developed countries that have 1/4 of the worlds' population do 80% oi the defense spendings. The main reason is to take preventive measures against wars. Because in war periods defense spendings take 60-70% of the government spendings, and continue for a period after the war.
Generally 3% of GNP and 18% of the government spendings of countries aie defense spendings (Uysal 1997, p.38). In Turkey, defen.se .spendings cover the bigge.st part of the budget with 9.42% and the main reason is the modernization of armed forces (Ulusal Strateji 1999, p.28). The spendings are done from:
Ministry budget 35.4%
Defen.se Industry Support Fund 18.3%
USA security aid 15.3%
Germany aid 0.6%
Government and company credits 5.8%
NATO Infrastructure Fund 9.8%
Private subsidy 3.7% Turkish Armed Forces Strengthening Foundation 0.4%
The entry barriers could be considered as high in the defense industry. There are more types of entry barriers in the defense industry then the other industries (Şimşek 1989, p.52-56). They are;
High performance need
High capacity in R&D and more technicians Expensive and special resource requirements More capital need
Economies of scale
Different structure of the demand Marketing problems
High manufacturing overhead costs Regulatory policies
Effects of procurement policies and applications
Also there are some others barriers for the companies that want to leave the industry. They are:
Existing of high amount of expensive resources Special structure of the workforce
Current gains from R&D which is supported by the government Gains from exports
Turkey faces generally the same problems of the developing countries while generating her own defense industry. These problems are (Şimşek 1989, p, I80-187)(Milli Savunma Bakanlığı 1998, p.XIl-XIII):
Defense spendings occupy a major part of GNP but because of low GNP these spendings are not enough.
Problems in transferring new technology to Turkey. Insufficiency of current production technology. High production costs.
Financing problems. Lack of trained workforce. Economies of scale.
Dependency on foreign industries. Regulatory policies.
Price has primary importance more than technology and human resources. Firms in this industry concentrate on production however, there are major problems in maintenance.
As it is explained before the defense industry has great effects to the economy and Şimşek (1989) explains the effects as:
It effects the resource distribution. When optimum amount of resources are used in defense industry then economic development will speed up.
It affects the level of industrialization. It has both positive and negative effects. Such as using high technology, training workforce and high quality are
the positive effects to the industry. But difficulties in changing productions from defense to other .sectors and short product lives are the negative effects.
Companies in this .sector gain from government supported R&D because with low co.sts they use the new technology in both defen.se products and civilian .sectors. Since companies in this industry make important amount of exports, countries gain from defense industry.
It effects the balance of payments. In the long, run effects of defense industry to the balance of payments is positive. Importing less and exporting more decreases the payments of the country.
It effects the level of employment. But generally a technology intensive production is used and they don't create a big need for employment.
It generally effects the inflation in a negative way.
Its spin-off effects. The main ones are the goods produced by defense industry for commercial markets and the sources gained by exportation of defense products.
3. BRIEF OVERVIEW OF RATIO ANALYSIS
As Gardiner (1995) explains, although being affected by some problems, ratio analysis continues to represent one of the financial world's most powerful and versatile tools. Gardiner (1995) expresses the usage areas of ratio analysis as:
By companies when evaluating the creditworthiness of their debtors; By investors when considering the merit of alternative investments; By banks and other lenders before granting loans;
By auditors when conducting analytical reviews of their clients;
- By merger and acquisition teams when considering potential targets, etc. Lev (1974) states that financial statement analysis was first used in the second half of the nineteenth century. He further states that two major economic developments created this need: (a) the emergence of the corporation as the main organizational form of business enterprises, resulting in a separation of management from ownership, and (b) the fast-increasing role of financial institutions (e.g., banks, investment and insurance companies, etc.) as the major suppliers of capital for business expansion requiring a formal evaluation system of borrowers' credit worthiness. At that time credit analysis was the dominant function in the financial analysis, such as to request the balance sheets of prospective borrowers for credit evaluation was a routine work in 1890.
In the first decade of the twentieth century financial ratios were u.sed and ".scientific approach" to the financial analysis started. Again credit evaluation had a big importance.
so current ratio was seen as the most useful ratio. It was the most powerful tool to identify the solvency of the firm. But in a short a time the limitations of the ratio were recognized and new ratios were developed. Also the establishment of rule-of-thumb measures for various ratios, such as 2:1 for current ratio, were new developments. And the industry average was accepted as the major standard for ratio evaluation (Lev
1974,p.2).
In the 1920s and 1930s real data collection and proliferation of new ratios were important. So after then ratio analysis took the main structure and being continued until recently without any major development.
Financial analysis is done to make decisions related to future. Hoskin (1997) explains this with the help of prospective and retrospective analyses. While making a prospective (forward-looking) analysis the difficulty is that future is not certain. So using retrospective analysis, according to the past data, is the most powerful tool for the analysts. And times-series and cross-sectional analyses are the two major types of retrospective analysis. In time-series analysis the future of the company would be predicted according to the past data. In this analysis the analyst examines information from different time periods for the same company to estimate the future. But in cross- sectional analysis the data from one company is compared with other data. The other data would be the data of another company (in the same industry or in another industry) or the average of industry. Choosing the type of the analysis differs according to the type of decision. Also according to the purpose of the analysis the type of data varies. There are mainly three types of data:
Raw financial data: The data that appears directly in the financial statements.
Common size data: All items are expressed as a percentage of one item. Such as in a common size income statement, they are expressed as a percentage of sales revenue.
Ratio data: While trying to make compari.sons between various financial statements, common size data aren't enough. By using ratios these comparisons can be done and these ratios can be used in a time-series or cross-sectional analysis.
Foster (1986) also discusses about analyzing the data at a point in time and trends over time. In cross-.sectional analysis there are two main techniques: (a) common-size statements and (b) financial ratio analysis. Since there are many ratios in literature he categorizes some of these ratios. He uses seven categories and nineteen ratios within the.se categories. The categories are (1) cash position, (2) liquidity, (3) working capital/cash flow, (4) capital structure, (5) debt service coverage, (6) profitability, and (7) turnover. Also in time-series analysis there are three techniques: (a) trend statements, (b) financial ratio analysis, and (c) variability measures. In trend statements one year is chosen as a base and then the statement items of sub.sequent, years are expressed relatively to their value in the ba.se year. Another technique is computing the variability measures for financial ratios and other variables over time. So the information contained in a single ratio measure is expanded beyond one fiscal year.
Maximum value - minimum value Mean financial ratio
Lev (1974) first classifies the ratios according to the source of data: (a) balance sheet ratios, (b) income statement ratios, (c) fund statement ratios, and (d) mixed ratios. He sees the facilitation of financial statement interpretation as the main objective of ratio analysis by reducing the large numbers to a relatively small set of ratios. Being the symptoms of the firm's economic condition ratios get their value from the questions they provoke. While forming the ratios there are three main logical relationships: (a) ratios should relate matching components, (b) ratios should be formed only from elements based on common values, and (c) ratios should be formed only if the components are functionally related. But Lev (1974) finds these criteria inadequate. He thinks that the relationship generally .sought is not the one between the numerator and the denominator but that between the ratio and some otlier economic indicator. Also he classifies the ratios according to the different economic aspects of the firm's operations: (a) profitability ratios, (b) short-term solvency (liquidity) ratios, (c) long-term solvency ratios, and (d) efficiency (turnover) ratios. This classification also serves to the needs of different users. Then he examines each ratio in two ways: (a) a time-series analysis, and (b) a cross- sectional analysis. In cross-sectional analysis he points out the arguments about the comparability of firms. If the firms: (a) belong to the same industry, (b) are of similar size, (c) use similar accounting methods, and (d) are located in the same geographical area then comparability is believed to be enhanced. But he explains that there is only little evidence to indicate that violating the comparability criteria will seriously disrupt financial statement analysis. He al.so points out the firm-size effect on ratios, which was summarized by Horrigan as follows:
Short-term liquidity ratios are related to the size of firm in a positive, parabolic manner. That is, the relationship is positive for smaller firms and negative for larger firms.
- Long-term solvency ratios are also related to size of firm in a positive parabolic manner.
Capital turnover ratios all vary inversely with size of firm. Profit margin ratios vary directly with size of firm.
Return on investment ratios also vary directly with size of firm.
Lev (1974) also indicates two other analysis while examining ratios; (a) residual method which is a combination of time-.series and cross-.sectional analysis generally used for studying the behavior of stock prices, and (b) multivariate ratio analysis in which several ratios are combined into a model or an index providing a unique signal.
Ratio analysis and cash flow analysis are the two principal tools of financial analysis according to Palepu, Bernard and Healy (1996). The relations between various line items are examined by ratio analysis. Cash flow analysis allows the analyst to examine the firm's liquidity and how the firm is managing its operating, investing, and financing cash flows. Then they set the objective of ratio analysis as evaluating the effectiveness of the firm's policies in four areas. They are (1) operating management, (2) investment management, (3) financing strategy, and (4) dividend policies that help to achieve the growth and profit targets. And they mainly categorized the ratios according to these areas. While analyzing the ratios they thought that the analyst can (a) make a time-series comparison, (b) cross-.sectional comparison, and/or (c) compare ratios to some absolute benchmark.
Gardiner (1995) uses five categories while evaluating the financial performance of a firm by using financial ratios. They are: (1) evaluation of an enterprise's liquidity and solvency, (2) judgement of its asset management and efficiency, (3) consideration of its gearing, (4) appreciation of its profitability, and (5) awareness of its stock market valuation and potential.
Giacomino and Mielke (1993) points out the importance of cash flow ratios. An important development was the preparation of cash flow statement but little has been done about cash flow ratios to date. Indeed cash flow from operations shows the primary activities of the firms sucii as the production and delivery of goods and .services. So nine ratios using the data in cash flow statement are classified in two groups and used in the study. The groups are sufficiency ratios that evaluate the adequacy of cash flows for meeting a company's needs and efficiency ratios that evaluate how well the company generates cash flows relative to other years and other companies. And it was found that these ratios provide additional information (over traditional financial ratios) about the relationship between cash flow from operations and other important operating variables.
In their study Thanas.soulis, Bous.sofiane and Dyson (1996) compare data envelopment analysis (DEA) and ratio analysis as alternative tools for assessing the performance of organizational units such as bank branches and schools. DEA is a linear programming based method designed to assess the relative efficiencies of decision making units. The two methods were compared in two dimensions: (1) the measure or measures of performance, and (2) the targets they provide. It is found that the two methods agree reasonably closely on performance of the units as a whole but disagree substantially on the relative performance of individual units. Also it is found that ratio
analysis, unlike DEA, is not suitable for setting targets so that units can become more efficient. But ratios provide useful information about performance of a unit and when two methods agree on performance ratios support the communication of DEA results to non specialists. So if they are used jointly they would support each other.
Sudarsanam and TafUer (1995) studied financial ratio proportionality and inter temporal stability. For a large sample of 514 companies, twenty-four ratios are considered and separate analyses are done in six industries. It is found that the proportionality condition is not satisfied for any of the ratios examined. For the ratio component relationship, loglinearity is a better de.scription and it supports the use of industry median in ratio analysis. Also great care is necessary in the use of ratios in inter industry and inter-temporal comparisons because there occurs a huge variation in the functional relationship of ratio components between one industry and another and over time.
Holmes and Sugden (1986) mention the relationship between ratios and inflation. When discussing past data, where both items in a ratio are monetary and are expressed in monetary terms of same date, dividing one term by the other removes the direct effect of inflation.
Hawkins (1986) points out the limitations of ratio analysis in his study as: (1) Ratio analysis deals with only quantitative data, not qualitative data. (2) To influence the ratios, short-run actions can be taken near to the statement dates. (3) Because of accounting differences, comparisons between companies could be misleading. (4) Different analysts use different definitions of common ratios. (5) Since the effect of inflation is not included in the ratios, it would distort the comparability of the ratios computed for different time
periods. (6) A ratio standing alone has no significance so ratios must be evaluated in their business context. (7) Since the ratios show the relationship in the past, it may not reflect the current or future position. Because of these limitations, ratio analysis must be used wisely to be a useful analytical tool.
Becau.se of its limitations Akgüç (1990) .states the important points while using ratio analysis. He explains the points as: (I) Meaningle.ss ratios mustn't be used in the analysis. (2) Ratios mustn't be interpreted wrongly. (3) While evaluating tlie ratios, .sea.sonal and conjectural changes must be took into consideration. (4) Changes in a ratio could occur becau.se of changes in numerator or denominator or both. (5) While interpreting ratios, other data from different sources must be considered. (6) Réévaluation of the statements must be considered while interpreting the ratios. (7) While evaluating a company according to the ratios, the ratios of other companies and industry average must be examined concurrently. (8) While comparing companies, the accounting and policy differences between companies shouldn't be forgotten. (9) Ratios show the performance of the companies in the past. But the important thing is what will happen in the future.
Akgüç ( 1990) also points out the difference between mean and median while finding the industry average. Usually median is used for finding the industry averages. Median is useful especially if standard error is large. But if standard error is low then mean can be used for finding the industry average.
In his study about the financial ratio patterns in the U.S. defense industry, Gürsoy (1994) uses fifteen financial ratios in four main categories including the period from 1983 to 1992. Only defense industry is analyzed and just thirty-eight firms of the U.S. defense Industry are examined. And the findings are briefly as:
The profitability decreases during the test period. Efficiency of firms differs between the resources. The amount of debt increases during the test period.
Generally the level of liquidity of the industry is lower than the rule of thumb.
4 . DATA
In this study dciense industry is compared with a control group for the period 1994 to 1998. Both groups contain 30 companies. The companies in defense sector are chosen from the Turkish Defense Industry Products Catalogue (1999-2000) that was distributed by Undersecretariat for Defense Industries. The two important criteria in choosing the defense companies are; (a) Industry: the companies are chosen from different .sectors to diversify the sample; and (b) Total assets; the companies are cho.sen with different total assets to get companies with different sizes. The control group firms are matched with the defense industry companies in terms of the industries and the 1998 total as.sets of the defense companies.
In the sample of control group, there are 18 firms in machine manufacturing, 2 firms in textile, 1 firm in energy, I holding company, 1 firm in rock and land related manufacturing, 3 firms in chemistry and 4 firms in metal .sector. On the other hand the sample of defense sector has 23 firms in machine manufacturing, 1 firm in textile, 1 firm in rock and land related manufacturing, 1 firm in chemistry and 4 firms in metal .sector. Besides, in personal interview the general secretary of the Defense Industry Association .stated that about 40% of the .sales ofdefen.se firms in Turkey is directly related to defense products.
The audited annual financial statements of defense sector and control group are used. Financial statements of 11 companies are collected from firms, and the remaining financial statements are obtained from Istanbul Stock Exchange databases*.
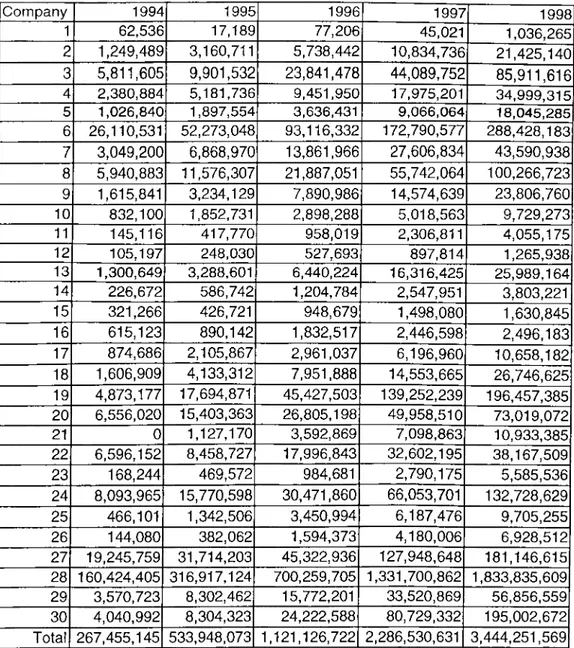
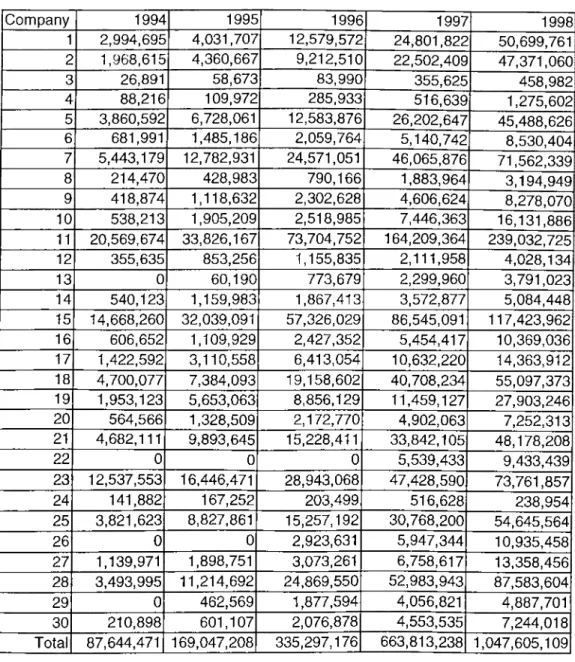
The sales of control group are given in Table-1 and the sales of defense sector are given in Table-2.
Table 1: Sales of control group (million TL)
Company 1994 1995 1996 1997 1998 1 62,536 17,189 77,206 45,021 1,036,265 2 1,249,489 3,160,711 5,738,442 10,834,736 21,425,140 3 5,811,605 9,901,532 23,841,478 44,089,752 85,911,616 4 2,380,884 5,181,736 9,451,950 17,975,201 34,999,315 5 1,026,840 1,897,554 3,636,431 9,066,064 18,045,285 6 26,110,531 52,273,048 93,116,332 172,790,577 288,428,183 7 3,049,200 6,868,970 13,861,966 27,606,834 43,590,938 8 5,940,883 11,576,307 21,887,051 55,742,064 100,266,723 9 1,615,841 3,234,129 7,890,986 14,574,639 23,806,760 10 832,100 1,852,731 2,898,288 5,018,563 9,729,273 11 145,116 417,770 958,019 2,306,811 4,055,175 12 105,197 248,030 527,693 897,814 1,265,938 13 1,300,649 3,288,601 6,440,224 16,316,425 25,989,164 14 226,672 586,742 1,204,784 2,547,951 3,803,221 15 321,266 426,721 948,679 1,498,080 1,630,845 16 615,123 890,142 1,832,517 2,446,598 2,496,183 17 874,686 2,105,867 2,961,037 6,196,960 10,658,182 18 1,606,909 4,133,312 7,951,888 14,553,665 26,746,625 19 4,873,177 17,694,871 45,427,503 139,252,239 196,457,385 20 6,556,020 15,403,363 26,805,198 49,958,510 73,019,072 21 0 1,127,170 3,592,869 7,098,863 10,933,385 22 6,596,152 8,458,727 17,996,843 32,602,195 38,167,509 23 168,244 469,572 984,681 2,790,175 5,585,536 24 8,093,965 15,770,598 30,471,860 66,053,701 132,728,629 25 466,101 1,342,506 3,450,994 6,187,476 9,705,255 26 144,080 382,062 1,594,373 4,180,006 6,928,512 27 19,245,759 31,714,203 45,322,936 127,948,648 181,146,615 28 160,424,405 316,917,124 700,259,705 1,331,700.862 1,833,835,609 29 3,570,723 8,302,462 15,772,201 33,520,869 56,856,559 30 4,040,992 8,304,323 24,222,588 80,729,332 195,002,672 Total 267,455,145 533,948,073 1,121,126,722 2,286,530,631 3,444,251,569 liUp://www.iinkb.g()v.(r 20
Table 2: Sales of defense sector (million TL) Company 1994 1995 1996 1997 1998 1 2,994,695 4,031,707 12,579,572 24,801,822 50,699,761 2 1,968,615 4,360,667 9,212,510 22,502,409 47,371,060 3 26,891 58,673 83,990 355,625 458,982 4 88,216 109,972 285,933 516,639 1,275,602 5 3,860,592 6,728,061 12,583,876 26,202,647 45,488,626 6 681,991 1,485,186 2,059,764 5,140,742 8,530,404 7 5,443,179 12,782,931 24,571,051 46,065,876 71,562,339 8 214,470 428,983 790,166 1,883,964 3,194,949 9 418,874 1,118,632 2,302,628 4,606,624 8,278,070 10 538,213 1,905,209 2,518,985 7,446,363 16,131,886 11 20,569,674 33,826,167 73,704,752 164,209,364 239,032,725 12 355,635 853,256 1,155,835 2,111,958 4,028,134 13 0 60,190 773,679 2,299,960 3,791,023 14 540,123 1,159,983 1,867,413 3,572,877 5,084,448 15 14,668,260 32,039,091 57,326,029 86,545,091 117,423,962 16 606,652 1,109,929 2,427,352 5,454,417 10,369,036 17 1,422,592 3,110,558 6,413,054 10,632,220 14,363,912 18 4,700,077 7,384,093 19,158,602 40,708,234 55,097,373 19 1,953,123 5,653,063 8,856,129 11,459,127 27,903,246 20 564,566 1,328,509 2,172,770 4,902,063 7,252,313 21 4,682,111 9,893,645 15,228,411 33,842,105 48,178,208 22 0 0 0 5,539,433 9,433,439 23 12,537,553 16,446,471 28,943,068 47,428,590 73,761,857 24 141,882 167,252 203,499 516,628 238,954 25 3,821,623 8,827,861 15,257,192 30,768,200 54,645,564 26 0 0 2,923,631 5,947,344 10,935,458 27 1,139,971 1,898,751 3,073,261 6,758,617 13,358,456 28 3,493,995 11,214,692 24,869,550 52,983,943 87,583,604 29 0 462,569 1,877,594 4,056,821 4,887,701 30 210,898 601,107 2,076,878 4,553,535 7,244,018 Total 87,644,471 169,047,208 335,297,176 663,813,238 1,047,605,109
Total assets of control group are given in Table-3 and total assets of defense sector are given in Table-4.
Table-3; Total assets of control group (million TL) Company 1994 1995 1996 1997 1998 1 120,043 252,524 382,934 705,705 1,051,004 2 1,028,039 2,257,901 5,322,694 10,469,049 19,276,537 3 2,708,318 3,925,609 11,722,995 22,580,905 35,452,290 4 1,276,930 3,223,157 6,522,582 12,432,078 21,212,359 5 765,597 1,899,742 9,103,619 16,979,506 35,778,021 6 14,285,665 25,411,679 49,634,037 98,127,841 157,559,387 7 2,577,675 4,123,738 7,593,444 16,717,331 27,774,845 8 3,892,495 7,686,637 18,933,973 34,721,180 67,905,769 9 1,425,729 3,204,574 5,057,782 10,798,799 17,918,036 10 662,307 1,291,020 2,191,852 4,438,509 6,098,140 11 125,325 318,705 836,160 2,192,590 4,168,545 12 166,526 327,961 511,970 1,362,664 2,586,364 13 1,049,372 2,497,777 6,023,175 13,754,429 28,951,109 14 148,154 479,322 1,132,836 2,147,294 3,870,536 15 500,614 717,003 1,278,496 1,493,320 2,190,295 16 974,945 1,042,189 2,246,910 3,179,875 3,971,619 17 333,145 788,727 1,436,976 3,053,977 5,595,040 18 970,208 2,420,621 4,319,187 r 7,629,826 13,752,713 19 3,038,597 9,222,858 25,515,057 65,940,123 89,397,783 20 3,167,398 6,984,708 11,752,499 26,106,282 43,787,585 21 0 1,099,219 1,786,126 6,235,360 9,718,388 22 6,552,023 9,855,166 17,174,677 32,122,317 54,441,244 23 88,894 216,240 559,082 3,116,199 4,338,353 24 5,197,811 8,821,576 16,751,098 41,415,067 99,601,478 25 604,934 1,705,862 3,421,751 7,701,336 10,885,031 26 189,402 361,412 1,017,345 2,581,476 6,255,427 27 3,529,218 6,436,229 7,613,154 26,660,234 31,231,627 28 38,725,179 73,560,941 152,343,443 249,290,758 502,555,308 29 2,572,959 5,243,963 9,837,745 20,737,457 40,678,896 30 2,933,927 7,224,662 20,139,397" 82,302,710 145,587,973 Total 99,611,429 192,601,722 402,162,996 826,994,197 1,493,591,702 22
Table-4: Total assets of defense sector (million TL) Company 1994 1995 1996 1997 1998 1 2,329,419 3,647,743 9,093,094 17,694,066 39,374,210 2 1,069,371 2,870,845 5,204,837 14,820,208 30,780,945 3 28,407 73,474 140,857 289,324 338,240 4 66,248 120,981 199,001 318,221 718,576 5 5,201,063 9,242,974 18,808,205 37,548,587 67,206,415 6 590,309 729,220 1,207,454 2,912,687 5,576,051 7 5,779,636 11,962,331 23,283,028 43,702,227 66,380,744 8 157,963 341,296 622,978 1,386,139 2,129,359 9 299,945 709,604 1,946,481 4,103,223 10,082,633 10 419,283 893,170 1,853,017 3,877,479 7,179,998 11 42,954,835 77,770,131 139,993,258 237,926,262 386,597,361 12 1,006,836 1,820,631 2,535,774 3,832,699 5,413,711 13 0 151,474 1,033,483 3,155,789 12,190,136 14 523,579 1,263,712 1,807,052 2,956,183 2,784,963 15 21,322,195 39,286,324 76,177,183 128,197,358 160,699,574 16 721,637 1,502,326 3,263,556 7,170,645 17,722,520 17 1,354,325 2,220,966 3,739,352 6,779,575 9,940,504 18 7,040,897 9,882,761 18,364,247 28,485,541 41,842,306 19 1,248,867 2,527,526 3,614,925 6,185,830 19,389,947 20 433,128 850,209 1,658,101 3,644,006 7,938,537 21 2,132,991 3,594,642 5,964,666 12,328,138 21,066,889 22 0 0 0 11,938,845 23,603,433 23 16,141,324 21,550,626 30,511,753 40,709,227 44,287,432 24 737,552 751,654 720,643 516,393 27,366 25 5,217,329 13,689,240 22,524,588 39,522,628 80,587,081 26 0 0 4,890,954 9,030,332 15,925,309 27 1,167,935 1,707,433 2,617,262 4,191,683 6,908,004 28 1,687,411 5,851,211 13,046,468 24,094,425 38,091,166 29 0 560,171 1,455,369 3,756,061 4,661,535 30 146,114 339,055 754,887 2,465,797 4,132,907 Total 119,778,600 215,911,730 397,032,474 703,539,578 1,133,577,850 23
Mean and median of total assets of both sectors are shown in Table-5.
Table-5: Mean and median of total assets (million TL)
1994 1995
Control Group Defense Sector Control Group Defense Sector Mean 3,434,877 4,606,869 6,420,057 7,711,133 Median 1,049,372 1,118,653 2,459,199 1,764,032
1996 1997
Control Group Defense Sector Control Group Defense Sector Mean 13,405,433 13,690,775 27,566,473 23,451,319 Median 5,672,935 3,263,556 11,615,439 6,482,703
1998
Control Group Defense Sector Mean 49,786,390 37,785,928 Median 20,244,448 14,057,722
Mean and median of sales of both .sectors are shown in Table-6.
Table-6: Mean and median of .sales (million TL)
1994 1995
Control Group Defense Sector Control Group Defense Sector Mean 9,222,591 3,370,941 17,798,269 6,037,400 Median 1,606,909 1,281,282 3,261,365 1,901,980
1996 1997
Control Group Defense Sector Control Group Defense Sector Mean 37,370,891 11,561,972 76,217,688 22,127,108 Median 7,165,605 2,923,631 14,564,152 6,352,980
1998
Control Group Defense Sector Mean 114,808,386 34,920,170 Median 24,897,962 12,146,957
5. METHODOLOGY
In this study the most common ratios in the literature are selected for analysis. Increasing the number of ratios will cause information overload and therefore will not be useful in making decisions based on the outcomes of the analysis. They are examined in four main categories. The categories are;
(a) Liquidity ratios: Indication of the firm's ability to meet its short-term financial obligations. It is especially important for short-term lenders, such as banks and merchandise suppliers (Lev 1974, p.22).
(b) Leverage ratios: Leverage ratios indicate the firm's ability to meet both the principal and interest payments on long-term obligations. These ratios stress the long- run financial and operating structure of the firm (Lev 1974, p.24-25).
(c) Profitability ratios: The lirm's operational performance is evaluated by these ratios. These ratios indicate the firm's efficiency in using the capital committed by stockholders and lenders (Lev 1974, p. 15).
(d) Efficiency ratios: By using these ratios the efficiency of specific assets are measured instead of overall efficiency of assets. So for calculating ratios u.sually the sales figure is used in the numerator and the balance of an asset in the denominator (Lev 1974, p.27).
The formulas of the selected ratios in each category are given in appendix.
In this study two main approaches are used, (a) The ratios are computed for every firm. Then, in each sector the means and medians of these ratios are calculated for every year. Moreover, by using the.se figures the financial performance of the industries are determined. 'I'hen a time-series analysis in each sector and a cross-.sectional comparison between the industries are carried out. (b) In each sector, for every ratio, the five-year ratio values of the companies are gathered. And the overall means and medians of these ratio values are found. These overall means and medians are used for evaluating the financial performance of the industries. Then a cross-sectional comparison is done according to these figures.
In .statistical tests two-tailed Mann-Whitney lest is u.sed to compare the medians of each year's financial ratio values. "This is one of the most powerful of the nonparametric tests, and is a very useful alternative to the parametric t test when the re.searcher wishes to avoid the t test's assumptions or when the measurement in the research in weaker than interval .scaling" (Siegel 1988, p. 128-129). The null hypothesis is that defen.se sector and control group have the same distribution.
As regards comparing the overall means of both industries, two-tailed t-te.st is used. The null hypothesis is that defense sector and control group don't have any significant difference.
The results are examined in four main categories. They are; 1) Liquidity ratios
2) Leverage ratios 3) Profitability ratios 4) Efficiency ratios
Means, medians and significance levels of all ratios are given from Table-7 to Table-23.
6.1 Liquidity ratios:
By using these ratios the firm’s ability to meet its short-term financial obligations are indicated. These ratios indicate how well the organization manages its working capital and operating cycle. If the ratio is loo low then it means that there will be problems in payments of the loans but if the ratio is too high then it means that the management of liquid assets could be improved.
6.1.1 Current ratio:
Current ratio measures the ability to meet short-term obligations. It was the only ratio used to evaluate the credit worthiness of the firms in the early times of financial analysis. Even today it is the best known measure of liquidity.
6. RESULTS
The generally accepted standard of current ratio is two. If the ratio is low, the company may not be able to pay off bills as rapidly as it should. But if it is too high, it would mean that the money that would be working for the business is tied up in government securities, cash savings, or other safe funds (Gill 1990, p.36).
By analyzing means and medians of both .sectors, the conditions of industries are examined. The results and the significance levels are provided in Table-7.
Table-7: Results of current ratio
Current ratio 1 9 9 4 1 9 9 5 1 9 9 6 1 9 9 7 1 9 9 8 Overall
Control group n 29 30 30 30 30 mean 1.723 1.784 2.000 2.037 1.737 1.853 median 1.657 1.624 1.622 1.395 1.385 1.508 Defense sector n 26 28 29 30 30 mean 1.586 1.514 1.552 1.680 1.705 1.625 median 1.411 1.410 1.506 1.761 1.618 1.505
Except the means of control group in 1996 and 1997, all the other ratios are lower than two. Therefore, the levels of current ratios for both industries are not generally suitable according to the rule of thumb. Then it means that the firms would have difficulties in short-term payments.
In the test period both industries generally have an inclining trend until 1997, then a declining trend. So they are getting worse at the end of the test period. However, on average control group seems to have more ability to meet short-term obligations during the test period.
In overall calculations the ratios of control group are slightly higher than defense .sector, but still lower than the rule of thumb to be enough for short-term payments.
In countries like Turkey there is a widespread usage of current liabilities. Therefore 1.5 for current ratio would be enough (Sevilengiil 1993, p. 159). According to this level the abilities of both industries to meet short-term obligations are adequate on average.
No significant difference is found between industries according to the statistical tests.
6.1.2 Quick (acid-test) ratio:
Quick ratio is the same as the current ratio except inventories. While examining the near term liquidity, quick ratio is the best measure since it deals with those as.sets that can be converted to cash in a short time. This ratio therefore provides a stricter test of liquidity than the current ratio (Lev 1974, p.23).
The rule of thumb for quick ratio is one. If it is lower than one, it means that the firm is dependent on the inventories. So inventories for sale get more importance.
By analyzing means and medians of both sectors, the conditions of industries are examined. The results and the significance levels are given in Table-8.
Table-8: Results of quick ratio
Quick ratio 1994 1995 1996 1997 1998 Overall Control group n 29 30 30 30 30 mean 1.143 1.286 1.476 1.530 1.308 1.348 median 1.127 1.045 1.053 0.946 1.028 1.037 Defense sector n 26 28 29 30 30 mean 1.020 1.010 1.056 1.170 1.088 1.084 median 0.838 0.978 1.009 1.134 0.956 0.979
Except the medians of defense .sector in 1994, 1995 and 1998 and the median of control group in 1997 all other ratios are higher than one. On the contrary of current ratio
the levels of quick ratio for both industries are generally suitable according to the rule of thumb. Therefore, it can be concluded that the firms in both industries may not have problems in near term liquidity.
Both industries generally have an inclining trend until 1997, but a declining trend after then. Consequently, it can be seen that after 1997 both sectors are getting worse in near term liquidity. But on average control group seems to be in a better position then defense sector.
In overall calculations the median of control group is slightly higher than defense sector. But the mean of control group is 25% higher than defen.se .sector. According to the rule of thumb generally both sectors are good in near term liquidity, but control group has better position than defense sector.
According to the statistical tests there is no significant difference between industries.
6.1.3 Cash ratio:
"Cash and marketable securities form an important reservoir that the firm can u.se to meet its operating expenditures and other cash obligations when and as they fall due" (Foster 1986, p.60). More then a 20% is desired for cash ratio (Bektore 1998, p.245).
A high cash ratio means there is enough cash resource available to the firm. It may also indicate the firm is not using its cash in an optimum way. If there is a too low cash ratio, there may be problems with payments.
By analyzing means and medians of both sectors, the conditions of industries are examined. The results and the significance levels are given in Table-9.
Table-9: Results of cash ratio Cash ratio 1 9 9 4 1 9 9 5 1 9 9 6 1 9 9 7 1 9 9 8 Overall Control group 29 30 30 30 30 mean 0.153 0.077 0.108 0.060 0.153 median 0.031 0.033 0.035 0.021’ 0.026* 0.109* 0.029 Defense sector n 26 28 29 30 30 mean 0.160 0.219 0.197 0.190 0.196 median 0.059 0.085 0.053 0.061’ 0.156* 0.189* 0.070 t * ) = 0.01<sig.<= 0.05 ( ** ) = sig,<= 0.01
All the ratios are lower than 20% apart from the mean of (lefcn.se sector in 1995. However, average of defen.se sector is very close to the 20% level. Hence it seems that defense .sector has an adequate cash position. According to the trends of industries, it can be stated that defense sector is getting better in cash position. On the other hand, control group generally doesn’t have as good cash position as the defen.se sector.
Mann-Whitney test was used to compare the medians of sectors from 1994 to 1998. No significance was found in 1994, 1995 and 1996. But in 1997 and 1998 significances were experienced. So the null hypothesizes can be rejected in 1997 and 1998. This indicates that there is a significant difference in the cash ratio levels between sectors in these years. Also it is seen that while median of defense sector is increasing after 1996, median of control group is decreasing. And after 1997 while median of defense sector has a sharp upward trend, median of control group is slightly increasing. So after 1996 cash ratios of both sectors are differentiating from each other.
A t-test was used to compare the overall means of sectors. As signif icances found in 1997 and 1998 in Mann-Whitney test, also significance was found in t-test between the overall .sector means. Since the difference between .sectors is significant, the null
hypothesis can be rejected. And this refers that there is a significant difference in the cash ratio levels between the .sectors.
6.1.4 Inventories / A.ssets ratio:
Inventories / assets ratio provides information about the proportion of inventories in total assets. Since inventories are less liquid than other current assets this ratio may help the analyst to conclude about the liquidity of the firm.
By analyzing means and medians of both sectors, the conditions of industries are examined. The results and the significance levels are provided in Table-10.
Table-10: Results of inventorie.s/assets ratio
lnvent./Assets ratio 1994 1995 1996 1997 1998 Overall
Control group n 29 30 30 30 30 mean 0.232 0.225 0.227 0.218 0.173 0.215 median 0.222 0.206 0.207 0.196 0.170 0.204 Defense sector n 26 28 29 30 30 mean 0.223 0.221 0.210 0.213 0.217 0.215 median 0.184 0.196 0.169 0.198 0.201 0.193
The calculated ratios are between 16% and 23%. During the test period control group has shown a downward trend. The defense sector companies also had downward trend until 1996, but upward trend after. Especially in 1998, defense sector has values greater than 20% while control group has values lower than 20%. Furthermore, according to 1998 data control group is using fewer inventories. So the.se figures indicate that while control group is decreasing the amount of inventories in total assets, delen.se .sector is increasing its inventories at the end of the test period.
In overall calculations both means are the same. But medians of both sectors slightly differ, in that median of control group is greater than defense sector. It may point that control group is using slightly more inventories than defense sector in their total assets.
No significant difference is found between industries according to the statistical tests.
6.2 Leverage ratios:
Leverage ratios show the amount of nonequity capital that is used to finance the assets of the firm. High values of these ratios indicate high proportion of assets financed by nonshareholder parties (Foster 1986, p.65).
It is obvious that when the percentage of owners’ equity increases, the financial structure of the firm gets stronger and the risk of lenders decrease. Up to the firms’ risk limit, increase of liabilities would also increa.se the profitability (Sevilengiil 1993, p. 163).
Debt financing policy has several potential benefits (Palepu 1996, p.4-I4): - Debt is typically cheaper than equity.
In most countries, interest on debt financing is tax deductible.
Debt financing can impose di.scipline on the firm’s management and motivate it to reduce wasteful expenditures.
It is often easier for management to communicate its proprietary information on the firm’s strategies and prospects to private lenders than to public capital markets.
6.2.1 Debt ratio:
Debt ratio is the first and broadest test of leverage ratios. It describes the proportion of short- and long-term liabilities in total assets. The higher the debt ratio, the greater the likely risk for the lender. Generally the desired value of the debt ratio is 50% (Sevilengul
1993, p. 165).
By analyzing means and medians of both sectors, the conditions of industries are examined. The results and the significance levels are given in Table-11.
Table-11: Results of debt ratio
Debt ratio 1994 1995 1996 1997 1998 Overall
Control group n 29 30 30 30 30 mean 0.567 0.592 0.619 0.651 0.634 0.612 median 0.530 0.557 0.600 0.646 0.618 0.609 Defense sector n 26 28 29 30 30 mean 0.624 0.652 0.699 0.706 0.650 0.653 median 0.507 0.511 0.562 0.519 0.537 0.531
All ratios are over 50% in the te.st period. So, the levels of debt ratios for both industries are not suitable. However, in countries like Turkey there is a widespread usage of liabilities. Consequently, the value of debt ratio up to 60% is acceptable in Turkey. And in overall calculations except median of defense .sector, all other ratios are above 60%. Therefore, it indicates that generally both sectors are using high amount of debt, and that there is a risk in both industries for the lender.
In the te.st period both industries generally have the same trend. They have an upward trend until 1997, then have a declining trend. It means that they are decreasing the percentage of debts after 1997. Also the cash ratios show that generally both industries are getting better in cash positions at the end of the test period.
In overall calculations the debt usage differs according to mean and median as it occurred during the test period. Means indicate that defense sector uses more debt than the control group, while median values show that control group uses more debt than defense sector.
Statistical tests indicate no significant difference between the industries. 6.2.2 Debt to equity ratio:
The proportion of short and long-term debt to owners’ equity is expressed as debt to equity ratio. "Debt to equity ratio, indicating the firm’s capital structure, is also a measure of the financial risk as.sociated with the common .stocks." This ratio with some shortcomings is widely used as an indicator of lenders’ risk (Lev 1974, p.25).
In general accepted standard for this ratio is one (Sevilengiil 1993, p. 165). If the ratio is high, it means that lenders are having greater risk and firm’s ability to obtain money from outside resources is limited. On the contrary if the ratio is low it can be assumed that the firm has flexibility to get credit and lenders’ have less risk, but still the firm is not reaching its full profit potential.
By analyzing means and medians of both .sectors, the conditions of industries are examined. The results and the significance levels are given in Table-12.
Table-12: Results of debt to equity ratio
Debt to equity ratio 1994 1995 1996 1997 1998 Overall
Control group n 28 29 29 28 29 mean 1.832 4.285 3.470 2.648 3.402 3.127 median 1.139 1.195 1.441* 1.671* 1.611 1.462 Defense sector n 24 26 25 27 28 mean 1.603 4.552 1.378 2.674 1.646 2.371 median 1.336 1.044 1.182* 0.910* 1.005 1.086 ( * ) = 0.0l<sig.<= 0.05 .'t 5
Only the median of defense sector in 1997 is lower than one. Then, it seems that the debt usage is high. Therefore, there is a risk for lenders. Also as it is explained before the high debt ratios indicate the same result for both industries.
Neither the means of the control group nor defense sector show a trend in the test period. But medians of both control group and defense sector have an upward trend. So, according to medians it can be concluded that the proportion of debt to equity is increasing, which means the risk of lenders is growing for most of the companies. And according to medians, majority of control group uses more debt than defense sector in the test period.
In 1995 mean of defense sector experienced an extremely high value. Also mean of control group experienced a near high value. However, the medians of both sectors are not as high as means. So this difference may be caused by extreme values in the data set.
In overall calculations the means indicate great risk for both industries owing to their usage of high amount of debt. But control group is more risky than defense sector. On the other hand by regarding medians the debt usage ofdefen.se sector seems to be adequate.
In Turkey, an acceptable debt to equity ratio is up to the proportion of 60/40 (Sevilengiil 1993, p. 165). According to this rule, if medians are taken as the base it can be concluded that the debt usage of both sectors are adequate.
Mann-Whitney test was used to compare the medians of sectors from 1994 to 1998. No significance is found in 1994, 1995 and 1998, then the null hypothesis can’t be rejected in the.se years. Nevertheless, in 1996 and 1997 significances are found and the null hypothesizes can be rejected. And this indicates that there is a significant difference in the debt to equity ratio levels between sectors in these years.
In debt ratio, according to medians it is seen that control group uses more debt than defense sector. Moreover, in debt to equity ratio according to medians control group is always using more debt than defense sector in the test period, and significances are found. In addition, owners' equity turnover ratio shows that control group may have less owners' equity and more debt than defen.se .sector, and significant difference is observed in this ratio as well.
6.2.3 Current liabilities / total debt ratio:
This ratio shows the formation of debts according to their duration. Since most Turkish firms have a tendency towards short-term debts, in Turkey this ratio is found to be high Li.sually (Sevilengtil 1993, p. 167).
By analyzing means and medians of both sectors, the conditions of industries are examined. The re.sults and the significance levels are given in Table-13.
Table-13: Results of Current liabilities / total debt ratio
Cur.Lia./T.Debt ratio 1994 1995 1996 1997 1998 Overall
Control group N 29 30 30 30 30 Mean 0.832 0.856 0.780 0.773 0.778 0.803 Median 0.851 0.877 0.792 0.830 0.802 0.840 Defense sector N 26 28 29 30 30 Mean 0.796 0.834 0.807 0.803 0.771 0.804 Median | 0.834 0.867 0.875 0.849 0.823 0.839
All calculated ratios are between 77% and 88% in the test period. As it is explained before these ratios are quite high in Turkey. So they indicate great amount of short-term debt usage. Also liquidity ratios indicate that there would be shortcomings in
short-term payments. So these figures point out some problems connected to this financing policy.
Both industries commonly have an upward trend from 1994 to 1995, but a downward trend after. And at the end of the te.st period the ratios are between 77% and 82% with slight decrea.se. Nonetheless, defense sector seems to have more short-term debt than control group on average.
In overall calculations the ratios of both industries are neai ly the same. And all the ratios are between 80% and 84%. Since the.se values are rather high, it can be concluded that both industries use a great amount of short-term debt for financing the firms. Statistical te.sts did not show any significant differences either.
No significant difference is found between industries according to the statistical te.sts.
6.2.4 Property, plant, and equipment / Owners' equity ratio:
This ratio provides information about how property, plant, and equipment are financed. If it is less than one, it indicates that property, plant, and equipment are financed by owners’ equity, and also that the other part of the owners’ equity is used for other as.sets. Nevertheless, if this ratio is greater than one, it indicates that property, plant, and equipment is financed not only by owners’ equity but also by debt. And at this time the debt must be long-term debt. The rule of thumb for this ratio is usually 65%. But it differs in industries.
By analyzing means and medians of both .sectors, the conditions of industries are examined. The results and the significance levels are given in Table-14.
Table-14: Results of PPE / OE ratio PP E /O E ratio 1994 1995 1996 1997 1998 Overall Control group N Mean Median 28 29 29 28 0.535 0.638 0.966 1.038 0.417 0.432 0.496 0.535 29 0.794 0.737 0.794 0.524 Defense sector N Mean Median 24 26 25 27 0.773 2.222 0.606 1.524 0.659 0.571 0.478 0.532 28 0.665 0.626 1.158 0.575
The calculated means and medians of both sectors differ from 202% to 42%. But without the means of defense .sector the range is between 104% and 42%. Con.sequently, the latter indicates that property, plant, and equipment is financed by owners’ equity and a part of owners’ equity is generally used for other assets.
Usually there is an upward trend duiing the test period. But mean ofdefen.se .sector has sharp upward trends in 1994-1995 and 1996-1997, and downward trends in 1995- 1996 and 1997-1998. In general defen.se sector had greater ratios before but vice versa occurred at the end.
In years 1995 and 1997 property, plant, and equipment ofdefen.se .sector are financed notably by great amount of debt according to means. So it is obvious that in the.se years the financing policy of defen.se sector has .serious problems. Afso in 1996 and 1997 eontrol group had great ratios that indicates some problems.
In overall calculations it can be concluded that both industries are good at using owners’ equity in property, plant, and equipment. But only mean of defense sector has slightly greater value.
Statistical tests show no significant difference between the industries.
6.2.5 Account receivable / total assets ratio:
This ratio helps to get a conclusion about the accounts receivable policy of the firm. Also it provides information about the liquidity of the firm. Low account receivable/total assets ratio is requiied.
By analyzing means and medians of both sectors, the conditions of industries are examined. The re.sults and the significance levels are given in Table-15.
Table-15: Results of Account receivables / total assets ratio
Acc.Rec./T Ass.ratio 1994 1995 1996 1997 1998 Overall
Control group 29 30 30 30 30 mean 0.381 0.415 0.358 0.353 0.375 0.377* median 0.362* 0.429* 0.353 0.336 0.373 0.364 Defense sector n 26 28 29 30 30 mean 0.253 0.244 0.296 [ m e d i a n | 0.243** | 0.223** | 0.264 | 0.271 | 0.225 | 0.252 0.303 0.275 0.274 ( ** ) = sig.<= 0.01
The ratios of both industries have a range between 42% and 22%. But when each industry’s ranges are examined separately, it is seen that defen.se sector has a range between 30% and 22%, and control group has a range between 42% and 33%. So, it indicates that the amount of account receivable in total assets in control group is always more than defense sector at any time in the test period. And these figures indicate that control group has always more accounts receivables in their total assets, which is more risky.
In overall calculations again it occurs that defense sector is better than control group in accounts receivable policy.
Mann-Whitney test was u.sed to compare the medians of sectors from 1994 to 1998. Significance between the medians of two indu.stries is determined in 1994 and 1995. So