Contents lists available atSciVerse ScienceDirect
Physica A
journal homepage:www.elsevier.com/locate/physa
Generalized Hurst exponent approach to efficiency in
MENA markets
✩A. Sensoy
∗Borsa Istanbul, Research Department, Resitpasa Mahallesi, Tuncay Artun Caddesi, Emirgan, Istanbul, 34467, Turkey Bilkent University, Department of Mathematics, Ankara, 06800, Turkey
h i g h l i g h t s
• We study the efficiency of MENA stock markets by generalized Hurst exponents using a rolling window.
• MENA markets exhibit different degrees of long-range dependence.
• The Arab Spring has had a negative effect on efficiency.
• The least inefficient market is found to be Turkey, followed by Israel, while most inefficient markets are Iran and Tunisia.
• Turkey and Israel show characteristics of developed financial markets.
a r t i c l e i n f o
Article history:
Received 11 January 2013
Received in revised form 4 May 2013 Available online 21 June 2013
Keywords:
MENA
Generalized Hurst exponent Rolling window
Market efficiency
a b s t r a c t
We study the time-varying efficiency of 15 Middle East and North African (MENA) stock markets by generalized Hurst exponent analysis of daily data with a rolling window technique. The study covers a time period of six years from January 2007 to December 2012. The results reveal that all MENA stock markets exhibit different degrees of long-range dependence varying over time and that the Arab Spring has had a negative effect on market efficiency in the region. The least inefficient market is found to be Turkey, followed by Israel, while the most inefficient markets are Iran, Tunisia, and UAE. Turkey and Israel show characteristics of developed financial markets. Reasons and implications are discussed.
© 2013 Elsevier B.V. All rights reserved.
1. Introduction
The efficient market hypothesis (EMH) has been a highly controversial topic in theory of finance. It states that prices already reflect all known information, and in its weak form (WEMH), it suggests that all past market prices are fully reflected in asset prices, and thus one cannot beat the market by any investment strategy. According to the WEMH, the existence of serial correlations between observations is not possible. While short serial correlation is accepted by supporters of the EMH, long serial correlation is generally rejected.
The presence of long-range dependence in asset returns has been an intriguing subject for a long time. Starting with the revolutionary paper of Mandelbrot [1], the existence of long memory has been shown to exist in asset returns (see Ref. [2] and the references therein for details). Besides the violation of the EMH, the presence of long-range dependence brings out several other problems in real-life applications: the investment horizon becomes a factor in the investment risk [3], derivative pricing techniques (such as the Black–Scholes technique) may not be useful anymore, and usual tests based on the Capital Asset Pricing Model (CAPM) cannot be applied to series that have long memory [4,5].
✩ The views expressed in this work are those of the authors and do not necessarily reflect those of the Borsa Istanbul or its members.
∗Correspondence to: Borsa Istanbul, Research Department, Resitpasa Mahallesi, Tuncay Artun Caddesi, Emirgan, Istanbul, 34467, Turkey. Tel.: +90
5326959943; fax: +90 2122982189.
E-mail addresses:[email protected],[email protected],[email protected]. 0378-4371/$ – see front matter©2013 Elsevier B.V. All rights reserved.
Despite the extensive research on long-range dependence in developed markets, less is known about it in emerging ones, especially the markets belonging to the MENA region (see Refs. [6,7] and references therein). Therefore, this study intends to examine behavior of efficiency of 15 MENA stock markets. The topic is interesting, since MENA markets are expected to display some properties that are not present in developed markets, such as investors’ slow reaction to new information, the effect of highly volatile foreign capital flow, and possible severe effects of non-synchronous trading [4]. Considering the increasing dominance of MENA countries in the international arena also makes the research more important.
This study uses the generalized Hurst exponent with a rolling window approach to measure the long-range dependence.1 Combining the generalized Hurst exponent and the rolling window technique was initially suggested by Morales et al. [11] to evaluate the level of stability/instability of financial firms in the US stock market. The authors revealed that such an approach can be used as an early warning indicator for financial crises.2With an extended motivation, this study applies the same approach to stock markets in the MENA region.
Another contribution to the literature is that this study contains the largest country set among other studies on the subject, and considers a time period including the recent Arab Spring, so the external effects can be observed.
The rest of the paper is organized as follows. Section2elucidates the methodology associated with testing for time-varying long-range dependence, and Section3describes the data and presents the results. Section4gives a robustness check of our analysis, and finally Section5offers a brief conclusion.
2. Methodology
Several methods have been proposed to analyze the long-range dependence phenomenon.3 In this study, we are interested in the degree of long-range dependence of a given stochastic process S
(
t)
with t=
(
1,
2, . . . ,
1t)
defined over a time window1t with unitary time steps [11], and we use the generalized Hurst exponent H(
q)
as a measure of long-range dependence.4It is a generalization of the approach proposed in Ref. [9], and it may be evaluated using the qth-ordermoments of the distribution of increments, which is a good characterization of the statistical evolution of S
(
t)
[11,20],5Kq
(τ) =
⟨|
S(
t+
τ) −
S(
t)|
q⟩
⟨|
S(
t)|
q⟩
,
(1)where
τ
can vary between 1 andτ
max, and⟨· · ·⟩
denotes the sample average over the time window.6H(
q)
is then defined for each time scaleτ
and each parameter q asKq
(τ) ∝ τ
qH(q).
(2)H
(
q)
is computed from an average over a set of values corresponding to different values ofτ
maxin Eq.(1)[10,14].7For any value of q, H(
q) =
0.
5 means that S(
t)
does not exhibit long-range dependence, while H(
q) >
0.
5 and H(
q) <
0.
5 imply that S(
t)
is persistent and anti-persistent, respectively.3. Data and results
We consider trading-day closing values P
(
t)
of 15 MENA stock markets. The list is constructed by the widest definition of the MENA region and includes Bahrain (Bahrain Bourse All Share Index), Egypt (EGX-30), Iran (TEPIX), Israel (Tel Aviv-25), Jordan (Amman SE General Index), Kuwait (Kuwait SE Weighted Index), Lebanon (BLOM), Morocco (CFG-25), Oman (MSM-30), Palestine (Al Quds), Qatar (DSM), Saudi Arabia (Tadawul All Share Index), Tunisia (TUNINDEX), Turkey (BIST-100), and United Arab Emirates (Abu Dhabi Securities Market General Index). For comparison purposes, all stock market indexes were started and ended at 02/
01/2007 and 26/
12/2012, respectively. We use a rolling window of1t=
252 observations8that1 The generalized Hurst exponent [8] approach combines sensitivity to any type of dependence in the data and simplicity. Moreover, in contrast to the popular R/S statistics [9] approach, it does not deal with max and min functions, and thus it is less sensitive to outliers [10].
2 With a similar approach, the authors of [12] had evidence to claim that multifractal models with a constant intermittency parameter may not always be satisfactory in reproducing financial market behavior. The same approach led Barunik et al. [13] to find that the multifractality observed in financial time series is mainly a consequence of the characteristic fat-tailed distribution of the returns, and that time correlations have the effect of decreasing the measured multifractality. For other relevant works from the same team, see Refs. [10,11,14–18].
3 See Ref. [19] for a survey of these methods.
4 H(q)was introduced in Ref. [8] and recently used by Di Matteo et al. [10] to study the degree of development of several financial markets. 5 In financial applications, S(t)is taken to be log-prices.
6 Note that, for q=1, Eq.(1)describes the scaling behavior of the absolute increments, and it is expected to be closely related to the original Hurst exponent. For q=2, Kq(τ)is proportional to the autocorrelation function C(t, τ) = ⟨S(t+τ)S(t)⟩.
7 Processes with a scaling behavior of(2)may be divided into two classes: (i) unifractal processes in which H(q)is independent of q, i.e., H(q) =H, or (ii)
multifractal processes in which H(q)is not constant, and each moment scales with a different exponent. Previous research [4,5,10,15] shows that financial time series exhibit multifractal scaling behavior. If multifractality exists in stock returns, then models such as in the work of Calvet and Fisher [21] may be used for forecasting; these are competitors to ARCH and GARCH models [22].
8 The window length is chosen to be large enough that it provides satisfactory statistical significance and small enough that it retains sensitivity to changes occurring over time.
Fig. 1. Time-varying Hurst exponents H(q)with q=1 (black) and q=2 (gray).
shifts one point at a time to calculate H
(
q)
. Note that for a given time window[
t−
1t+
1,
t], relation
(2)leads to the following:ln Kq
(
t, τ) =
qH(
q)
lnτ +
C.
(3)Then H
(
q)
is estimated [10,11,14] as an average of several linear fits of Eq.(3)withτ ∈ [
1, τ
max]
andτ
maxvarying between 5 and 19 days.InFig. 1, the time-varying H
(
q)
for q=
1 and q=
2 are presented.Fig. 1also contains the line H=
0.
5 to compare the results with a theoretical efficient market. To see a clear picture of the H(
q)
distribution, non-parametric kernel density estimates are given inFig. 3.A Kruskal–Wallis non-parametric test for equality of medians reveals that the medians of H
(
1)
and H(
2)
are different with a p-value of 0.000 for each country. This suggests that studying both q=
1 and q=
2 separately may be worthwhile; on the other hand,Table 1shows that for most of the countries these two variables are highly correlated. A separate analysis will be performed in another study, and, from now on, we will focus on the case of q=
1.Table 2presents the descriptive statistics of the time-varying H(
q)
.For almost all markets, H
(
1)
displays mixed behavior in the time period considered (varying widely for some of the countries), but in general H(
1) >
0.
5, i.e., MENA markets exhibit persistent characteristics. Another observation is the effects of the Arab Spring on market efficiency. The time line is given inTable 3, and, as can be seen, not far from the beginning of the protests, the relevant markets start to diverge from efficiency, whereas the markets in Turkey, Israel, and Morocco seem unaffected. Furthermore, the markets in Turkey and Israel vary from others in their stability of H(
1)
, showing signs of developed market characteristics (seeFig. 1).Table 1
Correlation between H(1)and H(2). Market Correlation Morocco 0.930 Lebanon 0.929 Israel 0.919 Oman 0.918 Iran 0.907 Saudi Arabia 0.906 Egypt 0.904 Qatar 0.873 Palestine 0.863 Bahrain 0.859 Tunisia 0.813 Kuwait 0.808 Turkey 0.798 UAE 0.797 Jordan 0.753 Table 2
Descriptive statistics of the time-varying H(q)for q=1 and q=2.
Bahrain Egypt Iran Israel Jordan Kuwait Lebanon Morocco
q=1 q=2 q=1 q=2 q=1 q=2 q=1 q=2 q=1 q=2 q=1 q=2 q=1 q=2 q=1 q=2 Mean 0.566 0.527 0.578 0.550 0.766 0.709 0.489 0.473 0.560 0.544 0.569 0.543 0.559 0.488 0.529 0.496 Median 0.575 0.535 0.587 0.553 0.755 0.705 0.489 0.471 0.557 0.548 0.569 0.548 0.558 0.482 0.533 0.499 Max 0.653 0.619 0.689 0.636 0.899 0.819 0.588 0.565 0.691 0.621 0.647 0.648 0.688 0.634 0.632 0.604 Min 0.376 0.333 0.455 0.436 0.593 0.556 0.363 0.371 0.438 0.449 0.480 0.385 0.419 0.320 0.405 0.358 SD 0.047 0.051 0.050 0.043 0.067 0.048 0.044 0.036 0.044 0.033 0.030 0.042 0.061 0.072 0.043 0.042 Kurtosis −1.268−1.252−0.235−0.276 0.187 −0.193−0.214 0.050 0.229−0.323−0.072−0.461−0.098 0.036−0.203−0.314 Skewness 5.262 5.073 1.997 2.316 2.082 2.999 2.460 2.643 2.832 2.694 2.584 2.852 2.174 1.976 2.231 2.859 Jarque–Berra p-value 0.000 0.000 0.000 0.000 0.000 0.027 0.000 0.032 0.005 0.000 0.011 0.000 0.000 0.000 0.000 0.000 Lilliefors p-value 0.000 0.000 0.000 0.000 0.000 0.000 0.000 0.000 0.000 0.000 0.000 0.000 0.000 0.000 0.000 0.000 Shapiro–Wilk p-value 0.000 0.000 0.000 0.000 0.000 0.000 0.000 0.000 0.000 0.000 0.007 0.000 0.000 0.000 0.000 0.000
Oman Palestine Qatar Saudi Arabia Tunisia Turkey UAE
q=1 q=2 q=1 q=2 q=1 q=2 q=1 q=2 q=1 q=2 q=1 q=2 q=1 q=2 Mean 0.588 0.532 0.519 0.474 0.588 0.539 0.576 0.522 0.613 0.563 0.510 0.487 0.596 0.548 Median 0.598 0.536 0.525 0.474 0.587 0.547 0.572 0.510 0.615 0.562 0.509 0.491 0.597 0.545 Max 0.698 0.686 0.623 0.588 0.698 0.640 0.706 0.668 0.716 0.685 0.604 0.576 0.689 0.665 Min 0.409 0.303 0.357 0.307 0.498 0.419 0.439 0.354 0.474 0.368 0.432 0.384 0.449 0.412 SD 0.052 0.060 0.052 0.047 0.040 0.042 0.047 0.056 0.046 0.047 0.027 0.031 0.037 0.046 Skewness −0.566 −0.161 −0.586 −0.424 0.183 −0.564 0.133 0.169 −0.333 −0.356 0.179 −0.368 −0.388 0.083 Kurtosis 2.944 2.649 3.088 3.799 2.433 2.782 2.470 2.325 2.570 3.503 2.912 2.838 3.331 2.644 Jarque–Berra p-value 0.000 0.006 0.000 0.000 0.000 0.000 0.000 0.000 0.000 0.000 0.030 0.000 0.000 0.021 Lilliefors p-value 0.000 0.000 0.000 0.000 0.001 0.000 0.000 0.000 0.000 0.001 0.011 0.000 0.000 0.000 Shapiro–Wilk p-value 0.000 0.000 0.000 0.000 0.000 0.000 0.000 0.000 0.000 0.000 0.030 0.000 0.000 0.000 Table 3
Estimated starting date of the Arab Spring. Country Date started Tunisia 18/12/2010 Jordan 14/01/2011 Oman 17/01/2011 Egypt 25/01/2011 Bahrain 14/02/2011 Kuwait 19/02/2011 Lebanon 27/02/2011 Saudi Arabia 14/03/2011 Palestine 04/09/2012
In order to check whether these time-varying Hurst exponents are due to noise, we performed several normality tests (seeTable 2), and the results strongly suggest that these parameters are not normally distributed.9
Table 4
Ranking of MENA markets based on the distance between 0.5 and median/mean of H(1). Market Median (distance to 0.5) Market Mean (distance to 0.5) Turkey 0.5093 (0.0093) Turkey 0.5096 (0.0096) Israel 0.4891 (0.0109) Israel 0.4891 (0.0109) Palestine 0.5245 (0.0245) Palestine 0.5191 (0.0191) Morocco 0.533 (0.033) Morocco 0.529 (0.029) Jordan 0.5572 (0.0572) Lebanon 0.5588 (0.0588) Lebanon 0.558 (0.058) Jordan 0.56 (0.06) Kuwait 0.5686 (0.0686) Bahrain 0.5657 (0.0657) Saudi Arabia 0.5724 (0.0724) Kuwait 0.5688 (0.0688) Bahrain 0.5746 (0.0746) Saudi Arabia 0.5756 (0.0756) Egypt 0.5871 (0.0871) Egypt 0.5782 (0.0782) Qatar 0.5872 (0.0872) Qatar 0.5881 (0.0881) UAE 0.597 (0.097) Oman 0.5884 (0.0884) Oman 0.5976 (0.0976) UAE 0.5956 (0.0956) Tunisia 0.6152 (0.1152) Tunisia 0.6126 (0.1126) Iran 0.755 (0.255) Iran 0.7656 (0.2656)
Fig. 2. Multiple median comparison of H(1)samplings among MENA markets (at 1% significance level).
Table 4gives a ranking of the median and mean absolute deviation of the generalized Hurst exponents from efficiency indicator H
(
1) =
0.
5. It is clear that Turkey is the least inefficient market in the region, followed by Israel, Palestine, and Morocco, while the most inefficient market is Iran, followed by Tunisia, Oman, and UAE; the ranking in the middle is ambiguous. In general, the results are parallel to the size and liquidity ranking of these markets.For these rankings to be meaningful, the medians must be significantly different from each other. We perform a test to determine which pairs are significantly different, and which are not. The results are given inFig. 2, and they support the validity of our efficiency ranking, at least for the upper and lower parts of it.
4. Robustness check
For an alternative construction of the efficiency ranking, we approach to the problem from a different point of view [23–25]. For each rolling window, we calculate H
(
1)
and its standard errors by employing a pre-whitening and post-blackening bootstrap approach of Grau-Carles [26] that was also previously used in Refs. [20,27,28]. The methodology can be summarized as follows.1. Obtain the log-returns r
(
t)
from log-prices.2. Do the pre-whitening by estimating an AR
(
p)
model for log-returns with p sufficiently high (we take p from 1 to 30). The order of the AR is estimated through the Akaike information criterion.3. Obtain the residuals
ϵ(
t)
of the AR model from the historical sequence.4. Obtain the simulated innovations by bootstrapping
ϵ(
t)
using the circular block bootstrap [29], where the choice of block length is given by the rule provided in Ref. [30].105. The post-blackening is made, adding the innovations series generated by bootstrap to the model whose parameters were generated in the pre-whitening, to obtain the synthetic log-return series.
6. The synthetic log-prices are recovered recursively from bootstrap samples of synthetic log-returns. 7. For each synthetic log-prices, Hb
(
1)
is estimated.Table 5
Efficiency ranking of MENA stock markets.
Market Significant windows (5%) Significant windows (1%) Total windows Efficiency ratio (5%) (%) Efficiency ratio (1%) (%)
Turkey 177 65 1257 85.9 94.8 Israel 429 250 1216 64.7 79.4 Palestine 501 338 1167 57.1 71.0 Morocco 578 398 1226 52.9 67.5 Lebanon 741 597 1147 35.4 48.0 Jordan 811 647 1220 33.5 47.0 Egypt 869 788 1198 27.5 34.2 Saudi Arabia 944 816 1244 24.1 34.4 Bahrain 972 863 1225 20.7 29.6 Oman 986 929 1230 19.8 24.5 Kuwait 958 786 1194 19.8 34.2 Qatar 1083 979 1260 14.0 22.3 Tunisia 1131 1064 1226 7.7 13.2 UAE 1155 1088 1249 7.5 12.9 Iran 1187 1187 1187 0.0 0.0
a A significant window (α%) is a window where market efficiency is rejected at theα% significance level.
b The efficiency ratio is calculated by dividing the number of insignificant windows by the total number of windows. c The ordering from top to bottom is in descending order of efficiency based on the efficiency ratio (5%).
We run 100 bootstrap samples and estimate H
(
1)
for them. Then the standard deviation S(
Hb(
1))
of these estimates is taken as a proxy for the standard error of the generalized Hurst exponents. At the end of the process, the Wald statistic11isgiven by W
=
(
H(1)−0.5 S(Hb(1)))
2.
For each rolling window, after obtaining the Wald statistic W as explained above, we call a window ‘‘significant’’ if the null hypothesis of efficiency is rejected (naturally, we call it ‘‘insignificant’’ if efficiency is not rejected). The rolling window approach reveals how often the random walk hypothesis is rejected by the selected test statistic, and hence the percentage of subsamples with an insignificant test statistic (which we call the efficiency ratio) can be used to compare the relative efficiency of our 15 MENA stock markets. An alternative new ranking is given inTable 5, and it is strongly consistent with our previous ranking.
5. Discussion and conclusion
Market efficiency is a vital concept that is not easy to test or measure empirically. Most of the literature has focused on developed stock markets, however; the amount of literature that focuses on emerging markets is relatively small. To fill this gap, the concept of generalized Hurst exponents has been applied to MENA markets’ daily data between 2007 and 2012 by a rolling window approach. Such a time-varying approach can help us to detect the unstable times (herding behavior, market bubbles, crashes, and manipulation) in the stock markets, thus providing policy-making guidance to improve efficiency, which in its turn reduces distortions in the economy.
The results show that the MENA markets, in general, exhibit persistent characteristics. Before the Arab Spring, the markets have an evolving tendency towards efficiency, but the protests take this effect away in the majority of the markets. The efficiency of the markets has been analyzed by mean and multiple median comparison of H
(
1)
, and the least inefficient market is found to be Turkey, followed by Israel, while the most inefficient markets are Iran, Tunisia, and UAE (the robustness of the results has been checked). Furthermore, the stability of H(
1)
in the markets of Turkey and Israel differs from that of the others, showing characteristics of a developed market. This situation reveals that, even though they belong to the same region, concepts like economic management, political stability, and the risk profile of a country distinguish the efficiency levels of stock markets.Considering the efficiency rankings and the major liquidity indicators (market capitalization, trade volume, and turnover) of these markets shows that these variables play an important role in explaining the long-range dependence. However, they are very difficult to quantify in a precise way for the MENA region, and thus we cannot present an analytic comparison.
Since market efficiency implies firms being able to finance themselves using the correct cost of capital, the relatively lower inefficiency of the stock markets of Turkey and Israel reduces the cost of capital for companies that are listed in these countries. This situation eventually creates a better environment for portfolio and risk managers in decision making and risk pricing.
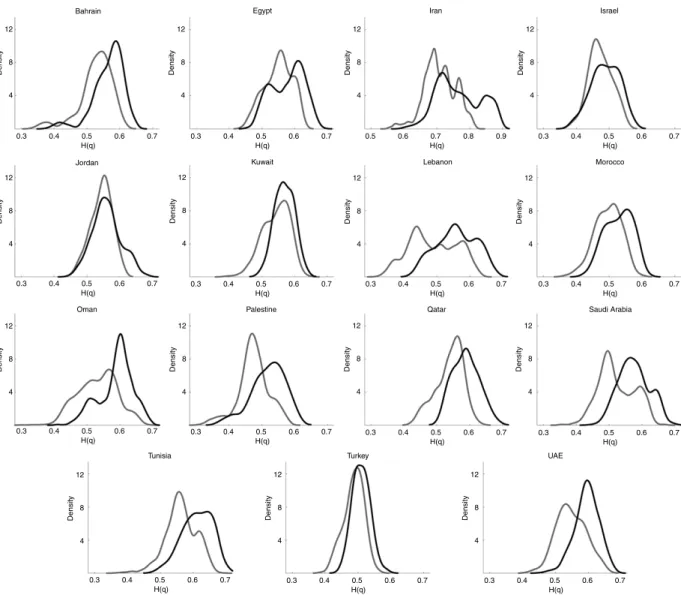
In most of the cases, the density of H
(
q)
shows bimodality. This is particularly important, since it suggests structural breaks or shifts in the price dynamics of these stock markets, possibly due to the major political changes in the region caused by the Arab Spring.Considering the increasing importance of the region in the world economy, understanding the source of long-range dependence in the region’s stock markets is certainly a topic that should require more attention. We hope that our results will be helpful for investors, policy makers, and risk and portfolio managers.
11 W has aχ2
12 8 4 Density 12 8 4 Density 12 8 4 Density 12 8 4 Density 12 8 4 Density 12 8 4 Density 12 8 4 Density 12 8 4 Density 12 8 4 Density 12 8 4 Density 12 8 4 Density 12 8 4 Density 12 8 4 Density 12 8 4 Density 12 8 4 Density 0.3 0.4 0.5 0.6 0.7 H(q) 0.3 0.4 0.5 0.6 0.7 H(q) 0.3 0.4 0.5 0.6 0.7 H(q) 0.3 0.4 0.5 0.6 0.7 H(q) 0.3 0.4 0.5 0.6 0.7 H(q) 0.3 0.4 0.5 0.6 0.7 H(q) 0.3 0.4 0.5 0.6 0.7 H(q) 0.3 0.4 0.5 0.6 0.7 H(q) 0.3 0.4 0.5 0.6 0.7 H(q) 0.3 0.4 0.5 0.6 0.7 H(q) 0.3 0.4 0.5 0.6 0.7 H(q) 0.5 0.6 0.7 0.8 0.9 H(q) 0.3 0.4 0.5 0.6 0.7 H(q) 0.3 0.4 0.5 0.6 0.7 H(q) 0.3 0.4 0.5 0.6 0.7 H(q) Bahrain Jordan
Oman Palestine Qatar Saudi Arabia
Tunisia Turkey UAE
Egypt
Kuwait Lebanon Morocco
Iran Israel
Fig. 3. Kernel density of time-varying Hurst exponents H(q)with q=1 (black) and q=2 (gray). In most of the cases bimodality is observed, giving a clue of ‘‘two’’ Hurst exponents due to major political changes.
Acknowledgments
I thank the three anonymous referees for helpful comments and suggestions that significantly improved this paper. References
[1] B. Mandelbrot, Rev. Econ. Stat. 53 (1971) 225.
[2] V. Plerou, P. Gopikrishnan, B. Rosenow, L.A.N. Amaral, H.E. Stanley, Physica A 279 (2000) 443.
[3] B. Mandelbrot, Fractals and Scaling in Finance: Discontinuity, Concentration, Risk, Springer, New York, 1997.
[4] D.O. Cajueiro, B.M. Tabak, Physica A 336 (2004) 521.
[5] D.O. Cajueiro, B.M. Tabak, Physica A 346 (2005) 577.
[6] I.Z. Rejichi, C. Aloui, Res. Int. Bus. Financ. 26 (2012) 353.
[7] A. Assaf, Res. Int. Bus. Financ. 20 (2006) 286.
[8] A.L. Barabasi, T. Vicsek, Phys. Rev. A 44 (1991) 2730.
[9] E. Hurst, Trans. Amer. Soc. Civ. Eng. 116 (1951) 770.
[10]T. Di Matteo, T. Aste, M.M. Dacorogna, J. Bank. Financ. 29 (2005) 827.
[11]R. Morales, T. Di Matteo, R. Gramatica, T. Aste, Physica A 391 (2012) 3180.
[12] R. Morales, T. Di Matteo, T. Aste,arXiv:1212.3195.
[13]J. Barunik, T. Aste, T. Di Matteo, R. Liu, Physica A 391 (2012) 4234.
[14]T. Di Matteo, T. Aste, M.M. Dacorogna, Physica A 324 (2003) 183.
[15]T. Di Matteo, Quant. Finance 7 (2007) 21.
[16]R. Liu, T. Lux, T. Di Matteo, Physica A 383 (2007) 35.
[17]R. Liu, T. Di Matteo, T. Lux, Adv. Complex Syst. 11 (2008) 669.
[19]M.S. Taqqu, V. Teverovsky, W. Willinger, Fractals 3 (1999) 785.
[20]D.O. Cajueiro, B.M. Tabak, Financ. Res. Lett. 7 (2010) 163.
[21]L. Calvet, A. Fisher, Rev. Econ. Stat. 84 (2001) 381.
[22]D.O. Cajueiro, P. Gogas, B.M. Tabak, Int. Rev. Financ. Anal. 18 (2009) 50.
[23]L. Zunino, B.M. Tabak, D.G. Perez, M. Garavaglia, O.A. Rosso, Eur. Phys. J. B 60 (2007) 111.
[24]K.P. Lim, Physica A 376 (2007) 445.
[25]K.P. Lim, R.D. Brooks, J.H. Kim, Int. Rev. Financ. Anal. 17 (2008) 571.
[26]P. Grau-Carles, Comput. Econ. 25 (2005) 103.
[27]D.O. Cajueiro, B.M. Tabak, Chaos Solitons Fractals 37 (2008) 918.
[28]S.R. Souza, B.M. Tabak, D.O. Cajueiro, Chaos Solitons Fractals 37 (2008) 180.
[29]D.N. Politis, J.P. Romano, A Circular Block-Resampling Procedure for Stationary Data. Exploring the Limits of Bootstrap, Wiley, New York, 1992.