www.betam.bahcesehir.edu.tr
1
LANDING WAS HARDER THAN EXPECTED
Seyfettin Gürsel*, Zümrüt İmamoğlu†, ve Barış Soybilgen‡
Executive Summary
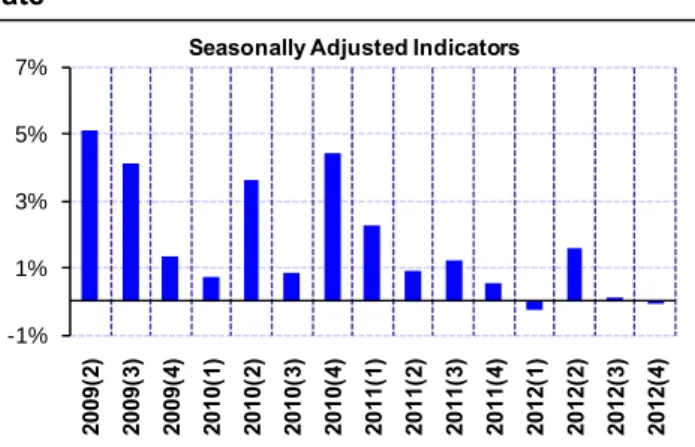
According to data released by Turkstat, Turkey’s real GDP remained stagnant in the fourth quarter of 2012 from the previous quarter. Moreover, annual growth of real GDP in 2012 was 2.2 percent. Turkish economy has been continuously slowing down for the last two years. Real GDP growth which was 12.4 percent in the first quarter of 2011 fell to 1.4 percent in the last quarter of 2012.
In 2012, the main source of growth was net exports whereas domestic demand was the main source in the previous year. Domestic demand subtracted from the growth in 2012. Rebalancing between net foreign and domestic demand reduced the current account deficit to 6 percent, but the annual growth ended up much lower than expected. What the Central Bank called a soft landing in the economy was rather hard at the end of the year.
Betam’s and Turkstat’s seasonal and calendar day adjusted annual GDP growth numbers are close, but quarter on quarter (QoQ) GDP growth numbers differ due to methodological differences. Betam’s QoQ GDP growth estimate for the fourth quarter was 0.9 percent when seasonal adjustment is done separately for each component of GDP. The main source of quarterly growth was net exports and government expenditures. On the other hand, consumption and private investment expenditure declined.
•
Prof. Dr. Seyfettin Gürsel, Betam, Director [email protected] †
Zumrut Imamoglu, Betam, Research Associate zumrut.ı[email protected]
‡
Baris Soybilgen, Betam, Research Assistant [email protected]
Figure 1: Annual change in GDP components, 2012 Imports Exports Government Spending Investment Consumption -10% -6% -2% 2% 6% 10% 14% 18%
Seasonally Adjusted Indicators
Source: Turkstat, Betam. Change in imports is zero.
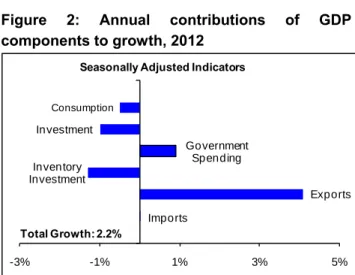
Figure 2: Annual contributions of GDP components to growth, 2012 Imports Exports Inventory Investment Government Spending Investment Consumption -3% -1% 1% 3% 5%
Seasonally Adjusted Indicators
Total Growth: 2.2%
Source: Turkstat, Betam. Contribution of imports is zero.
Growth Review: 2012, 4
th
Quarter
www.betam.bahcesehir.edu.tr
2
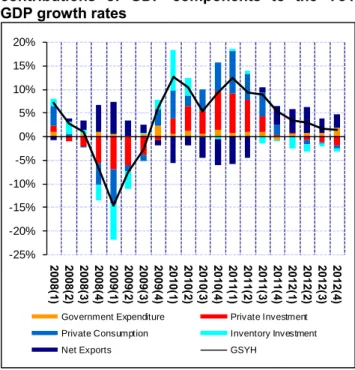
Deciphering the economy’s slow growth trendIn 2012, the economy decelerated in all 4 quarters. Table 1 shows the year on year contributions of GDP components to growth in each quarter in 2012. Private consumption expenditure and inventory investment declined in all 4 quarters while private investment expenditure subtracted from the real GDP growth in the last three quarters. On the other hand, government expenditure supported growth throughout the year. In the first three quarters of 2012, the contribution of government expenditure was around half percentage points, but it increased to 2 percentage points in the fourth quarter due to the base effect. Net exports contributed positively to growth throughout the year. Although the contribution of net exports was around 5-5.5 percent in the first two quarters, it fell down to around 3 percent in the last two quarters. The contribution of net exports has gotten weaker over time.
According to seasonal adjusted and calendar day corrected GDP components that Betam produces, the baseline of the story of growth is not very different but it shows that the economy follows a more volatile path than revealed by yearly changes.1 According to Betam’s analysis, (Table 2) the economy contracted in the first and third quarters of 2012, but grew in the second and fourth quarters of 2012. This fluctuation is caused by the volatile behavior of net exports. Net export contributed positively to growth throughout the year, while imports contributed negatively in the first two quarters and contributed positively in the last two quarters. In the third quarter, we observed a revival in consumption. Unfortunately, this revival ceased and turned to contraction in the fourth quarter. The contribution of private investment expenditure was negative in the last three quarters. Government expenditure contributed positively to GDP growth throughout the year.
Overall (Table 3), government expenditure increased by 2.7 percent and contributed 0.4 percentage points to the GDP growth in 2012. Moreover, exports increased by 17.2 percent and contributed 4.1 percentage points. Private consumption expenditure and private consumption expenditure decreased by 0.7 and 4.5 percent, respectively, and subtracted from growth 0.5 and 1.0 percentage points. Inventory investment also decreased and subtracted 1.3 percentage points from growth. Imports almost remained at the same level compared to 2011. Therefore, real GDP grew 2.2 percent in 2012.
1
Turkstat does not deseasonalize GDP components.
Figure 3: YoY GDP growth rates and contributions of GDP components to the YoY GDP growth rates -25% -20% -15% -10% -5% 0% 5% 10% 15% 20% 2008( 1) 2008( 2) 2008( 3) 2008( 4) 2009( 1) 2009( 2) 2009( 3) 2009( 4) 2010( 1) 2010( 2) 2010( 3) 2010( 4) 2011( 1) 2011( 2) 2011( 3) 2011( 4) 2012( 1) 2012( 2) 2012( 3) 2012( 4)
Government Expenditure Private Investment Private Consumption Inventory Investment
Net Exports GSYH
Source: Turkstat, Betam.
Figure 4: Change of GDP components in 2012-Q4 from the previous quarter
Imports Exports Government Spending Investment Consumption -6% -4% -2% 0% 2% 4% 6%
Seasonally Adjusted Indicators
Source: Turkstat, Betam. Quarterly indicators are seasonally adjusted and calendar day corrected.
Figure 5: Contributions of GDP components to 2012-Q4 GDP growth Imports Exports Inventory Investment Government Spending Investment Consumption -1.0% -0.5% 0.0% 0.5% 1.0% 1.5%
Seasonally Adjusted Indicators
Total Growth: 0.9%
Source: Turkstat, Betam. Quarterly indicators are seasonally adjusted and calendar day corrected.
www.betam.bahcesehir.edu.tr
3
Due to the slowdown and the revision in tourism income accounts, the current account deficit fell significantly. The current account deficit to GDP ratio which was 10 percent in 2011 declined to 6 percent at the end of 2012.
Sharp break in 4th quarter domestic demand
To analyze the contributions of GDP components to growth, Betam seasonally adjusts each component of GDP separately. Figures 4 and 5 show changes in GDP components and their contributions to real GDP growth in the fourth quarter with respect to the previous quarter (Table 4). For comparison, annual changes from 2011 to 2012 in GDP components and their contributions to real GDP growth are shown in Figures 1 and 2. Betam’s seasonal adjusted and calendar day corrected GDP components show that QoQ real GDP growth for the fourth quarter was 0.9 percent.
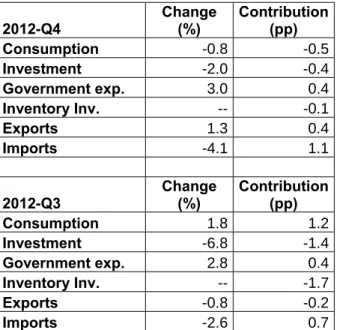
Betam’s calculations show that private consumption investment expenditure declined in the fourth quarter from the previous quarter. Private consumption expenditure decreased by 0.8 percent and subtracted 0.5 percentage points from the quarterly real GDP growth. Furthermore, private investment expenditures declined by 2 percent and subtracted 0.4 percentage points from growth. Inventory investment also fell and subtracted 0.1 percentage points.
The decline in imports was the main source of the growth in the last quarter. Imports decreased by 4.1 percent and contributed 1.1 percentage points to the growth. Exports, on the other hand, increased and contributed positively. We were expecting exports to contribute negatively in the fourth quarter because export volume index declined in the same period. Government expenditure increased by 3 percent and contributed 0.4 percentage points to the growth.
2012 forecast performance and 2013 expectations
Betam, in its Economic Outlook and Forecast briefs (January 2012 and February 2013), forecasted 2.6 percent annual growth which realized as 2.2 percent. Our forecast for the YoY real GDP growth was 2.4 percent which is higher than the realized (1.4 percent). Betam also expected QoQ growth to be 0.6 percent which is also higher than realized numbers. Our consumption and investment indicators had showed an increase in private consumption and investment expenditures in the fourth quarter, but
private consumption and investment expenditures actually declined and this was the main reason for our forecast error.
Even though export volume index declined in the last period, unexpectedly exports contributed to the growth positively. The revision in tourism income accounts may have led to an in increase in service exports.
In the last quarter of 2012, the expected revival in consumption and investment did not appear and this lowered the spirits. We were expecting the decline in interest rates as a result of loose monetary policy and the revival in banks’ loans to stimulate the economy in the fourth quarter. Now the revival is expected to come in the first quarter. However, January data does not yet show signs as such. Increases in real sector confidence index and automobile demand in February keep the hope alive.
Figure 6: Quarter-on-quarter real GDP growth rate -1% 1% 3% 5% 7% 2009 (2 ) 2009 (3 ) 2009 (4 ) 2010 (1 ) 2010 (2 ) 2010 (3 ) 2010 (4 ) 2011 (1 ) 2011 (2 ) 2011 (3 ) 2011 (4 ) 2012 (1 ) 2012 (2 ) 2012 (3 ) 2012 (4 )
Seasonally Adjusted Indicators
www.betam.bahcesehir.edu.tr
4
Table 1. Contributions of GDP components and GDP growth rate throughout quarters of 2012compared to the same quarter of previous year.
2012 1.Q. 2.Q. 3.Q. 4.Q. Consumption -0.3 -0.9 -0.3 -0.6 Investment 0.3 -0.9 -1.2 -1.9 Government exp. 0.5 0.6 0.7 1.8 Inventory Inv. -2.2 -1.5 -0.8 -0.9 Net Exports 5.1 5.5 3.1 2.9 Exports 3.5 5.7 3.6 3.7 Imports 1.6 -0.1 -0.5 -0.8 Growth Rate-SUM 3.3 2.9 1.6 1.4 Source: Turkstat.
Table 2. Contributions of GDP components and GDP growth rate throughout quarters of 2012 compared to the previous quarter.
2012 1.Q. 2.Q. 3.Q. 4.Q. Consumption -0.7 -0.5 1.2 -0.5 Investment 0.4 -0.5 -1.4 -0.4 Government exp. 0.4 0.5 0.4 0.4 Inventory Inv. -0.1 1.1 -1.7 -0.1 Net Exports -0.5 1.5 0.5 1.5 Exports 1.5 2.2 -0.2 0.4 Imports -2.0 -0.7 0.7 1.1 Growth Rate-SUM -0.6 2.2 -1.0 0.9 Growth Rate-TurkStat -0.2 1.6 0.1 0.0
Source: Turkstat, Betam. Quarterly indicators are seasonally adjusted and calendar day corrected.
Table 3. Annual changes in and contributions of GDP components for 2012 and 2011.
2012 Change (%) Contribution(pp) Consumption -0.7 -0.5 Investment -4.5 -1.0 Government exp. 6.6 0.9 Inventory Inv. -- -1.3 Exports 17.2 4.1 Imports 0.0 0.0 2011 Change (%) Contribution(pp) Consumption 7.7 5.3 Investment 22.3 4.4 Government exp. 2.7 0.4 Inventory Inv. -- -0.2 Exports 7.9 1.9 Imports 10.7 -3.0 Source: Turkstat.
Table 4. Changes in and contributions of GDP components for 2012Q2 and 2012Q3, compared to the previous quarters.
2012-Q4 Change (%) Contribution (pp) Consumption -0.8 -0.5 Investment -2.0 -0.4 Government exp. 3.0 0.4 Inventory Inv. -- -0.1 Exports 1.3 0.4 Imports -4.1 1.1 2012-Q3 Change (%) Contribution(pp) Consumption 1.8 1.2 Investment -6.8 -1.4 Government exp. 2.8 0.4 Inventory Inv. -- -1.7 Exports -0.8 -0.2 Imports -2.6 0.7
Source: Turkstat, Betam. Quarterly indicators are seasonally adjusted and calendar day corrected
www.betam.bahcesehir.edu.tr
5
Box 1: Calculation of quarterly GDP growth andcontributions.
Sub-components of GDP are grouped into 3 categories:
1. Final domestic demand consist of final consump-tion expenditure of resident households (Con-sumption), sum of government final consumption and investment expenditure (Government ex-penditure), investment expenditure of private sector (Investment)
2. Net foreign demand for goods and services rep-resents the difference between exports and imports of goods and services.
3. Change in inventories (stocks) shows how stocks changes with compared to previous quarter (for details look Box 2)
In order to find quarterly GDP growth, the following formulation is used for all sub components of GDP separately:
Since X represents 'Change in GDP component' Contribution of X to growth can be calculated as follows:
= (Xt – Xt-1) / GDPt-1
Differences between the methodologies used by Betam and TurkStat in seasonally adjusting the real GDP
TurkStat seasonally adjusts and calendar day corrects total GDP series but not its components separately. However, each component of GDP may show different seasonal characteristics. Therefore, Betam eliminates the effects of seasonality and calendar day from the components separately and constructs the adjusted GDP series as the sum of the adjusted components. These two methodologies yield quantitatively different results and both of them are used frequently in the related literature.
Box 2: Change in inventories (stocks) and its contribution to growth
'Stock change' shows that how stocks change compared to previous period
Stock change t = Stock t – Stock t-1
Therefore increase (decrease) in inventories is caused by increase (decrease) in the difference between two period rather than increase (decrease) in stocks. However, TurkStat estimates the change in stocks is as residual between production and expenditure accounts. Moreover this sub-component also includes statistical discrepancy.
Let's say the difference between production and expenditure account εt-1, 'stock change' in time t is as
follows:
Stock changet = Stock t – Stock t-1 + εt-1
Finally, contribution of change in 'Stock change' can be found as follows:
Contribution of 'Stock change t = (Stock t – Stock t-1) / GDP t-1
or
Contribution of 'Stock change t = ((Stock t – Stock t-1 + εt )