http://jmk.sagepub.com/
http://jmk.sagepub.com/content/28/3/243
The online version of this article can be found at: DOI: 10.1177/0276146708320447
2008 28: 243
Journal of Macromarketing
Ibrahim Hegazy, Ahmet Ekici, Dave Webb, Chenting Su and Jordi Montana
M. Joseph Sirgy, Dong-Jin Lee, Stephan Grzeskowiak, Jean-Charles Chebat, J.S. Johar, Andreas Hermann, Salah Hassan,
An Extension and Further Validation of a Community-based Consumer Well-being Measure
Published by:
http://www.sagepublications.com
On behalf of:
Macromarketing Society
can be found at: Journal of Macromarketing
Additional services and information for
http://jmk.sagepub.com/cgi/alerts Email Alerts: http://jmk.sagepub.com/subscriptions Subscriptions: http://www.sagepub.com/journalsReprints.nav Reprints: http://www.sagepub.com/journalsPermissions.nav Permissions: http://jmk.sagepub.com/content/28/3/243.refs.html Citations: What is This? - Jul 31, 2008 Version of Record >>
An Extension and Further Validation
of a Community-based Consumer
Well-being Measure
M. Joseph Sirgy
Virginia Polytechnic Institute and State University
Dong-Jin Lee
Yonsei University
Stephan Grzeskowiak
St. Thomas UniversityJean-Charles Chebat
HEC Montreal, CanadaJ. S. Johar
California State University -San Bernardino
Andreas Hermann
St. Gallen University
Salah Hassan
George Washington University
Ibrahim Hegazy
American University in Cairo
Ahmet Ekici
Bilkent University
Dave Webb
University of Western Australia
Chenting Su
City University of Hong Kong
Jordi Montana
ESADE, Spain
The goal of this study is to extend the research and further validation of Lee and colleagues’ measure of community-based consumer well-being. The measure is based on the notion that consumers experience well-being to the extent that they are satisfied with local marketplace experiences related to (1) shopping for desired consumer goods and services in the local area, (2) preparing locally purchased consumer durables for personal use, (3) consuming locally purchased goods and services, (4) owning consumer durables purchased in the local area, (5) using repair and maintenance services in the local area, and (6) using selling, trading-in, and disposal services in the local area. Data were collected from ten localities in nine countries/states (California, Minnesota, Canada, Australia, Spain, Germany, Switzerland, Turkey, Egypt, and China) using the mall intercept method. The data provided support for the predictive/nomological validity of the measure by providing empirical support for the relationship between the consumer well-being construct and other well-being constructs such as life satisfaction.
Keywords: consumer well-being; consumer welfare; transformative consumer research; marketing and quality of life; marketing well-being; macroconsumption
10.1177/0276146708320447 http://jmmk.sagepub.com hosted at http://online.sagepub.com
T
here have been several research efforts to develop measures of consumer well-being (CWB) in a com-munity context. For example, Lee et al. (2002) have argued that the dimensions of the consumer life domain are most appropriately conceptualized in terms of five types of con-sumer experiences: acquisition, possession, consumption, maintenance, and disposal. Thus, extending the above-noted conceptualizations, they developed a subjective mea-sure of CWB as a composite of consumer satisfaction in relation to acquisition, possession, consumption, mainte-nance, and disposal of goods and/or services in the context of one’s own community. The authors were able to demon-strate that their CWB measure was for the most part posi-tively related to a measure of life satisfaction.Recently, Sirgy and Lee (2006) conducted a critique of the macro measures of CWB. They argued that CWB measures should capture the varied experiences that con-sumers have with the marketplace. Not only do concon-sumers purchase and use goods and services; they also engage in preparing the purchased goods for personal or family use; they spend much time, money, and energy to maintain and service durable goods; they spend time and energy in the disposal of durable goods; and so on. Thus, an ideal CWB measure should capture consumer experiences in the mar-ketplace in a comprehensive manner. The same authors also argued that an ideal CWB measure is one that should be highly diagnostic and practical to help decision makers identify causes and therefore take remedial action. Business-, retail-, and marketing-related professional associations and their local chapters, together with other community-based organizations (e.g., local Better Business Bureau, Chamber of Commerce, economic development organizations, and community planners) should be able to use the CWB measure to help formulate remedial policies and action programs. Furthermore, a CWB measure that is highly diagnostic and practical should monitor CWB at the national level but should be able to be disaggregated to identify problems in geo-graphic communities’ marketing sectors (e.g., retailing, customer service management, disposal services) as well as industry sectors (e.g., consumer electronics, furniture, appliances, and personal transportation). Thus, based partly on their critique, this study attempts to revise the measure devised by Lee et al. (2002), guided by the notion that an ideal CWB measure has to be comprehensive enough to capture the richness of consumer experiences in the local marketplace. Thus, the main objective of this arti-cle is to report on research related to extension and further validation of work by Lee et al.; our goal here is to extend that measure to make it more comprehensive, diagnostic, and valid (in terms of its predictive validity) to help policy makers formulate public policies at the community level.
The article proceeds as follows. It first revisits and critiques Lee et al. to identify ways of improving it. Based on these suggestions, it then reports how the measure was developed, survey data was collected from a wide range of communities across the globe, and the predictive (nomo-logical) validity of the measure in relation to measures of quality of life (life satisfaction and subjective well-being) were tested. The article concludes by highlighting the research and public policy implications of the measure.
Modifying and Extending The CWB
Measure by Lee et al. (2002)
Based on the review of the literature (Sirgy 2001; Sirgy and Lee 2006), it is believed that the CWB measure developed by Lee et al. (2002) is comprehensive, enabling researchers to capture much of the richness of consumer experiences in the local marketplace. Similar to any tool, however, it can be improved. This study there-fore is an attempt to improve it. To reiterate, this CWB measure was designed to capture consumer experiences with purchasing of goods and services in the local area, the consumption of these goods and services purchased locally, the maintenance and repair of consumer goods purchased locally, and the disposal of these goods. Thus, this attempt to develop a comprehensive measure of CWB is based on the notion that an ideal CWB measure should capture consumer satisfaction experiences related to all six types of consumer experiences in the market-place: acquisition, preparation, consumption, ownership, maintenance, and disposal of a variety of consumer goods and services. This ideal community-based CWB measure builds on the measure developed by Lee et al. by further refining the measure, testing the nomological (predictive) validity of the measure in relation to community and life satisfaction measures, and demonstrating the generaliz-ability of the study findings by using a large-scale sample of adult consumers from different cities and countries across the globe.
Acquisition (Shopping) Satisfaction
The CWB measure (Lee et al. 2002) captured acquisi-tion (shopping) satisfacacquisi-tion by asking respondents to indicate their satisfaction with the “shopping in your community” with respect to the seven aspects of shop-ping in the local area such as the quality of goods avail-able in local area stores, prices charged in local area stores, attractiveness or ambiance of local area stores, and courtesy/helpfulness of personnel. See the measure in the right column of Table 1.
It is not very meaningful for consumers to indicate their satisfaction with those seven aspects of shopping in the local area because these aspects of the shopping experience are likely to vary considerably from one retail establish-ment to another. Hence, respondents may find it difficult to generate a global judgment capturing their feelings of sat-isfaction with their shopping experience in the local area. Consumers may have different feelings regarding different types of retail establishments in the local area: shopping malls, shopping plazas and centers, department stores, dis-count stores, grocery stores, and similar venues. Therefore, we revamped the acquisition (shopping) measure and developed an alternative that focuses on satisfaction with different types of retail establishments in the community (see the precise measure in the left column of Table 1). That measure captures satisfaction with shopping malls, shopping plazas/ centers, department stores, discount stores, grocery stores, drug stores, sporting goods stores, consumer electronics stores, clothing boutiques, furniture stores, and other specialty stores (e.g., toy stores, gift stores). In other words, overall satisfaction with a variety of stores in the local area is viewed as an important dimension of community-based CWB. Overall satisfaction with these
stores could be based on shopping aspects such as avail-ability and sufficiency of stores in the area as well as the quality of the retail services such as store hours, courtesy of personnel, and refund/exchange policy.
Preparation (Assembly) Satisfaction
Sirgy and Lee (2006) argued that a community-based CWB measure should capture satisfaction with six types of marketplace experiences (acquisition, preparation, con-sumption, ownership, maintenance, and disposal experi-ences). Lee et al. (2002) developed their measure based on five types of consumer experiences (acquisition, consump-tion, ownership, maintenance, and disposal). Preparation refers to consumer experiences dealing with transforming or assembling purchased goods to make them ready for consumption (satisfaction with assembling a desk pur-chased from an office supply store, satisfaction with cus-tomizing a newly purchased house to fit family needs, etc.). To capture consumer preparation experiences, respon-dents should be asked to indicate their degree of satisfac-tion with assembly/preparasatisfac-tion of durable goods (e.g., consumer electronics, furniture, household appliances,
Acquisition (shopping) satisfaction
“Experiences related to shopping for products in your local area you and your family need”
“Please indicate how satisfied or dissatisfied you are with shopping for a variety of consumer goods and services in your local area—that is, availability and sufficiency of stores and retail outlets selling consumer goods and services as well as the quality of these retail services (e.g., store hours, courtesy of personnel, refund/exchange policy, among others). Respond to only those stores you have patronized;
skip those you have not patronized.
1. Satisfaction with shopping malls
2. Satisfaction with shopping plazas and centers 3. Satisfaction with department stores
4. Satisfaction with discount stores 5. Satisfaction with grocery stores 6. Satisfaction with drug stores
7. Satisfaction with sporting goods stores 8. Satisfaction with consumer electronics stores 9. Satisfaction with clothing boutiques 10. Satisfaction with furniture stores
11. Satisfaction with other specialty stores (e.g., toy stores, gift stores)”
Scale: Seven-point semantic differential anchored by very
dissatisfied (–3) and very satisfied (+3).
Acquisition (shopping) satisfaction
“Please indicate how satisfied or dissatisfied you are with the shopping in your community. Respond to each of the follow-ing aspects of the shoppfollow-ing environment in your community.”
1. Quality of goods available in local stores 2. Prices charged in local stores
3. Attractiveness or ambiance of local stores 4. Courtesy or helpfulness of store personnel 5. Hours that the stores are open
6. Store refund/replacement policies for defective goods 7. Availability of goods you want in local stores
Scale: 1 = awful, 2 = bad, 3 = unsatisfactory, 4 = neutral, 5 =
satis-factory, 6 = good, 7 = wonderful.
Table 1
Lee et al. (2002) Consumer Well-being (CWB) Measure Contrasted with the Modified Measure: Acquisition (Shopping) Satisfaction
personal transportation vehicles, clothing and clothing accessories, and lawn and garden tools and equipment) after purchase from local area retailers. In many instances, those retail establishments provide product assembly ser-vices either free of charge or for some nominal fee. Thus, satisfaction with assembling or preparing products pur-chased from local area retailers is an important dimension of community-based CWB.
The modified community-based CWB measure (as shown in Table 2) incorporates a measure of preparation (assembly) satisfaction. Respondents are asked to indi-cate how satisfied or dissatisfied they are with their expe-riences related to the assembly (or preparation) of the following product classes purchased in the local area: consumer electronics, furniture, appliances, personal transportation vehicles, clothing and clothing acces-sories, and lawn and garden tools and equipment.
Consumption (Product Use) Satisfaction
The measure (Lee et al. 2002) captures consumption satisfaction through eleven major categories of consumer goods and services that play an important role in the quality of life (e.g., health care services, banking/insur-ance services, and consumer electronics). See the mea-sure in the right column of Table 3.
The measure falls short in capturing important classes of consumer goods and services that consumers typically use in the context of their local area. Table 3 shows the modified consumption satisfaction measure. It captures satisfaction with six major categories of consumer goods
purchased locally (consumer electronics, furniture, appliances, personal transportation vehicles, clothing and clothing accessories, and lawn and garden tools and equipment) and twenty-three major categories of local consumer services (banking/saving, insurance, taxi, restaurant/night clubs, health care, telephone, electric, gas/oil, real estate, day care, nursing homes, primary schools, secondary schools, community colleges, col-leges and universities, continuing education, investment, legal, entertainment, spectator sports, TV, radio, and local newspapers). The list of consumer services was adapted from a community quality-of-life measure (Sirgy et al. 2000; Sirgy and Cornwell 2001).
Possession (Ownership) Satisfaction
The Lee et al. (2002) measure captures possession satisfaction by asking respondents to rate their satisfaction with the ownership of six categories of consumer goods (e.g., house, consumer electronics, furniture, car, clothing and clothing accessories, and savings and investment) purchased in the local area. See the measure in the right-hand column of Table 4.
This measure can be improved by prompting respon-dents to focus on the monetary (or resale) value of their possessions. In other words, consumers feel satisfied or dissatisfied with their material possessions as a direct function of the extent to which these material posses-sions appreciate or depreciate (e.g., Day 1978, 1987; Leelakulthanit, Day, and Walters 1991; Nakano, MacDonald, and Douthitt 1995). Therefore, the modified
Table 2
Measure of Preparation (Assembly) Satisfaction
Modified Consumer Well-being Measure Lee et al. (2002) Consumer Well-being Measure
Preparation (assembly) satisfaction
“Experiences related to preparing products you bought in the local area for personal use”
“Please indicate how satisfied or dissatisfied you are with your experiences related to product assembly (or preparation of these products for personal use) of the following products you bought in the local area in the last year or so? Respond to
only those products you have purchased; skip those you have not purchased.
1. Consumer electronics (e.g., CD player, TV, computers) 2. Furniture (e.g., sofas, dinning sets)
3. Appliances (e.g., microwave oven, refrigerator) 4. Personal transportation (e.g., cars, trucks, motorcycles) 5. Clothing and clothing accessories (e.g., suits, jewelry) 6. Lawn and garden tools and equipment”
Scale: Seven-point semantic differential anchored by very
dissatisfied (–3) and very satisfied (+3).
The measure did not contain items capturing the preparation (assembly) dimension
measure asked respondents to rate their satisfaction with the monetary value of owning a variety of durable goods purchased in the local area such as consumer electronics, furniture, household appliances, personal transportation vehicles, clothing and clothing accessories, lawn and garden tools and equipment, savings and investments, real estate, and boat and leisure investments, among others (see Table 4).
Maintenance (Repair) Satisfaction
The instrument by Lee et al. (2002) was designed to capture consumers’ experience with product mainte-nance in terms of maintemainte-nance satisfaction—defined as satisfaction consumers experience when they seek to have a product repaired or serviced. Maintenance satis-faction was conceptualized in terms of two dimensions:
Table 3
Lee et al. (2002) Consumer Well-being (CWB) Measure Contrasted with the Modified Measure: Consumption (Use) Satisfaction
Modified CWB Measure Lee et al. (2002) CWB Measure
Consumption (use) satisfaction
“Experiences related to the actual use of products and services you bought in the local area”
“Please indicate how satisfied or dissatisfied you are with the quality and performance of most consumer goods and services purchased in your local area in the last year or so. Respond to
only those products you have used; skip those you have not used.
A. Consumer goods:
1. Consumer electronics (e.g., CD player, TV, computers) 2. Furniture (e.g., sofas, dinning sets)
3. Appliances (e.g., microwave oven, refrigerator) 4. Personal transportation (e.g., cars, trucks,
motorcycles)
5. Clothing and clothing accessories (e.g., suits, jewelry) 6. Lawn and garden tools and equipment
B. Consumer services:
1. Banking/savings services 2. Insurance services 3. Taxi/private transportation 4. Restaurants/night clubs 5. Health care services 6. Telephone services 7. Electric services 8. Gas/oil services
9. Real estate and realtor services 10. Day care services
11. Nursing homes/retirement community–type services 12. Primary schools
13. Secondary schools 14. Community colleges 15. Colleges and universities 16. Continuing education 17. Investment services 18. Legal services 19. Entertainment 20. Spectator sports 21. TV stations 22. Radio stations 23. Local newspaper”
Scale: Seven-point semantic differential anchored by very
dissatisfied (–3) and very satisfied (+3).
Consumption (use) satisfaction
“Please indicate the extent to which you are generally satisfied or dissatisfied with using or consuming the items listed below. Respond only to the items that you use.
1. Health care services (doctors, dentists, optometrists, etc.) 2. Banking/insurance services
3. Personal care services (barbers, hairdressers, manicurists, etc.)
4. Restaurants
5. Food and grocery store items
6. Consumer electronics (CD player, TV, VCR, computers, etc.) 7. Furniture and appliances
8. Private transportation (cars, trucks, motorcycles, and bicycles)
9. Clothing, accessories, and jewelry 10. Utilities (electricity, telephone, etc.) 11. Savings and investments”
Scale: 1 = awful, 2 = bad, 3 = unsatisfactory, 4 = neutral, 5 =
repair services and do-it-yourself support services (see the measure in the right-hand column of Table 5). The first dimension (satisfaction with repair services) was further conceptualized as satisfaction with nine aspects of repair service organizations such as quality of the ser-vices, the skill of the people who do the repairs, and the price of the service, among others. The second dimen-sion (satisfaction with do-it-yourself services) was con-ceptualized in terms of satisfaction with materials and services available in the community that assist con-sumers with do-it-yourself repairs. Specifically, respon-dents were asked to rate their satisfaction in terms of seven aspects of satisfaction with materials and services such as price of replacement parts and tools, quality of advice or assistance provided by retailers and friends, and the completeness or intelligibility of the owner’s manual and assembly instructions.
This study revamped the Lee et al. (2002) measure of maintenance satisfaction. It is difficult for consumers to indicate their satisfaction with those nine aspects of repair organizations in the local area because these aspects of the service experience are likely to vary con-siderably from one repair organization to another. Hence, respondents may find it difficult to generate a global judgment capturing their feelings of satisfaction with the repair organizations in the local area in general. Consumers may have different feelings regarding different
types of repair organizations related to different product categories: consumer electronics, furniture, appliances, personal transportation vehicles, clothing and clothing accessories, and lawn and garden tools and equipment (see the precise measure in the left-hand column of Table 5). The measure pertaining to the second dimension of maintenance satisfaction, namely, satisfaction with do-it-yourself repairs, was dropped because the authors real-ized that this measure may not be community based. For example, satisfaction with the owner’s manual and assembly instructions is related to the manufacturing firm and has little to do with consumer experience related to local firms. Furthermore, the eight satisfaction aspects pertaining to the do-it-yourself maintenance experience may vary considerably from one product cat-egory to the next, thus questioning the construct validity of this measure.
The modified measure of maintenance satisfaction therefore focused on satisfaction with local repair service experiences with various categories of consumer goods. Specifically, community residents were asked to rate their satisfaction with the quality and performance of repair services dealing with consumer durables such as consumer electronics, furniture, household appliances, personal transportation vehicles, clothing and clothing accessories, and lawn and garden tools and equipment (see Table 5).
Table 4
Lee et al. (2002) Consumer Well-being (CWB) Measure Contrasted with the Modified Measure: Possession (Ownership) Satisfaction
Modified CWB Measure Lee et al. (2002) CWB Measure
Possession (ownership) satisfaction
“Experiences related to the ownership of products you bought in the local area”
“Please indicate how satisfied or dissatisfied you are with the monetary value of owning those products you purchased in your local area over the last year or so. Respond to only those
products you own that were purchased in the local area; skip those you do not own.
1. Consumer electronics (e.g., CD player, TV, computers) 2. Furniture (e.g., sofas, dinning sets)
3. Appliances (e.g., microwave oven, refrigerator) 4. Personal transportation (e.g., cars, trucks, motorcycles) 5. Clothing and clothing accessories (e.g., suits, jewelry) 6. Lawn and garden tools and equipment
7. Savings and investments 8. Real estate
9. Boat and other leisure investments”
Scale: Seven-point semantic differential anchored by very
dissatisfied (–3) and very satisfied (+3).
Possession (ownership) satisfaction
“If you own any of the items shown below, please indicate the extent to which you are generally satisfied/dissatisfied with owning them. Because we sometimes use things we do not own or own things we don’t use, it should be possible to sep-arate our satisfaction in using a thing from our satisfaction in owning it. On items shown below, indicate how you generally feel about owning the item, not how you feel about using it. Respond only to the items that you own.
1. House or condominium
2. Consumer electronics (e.g., CD player, TV, computers) 3. Furniture and/or appliances
4. Private transportation (e.g., cars, trucks, motorcycles) 5. Clothing and clothing accessories (e.g., suits, jewelry) 6. Savings and investments”
Scale: 1 = awful, 2 = bad, 3 = unsatisfactory, 4 = neutral, 5 = satisfactory, 6 = good, 7 = wonderful.
Disposal Satisfaction
The Lee et al. (2002) measure also captured con-sumers’ satisfaction with their disposal experience at the local level. Lee et al. conceptualized this construct in terms of satisfaction consumers feel with
the disposability of eight categories of consumer products: food, personal care products, cleaning and home maintenance products, paper products, baby care products, automotive products, and lawn and yard (see the measure in the right-hand column of Table 6).
Table 5
Lee et al. (2002) Consumer Well-being (CWB) Measure Contrasted with the Modified Measure: Maintenance (Repair) Satisfaction
Modified CWB Measure Lee et al. (2002) CWB Measure
Maintenance (repair) satisfaction
“Experiences related to the use of repair and maintenance
services in the local area”
“Please indicate how satisfied or dissatisfied you are with the quality and performance of maintenance and repair services of consumer goods you used in the last year or so. Respond
to only those products you have repaired or serviced in the local area; skip those you have not repaired or serviced.
1. Consumer electronics (e.g., CD player, TV, computers) 2. Furniture (e.g., sofas, dinning sets)
3. Appliances (e.g., microwave oven, refrigerator) 4. Personal transportation (e.g., cars, trucks, motorcycles) 5. Clothing and clothing accessories (e.g., suits, jewelry) 6. Lawn and garden tools and equipment”
Scale: Seven-point semantic differential anchored by very
dissatis-fied (–3) and very satisdissatis-fied (+3).
Maintenance (repair) satisfaction A. Satisfaction with repair services
“Please indicate how satisfied or dissatisfied you are with the repair services available to you. Examples of repair organizations would include car garages, plumbing services, electricians, appliance and shoe repair shops, and so on. How do you feel about the following aspects of repair services available to you?
1. Quality of the service provided by most repair organizations
2. The skill of the people who do the repairs 3. The availability of services when you need them 4. The price of the repair organizations usually charge
for their services
5. The speed of service or promptness of most repair organizations
6. The honesty of the people who do the repairs 7. The range of choices available when picking a repair
service
8. The level of appropriateness to your questions or complaints
9. The accuracy of price estimates given before the service is provided”
Scale: 1 = awful, 2 = bad, 3 = unsatisfactory, 4 = neutral, 5 = satisfactory, 6 = good, 7 = wonderful.
B. Satisfaction with materials and services for do-it-yourself repairs “People who do their own repair work often require
materials and services that help them get the job done. Please indicate how you feel about the materials and services available in your community.
1. Price of replacement parts and tools
2. Quality of advice or assistance provided by retailers, friends, or others in the community
3. The completeness and intelligibility of owners’ manuals or assembly instructions
4. Availability of necessary replacement parts and tools 5. The technical support provided by manufacturers 6. Quality of replacement parts and tools
7. Availability of ‘how-to-repair’ workshops 8. The availability of stores specializing in parts and
tools, that is, places such as auto parts, building supplies, and hardware stores”
Scale: 1 = awful, 2 = bad, 3 = unsatisfactory, 4 = neutral, 5 = satisfactory, 6 = good, 7 = wonderful.
The modified measure focused on consumer satisfac-tion with the disposal experience of the same set of prod-uct categories (e.g., consumer electronics, furniture, appliance, private transportation vehicles, clothing and clothing accessories, and lawn and garden tools and equip-ment) used to capture other dimensions of community-based CWB. The reader should note that the selected consumer durables are core product categories that a majority of consumers use in daily living. Respondents were directed to think of local services that assist con-sumers with disposal of consumer durables. In other words, consumers were directed to think of local services they used to junk the same set of categories of consumer durables questioned about in relation to acquisition, preparation, ownership, consumption, and maintenance experiences. See Table 6 for these measures, too.
Further Testing the Nomological
(Predictive) Validity of the CWB Measure
The nomological (predictive) validity of the Lee et al. (2002) measure was demonstrated by showing that satis-faction with acquisition, possession, and consumption can significantly predict life satisfaction (controlling for satis-faction with other life domains such as satissatis-faction with
job, financial situation, health, education, friendships, leisure, neighborhood, community, and spiritual). The study employed a convenience sample of college students (N= 298). The same study failed to support the nomolog-ical validity of the CWB measure in relation to mainte-nance and disposal experiences. The argument that Lee et al. used to link CWB dimensions with life satisfaction is based on a bottom-up theory of life satisfaction popular in quality-of-life studies (see Diener 1984; Diener et al. 1999; Sirgy 2002 for reviews of the literature of this research). Bottom-up theory states that overall life satis-faction is determined mostly by positive and negative affect invested in the various life domains (e.g., family life, work life, leisure life, spiritual life, love life, commu-nity life, and financial life). These life domains are psy-chological spheres that segment affective and cognitive experiences related to interrelated life concerns (e.g., Andrews and Withey 1976; Campbell, Converse, and Rodgers 1976; Cummins et al. 1994; Frisch 1992). Marketplace experiences related to product acquisition, preparation, use, ownership, maintenance, and disposal play a direct role in meeting certain needs within the var-ious life domains, which in turn contribute to the positive and negative affect invested in those domains. Thus, CWB contributes overall life satisfaction through feelings of sat-isfaction/dissatisfaction captured in various life domains.
Disposal satisfaction
“Experiences related to the disposal of consumer goods in the local area”
“Please indicate how satisfied or dissatisfied you are with the quality and performance of services designed to assist con-sumers like you to dispose of their consumed products. For example, computer stores in some local areas help computer owners dispose of their old computers, auto junk yards help car owners dispose of their junked cars, waste management disposal sites, thrift stores, and so on. Respond to only those
product categories which you actually used selling services; skip those you have not used.
1. Consumer electronics (e.g., CD player, TV, computers) 2. Furniture (e.g., sofas, dinning sets)
3. Appliances (e.g., microwave oven, refrigerator) 4. Private transportation (e.g., cars, trucks, motorcycles) 5. Clothing and clothing accessories (e.g., suits, jewelry) 6. Lawn and garden tools and equipment”
Scale: Seven-point semantic differential anchored by very
dissatisfied (–3) and very satisfied (+3).
Table 6
Lee et al. (2002) Consumer Well-being (CWB) Measure Contrasted with the Modified Measure: Disposal Satisfaction
Modified CWB Measure Lee et al. (2002) CWB Measure
Disposal satisfaction
“For various reasons, people may be more or less happy with the disposability of a product. If you use any of the following products, please indicate the extent to which you are satisfied/ dissatisfied with the product class when you dispose of the product or its package. Respond only to items that you use.
1. Food (milk, canned foods, cookies, carbonated drinks, etc.)
2. Personal care products (toothpaste, shampoo, deodorant, etc.)
3. Cleaning and home maintenance products (detergents, window sprays, vacuum bags, air fresheners, paint, etc.) 4. Paper products
5. Baby care products (diapers, baby wipes, talcum powder, Vaseline, etc.)
6. Automotive products (oil, oil filters, antifreeze, car wax, batteries, tires, etc.)
7. Lawn and yard (leaves, grass, dead wood, etc.)” Scale: 1 = awful, 2 = bad, 3 = unsatisfactory, 4 = neutral,
Using a similar theoretical rationale, the modified measure of CWB should predict overall life satisfaction and life domain satisfaction. Specifically, this study hypothesizes the following (see Figure 1):
Hypothesis 1: CWB is a positive function of satisfaction
with acquisition of local products (or shopping satisfaction).
Hypothesis 2: CWB is a positive function of satisfaction
with preparation or assembly of products purchased locally.
Hypothesis 3: CWB is a positive function of satisfaction
with the use (or consumption) of locally purchased products.
Hypothesis 4: CWB is a positive function of satisfaction
with the use (or consumption) of local services.
Hypothesis 5: CWB is a positive function of satisfaction
with the ownership of locally purchased products.
Hypothesis 6: CWB is a positive function of satisfaction
with local maintenance (or repair) services.
Hypothesis 7: CWB is a positive function of satisfaction
with local disposal services.
Hypothesis 8: Overall life satisfaction and satisfaction
with life domains are positive functions of CWB.
Method
As previously stated, community-based CWB is enhanced when marketers operating within a community provide goods and services in ways that deliver satisfac-tion across all six dimensions of CWB (shopping/
purchase, preparation/assembly, consumption/use, possession/ownership, maintenance/repair, and disposal).
Sampling and Data Collection
The sample involved 1,955 consumer respondents intercepted in shopping malls or shopping centers in major cities in the following ten states/countries: United States (San Bernardino, California, n= 234; and Minneapolis, Minnesota, n = 155), Canada (Montreal, Quebec, n = 447), Switzerland (St. Gallen, n= 100), Germany (Mainz,
n= 130), Spain (Barcelona, n = 93), Turkey (Ankara, n =
174), Egypt (Cairo, n = 150), Korea (Seoul, n = 202), China (Hong Kong, n = 150), and Australia (Perth, n = 120). Data were collected from consumer samples of dif-ferent countries to accomplish two goals. The first goal was to maximize variance in the measures and to create a universal measure of community-based CWB. That is, collecting data from different communities across the globe allowed us to maximize the variance in the mea-sures, which was helpful to testing its validity. The second goal was to improve the Lee et al. (2002) measure of CWB by making it applicable to all kinds of communities across the globe. In other words, the goal here is to pro-duce a community-based CWB measure that has universal appeal and applicability. Readers should note that the goal was not to conduct cross-cultural comparisons.
The data were pooled across country samples. The demographic profile of the pooled sample is as follows: mean age = 28.2 (SD = 18.3); marital status = 55 percent married, 37 percent divorced, 7 percent single, and 1 per-cent widowed; employment status = 68 percent full-time, 21 percent part-time, and 11 percent unemployed; gen-der = 47 percent male, 53 percent female.
The Survey Questionnaire
Scale items were generated by examining closely the items of the Lee et al. (2002) measure and revising those items in the manner described earlier. As shown in Tables 1 through 6, sixty-seven scale items measuring satisfac-tion with various local marketplace experiences across all six dimensions were used. Seven-point scales with anchor points from very dissatisfied to very satisfied captured responses to each measure. The Lee et al. scale employed to capture all the satisfaction items was also a seven-point scale with different semantic categories: 1 = awful, 2 =
bad, 3 = unsatisfactory, 4 = neutral, 5 = satisfactory, 6 = good, and 7 = wonderful. The scale was modified to a
seven-point very dissatisfied to very satisfied measure to ensure balance among the semantic categories.
Measures capturing satisfaction with life domains were adapted from the Lee et al. (2002) study and placed
Satisfaction with Product Ownership Satisfaction with Product Maintenance Satisfaction with Service Use Satisfaction with Product Use Satisfaction with Product Preparation Satisfaction with Shopping Consumer Well-Being Satisfaction with Life Overall e zeta fixed Satisfaction with Disposal Services Satisfaction with Life Domains e Figure1 The Research Model
toward the end of the questionnaire, which in turn were adapted from highly reliable and valid measures of quality-of-life studies (Andrews and Withey 1976; Campbell, Converse, and Rodgers 1976). A single-item measure was also included to capture the respondent’s overall life satisfaction. Again, this measure was adapted from the Lee et al. study (also see Andrews and Withey 1976; Campbell, Converse, and Rodgers 1976). See those measures in the appendix. Demographic items were placed at the end of the questionnaire.
The questionnaire was originally designed in English. Because data collection involved many non-English-speaking countries (Korea, Switzerland, Germany, Spain, Turkey, Egypt, and China), the questionnaire was translated into the native languages spoken in the countries of data collection. To validate meaning equiva-lence of the various measures involved in non-English surveys, a two-step approach was used for each country (e.g., Homburg, Workman, and Jensen 2002). First, the researcher in charge of data collection in the non-English-speaking country translated the questionnaire into the designated native language, and a second researcher back-translated it into English (Douglas and Craig 1983). Then, the two questionnaires were com-pared for conceptual equivalence, and the two translators reconciled differences. Finally, the resulting non-English questionnaire was pretested and further adapted to meet the local market conditions of the country in question.
Our respondents were instructed to skip those ques-tionnaire items that did not apply to them. Therefore, missing data were treated as valid responses, and no cases were eliminated from the pooled sample.
Formative Model Specification
The full set of scale items specifying the scope of each CWB dimension (i.e., shopping, preparation, product use, service use, ownership, maintenance, and disposal) served as the starting point for the construction of the formative measurement model. An issue of particular importance to formative indicators is multicollinearity. High levels of multicollinearity among scale items can be problematic because the influence of each indicator on the latent construct cannot be distinctly determined (Bollen 1989), making the assessment of indicator valid-ity problematic. As pointed out by Bollen and Lennox (1991), a high degree of overlap in variance across indi-cators suggests redundancy in content and identifies such items as candidates for exclusion from the measure. Thus, each scale item was regressed on all remaining scale items within each CWB dimension (Mason and Perreault 1991). All scale items met the cut-off criterion
of a .30 tolerance level, yielding a maximum variance inflation factor of 3.33. Variance inflation factor scores greater than ten indicate high levels of multicollinearity (Nunnally and Bernstein 1994).
All scale items were then aggregated within each CWB dimension by calculating the mean of all scale items within each dimension. Note that missing values were not replaced, because each missing value is a valid response (respondents were specifically instructed to skip items about goods and services with which they had not had local marketplace experience within the past year or so). Thus, the content of the composite measure of each CWB dimension is specific to the respondent and captures only consumer-marketer interactions that the respondent actu-ally experienced. Each CWB dimension measure was then regressed on all remaining dimensions of CWB. Again, all dimensions met the cut-off criterion of a .30 tolerance level, yielding a maximum variance inflation factor of 3.33 across all dimensions of CWB (see Figure 1).
As shown in Figure 1, the research model captures the theoretical relationship between each CWB dimension (i.e., shopping, preparation, product use, service use, own-ership, maintenance, and disposal) and the CWB construct. The research model posits that the direction of causality is from the dimensions of CWB to the higher-order CWB construct. In other words, changes in each dimension of CWB are expected to cause changes in the latent construct of CWB. This conceptualization of the dimensions of CWB requires a formative higher-order measurement model (Jarvis, MacKenzie, and Podsakoff 2003).
To sufficiently identify the formative CWB construct as well as to evaluate the measurement properties of the research model, two reflective indicators were added to the CWB construct (see Figure 1). This approach to for-mative measurement identification is likely to result in sta-ble measurement parameters (Jarvis, MacKenzie, and Podsakoff 2003). This indeterminacy could also be resolved by fixing the error term of the latent factor to zero and establishing the scale of measurement by constraining a path from one of its indicators to be equal to one. However, this conceptualization would not only imply that the formative measure perfectly represents the latent con-struct but also prevent a validity test of its components.
The choice of reflective indicators was guided by con-ceptual considerations. Two measures were included: a global measure of life satisfaction and a measure of life satisfaction that is a composite of satisfaction ratings across ten life domains. For the global measure of life satisfaction, the single-indicator measure of life satisfac-tion employed by Lee et al. (2002; see appendix) was essentially adapted. The validity of that measure is well-established in the quality-of-life research literature (e.g.,
Andrews and Withey 1976; Campbell, Converse, and Rodgers 1976). For the second measure of life satisfac-tion, a composite of satisfaction ratings across ten life domains (community life, work life, career, family life, financial situation, health, leisure life, social life, emotional life, and spiritual life) was used. Again, such a measure of life satisfaction is well accepted in the litera-ture of quality-of-life research based on bottom-up theory of subjective well-being. This theory posits that life satisfaction is made up of positive and negative affect captured in major life domains (see Diener 1984; Diener et al. 1999; Sirgy 2002 for reviews of the research per-taining to the bottom-up theory of subjective well-being). The composite measure of life satisfaction furthermore is supported by empirical studies conducted by many quality-of-life researchers (e.g., Cummins et al. 1994; Frisch 1992). These two reflective measures together not only identify the formative CWB construct in its specific domain but also contribute to establishing its nomological validity (see Figure 1).
Results
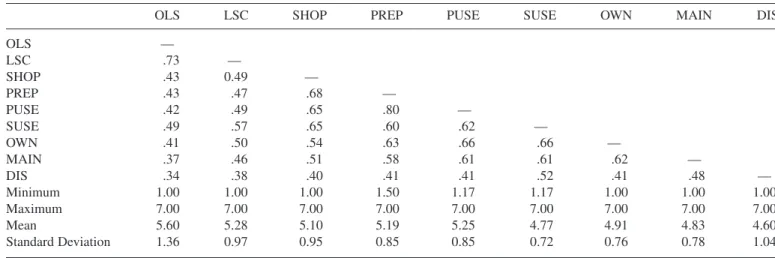
Table 7 shows the correlation matrix and descriptive statistics for the research variables. The variable means are all less than 6 (M= 5.06), and the standard deviations for these variables range from 0.72 to 1.36 (M= 0.92), indicating a substantial amount of variance in the responses. The correlations in Table 7 show significant
positive relationships for the proposed links between CWB dimension, the respondent’s overall life satisfac-tion, and satisfaction with other life domains, lending cursory support for the overall research model.
AMOS 5.0 was used to test the research model (see Figure 1). The formative CWB measurement model was found to fit the data well,χ2= 18.9, df = 6, p = .00,
good-ness of fit = .99, comparative fit index = .99, normed fit index = .99, root mean square error of approximation = .03, p(Close) = .94. Turning to the statistical estimates of the hypothesized structural paths of the higher-order for-mative model, it was found that all but one dimension (product preparation) contributed significantly to the for-mative CWB construct (see Table 8).
As shown in Table 8, it was found that satisfaction with shopping has a positive and significant influence on CWB (γ = .14, t = 5.03), supporting hypothesis 1. The dimension of preparation (or product assembly: hypoth-esis 2), however, did not contribute significantly to CWB (γ = .02, t = 0.55). In relation to the consumption dimen-sion, it was found that as predicted by hypothesis 3 and hypothesis 4, changes in satisfaction with the use of consumer goods (γ = .10, t = 2.83) and services (γ = .31,
t= 10.19) contribute significantly to CWB. Similarly, the
data provide evidence for the positive influence of product ownership (hypothesis 5) and maintenance (hypothesis 6) dimensions on CWB. Specifically, it was found that con-sumers who are satisfied with product ownership (γ = .11,
t= 4.01) and product maintenance (γ = .06, t = 2.05)
expe-rience significantly higher levels of CWB. Finally, in
Table 7
Correlations and Descriptive Statistics
OLS LSC SHOP PREP PUSE SUSE OWN MAIN DIS
OLS — LSC .73 — SHOP .43 0.49 — PREP .43 .47 .68 — PUSE .42 .49 .65 .80 — SUSE .49 .57 .65 .60 .62 — OWN .41 .50 .54 .63 .66 .66 — MAIN .37 .46 .51 .58 .61 .61 .62 — DIS .34 .38 .40 .41 .41 .52 .41 .48 — Minimum 1.00 1.00 1.00 1.50 1.17 1.17 1.00 1.00 1.00 Maximum 7.00 7.00 7.00 7.00 7.00 7.00 7.00 7.00 7.00 Mean 5.60 5.28 5.10 5.19 5.25 4.77 4.91 4.83 4.60 Standard Deviation 1.36 0.97 0.95 0.85 0.85 0.72 0.76 0.78 1.04
Note: All correlations are significant at the .01 level (two-tailed). OLS = satisfaction with life overall; LSC = satisfaction with life domains; SHOP = satisfaction with shopping in the local area; PREP = satisfaction with preparation or assembly of consumer goods; PUSE = satisfac-tion with use of local consumer goods; SUSE = satisfacsatisfac-tion with use of local consumer services; OWN = satisfacsatisfac-tion with ownership of con-sumer durables; MAIN = satisfaction with local maintenance/repair services of concon-sumer durables; DIS = satisfaction with local disposal services.
relation to the disposal dimension, satisfaction with dis-posal services was found to contribute significantly to CWB (γ = .07, t = 3.18), lending support for hypothesis 7. In addition to this overall strong support for the pro-posed CWB research model, as predicted, the formative CWB measure showed strong evidence of predictive valid-ity by significantly predicting the respondent’s life satis-faction (γ = .79, t = 33.77; hypothesis 8). The CWB construct explains 86 percent of the variance in the respon-dent’s overall life satisfaction and 63 percent of the vari-ance in the respondent’s satisfaction in other life domains.
Discussion
The main objective of this article is to extend and fur-ther validate the Lee et al. (2002) measure of community-based CWB. Specifically, the Lee et al. measure was modified and subjected to further tests of predictive (nomological) validity using surveys conducted in ten states/countries (N= 1,955). The pooled data show that satisfaction with shopping, use, consumption, mainte-nance, and disposal has a significant influence on CWB. Furthermore, the data also show that the formative CWB measure was successful in significantly predicting con-sumers’ quality of life (overall life satisfaction and life domain satisfaction).
It should be noted that the only dimension that did not have a significant predictive influence on CWB was preparation satisfaction (or satisfaction related to product assembly). One possible reason for this dimension’s non-significant influence on CWB is that assembly work for major appliances is typically done by the manufacturer. Because assembly work is often considered a part of the service provided by manufacturers, consumers may be less involved in the assembly process. Thus, satisfaction with assembly may not have a significant influence on CWB. Future research should investigate the effect of overall satisfaction with product preparation/assembly on CWB and examine the role of situational, personality, product, cultural, and market factors as moderators of this relationship.
Another explanation may involve the preparation mea-sure itself. Recall that the modified meamea-sure involved ask-ing respondents to indicate how satisfied or dissatisfied they are with their experiences related to the assembly (or preparation) of the following product classes: consumer electronics, furniture, appliances, personal transportation vehicles, clothing and clothing accessories, and lawn and garden tools and equipment. Some of these product classes are assembled by consumers, whereas others are assembled by the manufacturer and still others are assem-bled by local retailers. One can hypothesize that if the costs of product assembly are included in the purchase price, then consumers are likely to have higher expecta-tions of product assembly than if the assembly were to be performed by consumers. Such higher expectations are likely to result in dissatisfaction. Unfortunately, the cur-rent measure did not capture the source of product assem-bly (self, retailer, manufacturer, or some combination). Thus, the measure’s ambiguity may have resulted in less valid responses. Future research should identify the source of product assembly and tally only those satisfac-tion scores related to assembly by the local retailers (because the focus of the measure is the local area, that is, the community).
Future research should also address study limitations. This study used convenience samples from the ten states/countries. Because the main focus of the study was to improve and further validate a formative measure of CWB, data were collected from a variety of communities across the globe. The goal was to maximize the data vari-ation in the measures to help test the predictive (nomo-logical) validity of the measure. Therefore, cross-cultural comparisons were not conducted. Future research should conduct cross-cultural comparisons with representative and comparable samples across countries. Doing so should help uncover differences in the role of various marketplace experiences (e.g., shopping, preparation,
Table 8
Research Model Results
Standard Factor Squared Multiple
Loading t value Correlation
Independent variable Shopping .14 5.03 Product preparation .02 0.55 Product use .10 2.83 Service use .31 10.19 Product ownership .11 4.01 Product maintenance .06 2.05 Disposal services .07 3.18 Dependent variable
Overall life satisfaction .93 .86
Satisfaction in .79 33.77 .63 life domains Fit index χ2 18.9 df 6 Goodness of fit .99
Comparative fit index .99
Normed fit index .99
Root mean square .03
error of approximation
consumption, and ownership) on consumers’ life satis-faction. For example, the United States has been charac-terized as the “disposal society” by many scholars and the media. If this categorization is true, does disposal sat-isfaction play a more important role in consumers’ life satisfaction in the United States (and possibly other developed countries) than in developing countries? If the answer to that question is yes, then public policies related to disposal experiences should be a priority in the developed and not the developing countries. One can also hypothesize that maintenance experiences are more important in developing than in developed countries. Therefore, one can test the hypothesis that maintenance satisfaction plays a stronger role in CWB in developing than in developed countries.
The aforementioned hypotheses point to the possible moderating effect of consumer involvement in CWB. For example, different consumers may have different levels of involvement in shopping, preparation, consumption, ownership, maintenance, and disposal experiences with local products and services. Future research should develop measures of consumer involvement in relation to the various types of marketplace experiences (e.g., shop-ping, preparation, and consumption) and test the moder-ating effect of consumer involvement in the way satisfaction contributes to CWB. For example, shopping involvement is likely to moderate the spillover relation-ship from shopping satisfaction on CWB. Similarly, materialism is likely to moderate the relationship between satisfaction with material possessions and CWB. Shopping involvement and materialism are con-sumer involvement constructs related to the shopping and ownership dimensions of CWB.
This study focused on extending the work of Lee et al. (2002). Future research should use the modified measure to investigate the antecedents and consequences of CWB. Specifically, future research may examine the effectiveness of certain public policies or programs on community-based CWB. For example, one can investi-gate the effect of selected town or city ordinances pro-hibiting the development of shopping malls on community residents’ shopping satisfaction—a signifi-cant dimension of CWB. With respect to the conse-quences of CWB, this study examined one consequence, namely, life satisfaction. Future studies should focus on other consequences such as intention to stay in the com-munity, community cohesion, and community well-being. A logical deduction from this study is the hypothesis that community-based CWB contributes positively and significantly to subjective indicators of
community quality of life (i.e., community residents’ rat-ing highly the quality of life in their community).
Finally, this study focused on subjective indicators of community-based CWB. Future studies should develop corresponding objective indicators of CWB. Objective indicators should further validate the subjective indica-tors. Also, noting discrepancies between subjective and objective indicators of CWB could be informative to community leaders and public policy makers. For example, low ratings on subjective indicators of CWB in a community coupled with high ratings on objective indicators should motivate community leaders to develop promotion and education programs designed to inform community residents of the virtues of CWB in their community.
Public Policy Implications
The public policy implications of the modified CWB measure are as follows. First, much research is available on subjective and objective indicators of community well-being (e.g., Sirgy, Rahtz, and Lee 2005; Sirgy, Rahtz, and Swain 2006). For example, many community planners and economic development specialists gather community statistics on subjective and objective indica-tors of quality of life (e.g., crime rate, teen pregnancy, infant mortality, high school graduation rate, air pollu-tion, etc.). The vast majority of them break down com-munity indicators in terms of broad categories such as economic, social, health, and environmental indicators. One would expect that CWB statistics would be sub-sumed under economic indicators of community quality of life. In reality, typical economic indicators that show up in the community quality-of-life indicator reports focus on jobs. To date, community planners do not gather quality-of-life statistics on CWB. It is time that they do. It is hoped that this community-based CWB is a first step in this direction.
Second, given that community-based CWB statistics are collected by various communities, the information can help community leaders and public policy officials identify areas of strengths and weakness in relation to marketplace experiences within their communities. For example, if community-based CWB statistics show that the majority of residents are unhappy with shopping facilities in the local area, community leaders and public policy officials should engage in a concerted effort to attract developers of shopping facilities to their commu-nity. If CWB statistics indicate dissatisfaction with product preparation experiences, then community
leaders and public policy officials may develop and/or encourage local retailers to offer product preparation/ assembly services to meet market demand. If CWB sta-tistics indicate dissatisfaction with residents’ consumption experiences of local products and services (e.g., restau-rant and entertainment services), then community leaders and public policy officials should develop pro-grams to improve the quality of these services in the community or recruit new services. If CWB statistics indicate dissatisfaction with product ownership (e.g., home ownership), then community leaders and public policy officials should develop policies and programs to enhance the ownership of specific product categories (e.g., home ownership). If CWB statistics indicate dis-satisfaction with maintenance experiences (e.g., auto-motive), then community leaders and public policy officials should develop policies and programs to improve the quality of specific repair services or attract new ones to the local area. If CWB statistics indicate dissatisfaction with disposal experiences (e.g., comput-ers and other electronic devices), then community leaders and public policy officials should develop poli-cies and programs to improve the quality of disposal services or attract new ones to the area.
Third, questions arise concerning who should collect community-based CWB statistics. Chambers of com-merce exist in localities in many countries. It is recom-mended that such organizations take on the task of collecting CWB statistics—if not the local Chamber of Commerce, then perhaps the local Better Business Bureau. Local Better Business Bureaus (and other orga-nizational counterparts) not only are popular in the United States but also are emerging in other Western countries (e.g., the United Kingdom, Canada, Australia, and New Zealand). Local Better Business Bureaus are equipped to handle this task effectively. Other possible organizations include local chapters of marketing-related professional societies. For example, in the United States, the American Marketing Association has local chapters in many parts of the country. Gathering local CWB statistics can be incorporated as part of their mission. Alternatively, in many communities, statistics are gathered by specialized research organizations that are created exactly for that purpose. These research organizations tend to be the result of community foun-dations, community planning services, and colleges or universities located in the region. These research orga-nizations can incorporate CWB measures among their repertoire of indicators. If none of these organizations are willing to shoulder the burden of gathering CWB statistics, consumer advocacy organizations should fill
the void. There are many domestic and international consumer advocacy organizations that can take on this challenge. This is a call for action.
Appendix
Satisfaction with Life Domains (LSC)
Please indicate how satisfied or dissatisfied you are with each of the following:
1. Your community (local area of your residence) 2. Your work situation (job and employer)
3. Your career development (learning & achievements) 4. Your family life (relationship w/ family
members)
5. Your financial situation (income, debts, & assets) 6. Your health (physical and mental health)
7. Your leisure life (fun & leisure activities) 8. Your social life (friendships & fellowship) 9. Your emotional life (love, sex, intimacy, &
romance)
10. Your spiritual life (religious activities & spirituality)
Overall Life Satisfaction (OLS)
Please indicate how satisfied or dissatisfied you are with your life overall (happiness in life & life satisfaction).
References
Andrews, Frank M., and S. B. Withey. 1976. Social indicators of
well-being: America’s perception of quality of life. New York: Plenum.
Bollen, Kenneth A. 1989. Structural equations with latent variables. New York: John Wiley.
Bollen, Kenneth, and Richard Lennox. 1991. Conventional wisdom on measurement: A structural equation perspective. Psychological
Bulletin 110(2): 305-14.
Campbell, Angus C., Philip E. Converse, and W. L. Rodgers. 1976.
The quality of American life. New York: Russell Sage.
Cummins, Robert A., Marita P. McCabe, Yolando Romeo, and Eleonora Gullone. 1994. The Comprehensive Quality of Life Scale (ComQol): Instrument development and psychometric eval-uation on college staff and students. Educational and
Psychological Measurement 54(2): 372-82.
Day, Ralph L. 1978. Beyond social indicators: Quality of life at the individual level. In Marketing and the quality of life, ed. Fred D. Reynolds and Hiram C. Barksdale, 11-18. Chicago: American Marketing Association.
———. 1987. Relationship between life satisfaction and consumer satisfaction. In Marketing and quality-of-life interface, ed. A. C. Samli, 289-311. Westport, CT: Greenwood.
Diener, Ed. 1984. Subjective well-being. Psychological Bulletin
75(3): 542-75.
Diener, Ed, E. Suh, R. Lucas, and H. Smith. 1999. Subjective well-being: Three decades of research. Psychological Bulletin 125(2): 276-302.
Douglas, Susan P., and C. Samuel Craig. 1983. International
market-ing research. Englewood Cliffs, NJ: Prentice Hall.
Frisch, Michael B. 1992. Use of the Quality-of-Life Inventory in problem assessment and treatment planning for cognitive therapy of depression. In Comprehensive casebook of cognitive therapy, ed. A. Freeman and F. Dattilio, 27-52. New York: Plenum. Homburg, Christian, John P. J. Workman, and Ove Jensen. 2002. A
configurational perspective on key account management. Journal
of Marketing 66(2): 38.
Jarvis, Cheryl B., Scott B. MacKenzie, and Philip M. Podsakoff. 2003. A critical review of construct indicators and measurement model misspecification in marketing and consumer research.
Journal of Consumer Research 30(2): 199-218.
Lee, Dong-Jin, M. Joseph Sirgy, Val Larsen, and Newell D. Wright. 2002. Developing a subjective measure of consumer well-being.
Journal of Macromarketing 22(2): 158-69.
Leelakulthanit, Orose, Ralph Day, and Rockney Walters. 1991. Investigating the relationship between marketing and overall satisfaction with life in a developing country. Journal of
Macromarketing 11(Spring): 3-23.
Mason, Charlotte H., and William D. Perreault. 1991. Collinearity, power, and interpretation of multiple regression analysis. Journal
of Marketing Research 28(August): 268-80.
Nakano, Noriyuki, Maurice MacDonald, and Robin Douthitt. 1995. Toward consumer well-being: Consumer socialization effects of work experience. In Developments in quality-of-life studies in
marketing, vol. 4, ed. M. Joseph Sirgy, H. Lee Meadow, Don
Rahtz, and A. C. Samli, 107-11. Blacksburg, VA: International Society for Quality-of-Life Studies.
Nunnally, Jum C., and Ira H. Bernstein. 1994. Psychometric theory. New York: McGraw-Hill.
Sirgy, M. Joseph. 2001. Handbook of quality-of-life research: An
eth-ical marketing perspective. Dordrecht, the Netherlands: Kluwer
Academic.
———. 2002. The psychology of quality of life. Dordrecht, the Netherlands: Kluwer Academic.
Sirgy, M. Joseph, and Terri Cornwell. 2001. Further validation of the Sirgy et al.’s measure of community quality of life. Social
Indicators Research 56:125-43.
Sirgy, M. Joseph, and Dong-Jin Lee. 2006. Macro measures of con-sumer well being (CWB): A critical analysis and a research agenda. Journal of Macromarketing 26(June): 1-19.
Sirgy, M. Joseph, Don Rahtz, Muris Cicic, and Robert Underwood. 2000. A method for assessing residents’ satisfaction with
community-based services: A quality-of-life perspective. Social
Indicators Research 49:279-316.
Sirgy, M. Joseph, Don Rahtz, and Dong-Jin Lee. 2005. Community
quality-of-life indicators: Best cases I. Dordrecht, the Netherlands: Kluwer Academic.
Sirgy, M. Joseph, Don Rahtz, and David Swain. 2006. Community
quality-of-life indicators: Best cases II. Dordrecht, the Netherlands:
Springer.
M. Joseph Sirgy is a professor of marketing at Virginia Tech, United States. Dong-Jin Lee is a professor of marketing at Yonsei University, Korea (e-mail: [email protected]).
Stephan Grzeskowiak is an assistant professor of marketing at St.
Thomas University, United States (e-mail: sgrzeskowia@
stthomas.edu).
Jean-Charles Chebat is a professor of marketing at the HEC Montreal, Canada (e-mail: [email protected]).
J. S. Johar is a professor of marketing at California State University–San Bernardino, United States (e-mail: vjohar@ csusb.edu).
Andreas Hermann is a professor of marketing at St. Gallen University, Switzerland (e-mail: [email protected]).
Salah Hassan is a professor of marketing at George Washington University, United States (e-mail: [email protected]).
Ibrahim Hegazy is an associate professor of marketing at the American University in Cairo (e-mail: hegazy@aucegypt. edu).
Ahmet Ekici is an assistant professor of marketing at Bilkent University, Turkey (e-mail: [email protected]).
Dave Webb is a senior lecturer of marketing at the University of Western Australia (e-mail: [email protected]. edu.au).
Chenting Su is an associate professor of marketing at City University of Hong Kong (e-mail: [email protected]).
Jordi Montana is a professor of marketing at ESADE, Spain (e-mail: [email protected]).