GLOBAL RISK FACTORS AND STOCK RETURNS DURING
BULL AND BEAR MARKET CONDITIONS: EVIDENCE
FROM EMERGING ECONOMIES IN EUROPE
Sercan Demiralay
*Abstract
This paper explores the dependence of emerging European stock markets (Bulgaria, Croatia, Czech Republic, Hungary, Poland, Romania, Russia, Turkey and Ukraine) on global risk factors (changes in gold prices, US implied volatility index and oil prices) based on daily data from 6 January 2004 to 31 December 2013. We employ a quantile regression model to analyse how the global factors affect stock returns under different market circumstances, such as bearish (lower quantiles), normal (intermediate quantile) and bullish (higher quantiles) times. Empirical results reveal that the response of stock markets is heterogeneous; larger equity markets, such as Poland, Russia and Turkey, are highly sensitive to the global factors while Bulgaria is the least sensitive. Overall, the dependence on gold and oil prices is positive while the dependence on US stock market uncertainty is negative. Additionally, in most of the cases, the dependence intensifies during bear market conditions, in which stock prices fall.
Keywords: Global risk factors, Emerging markets, Quantile regression JEL Classification: C21, G10, G11
1. Introduction
In recent years, emerging equity markets have attracted the interest of international investors who wish to exploit profits from portfolio diversification. Global investors headed towards emerging European economies to avoid potential losses due to financial crises and adverse economic conditions in Asian and Latin American countries in the late 1990s (Demiralay and Bayraci, 2015). Privatisation and liberalisation reforms, particularly after the fall of communism and the socialist regime in Central and Eastern European (CEE) countries, have opened the door to new investment opportunities. Furthermore, financial integration has played a key role for the development of stock exchanges in emerging markets by allowing a more efficient allocation of resources and improving risk sharing.1
Equity market integration may also contribute to the synchronisation of economic activity
1 As stated by Coeurdacier et al. (2015), capital flows from capital-abundant to capital-scarce economies increase welfare since the marginal product of capital is higher in the latter than in the former, allowing a more efficient saving allocation towards the most productive use. Financial openness also enables countries to diversify idiosyncratic shocks away.
* Sercan Demiralay, Faculty of Economics, Administrative and Social Sciences, Istanbul Gelisim University, Turkey ([email protected]).
(business cycle).2 However, as a result of globalisation and the integration process, they
have become more fragile to global shocks.
In existing empirical finance literature, some scholars examine the impact of global risk factors, such as variations in gold prices, stock market uncertainty and oil prices, on equity returns (Mensi et al., 2014; Naifar, 2016; Mensi et al., 2016). Previous related studies mostly concentrate on the largest emerging economies, such as BRICS countries (Brazil, Russia, India, China and South Africa). However, given the rapid economic growth and increasing investment flows in emerging European countries, analysing how stock markets in these countries react to global factors is highly important for international investors, portfolio managers and policy makers.
This study examines the effects of global risk factors on stock returns of nine emerging European countries (Bulgaria, Croatia, Czech Republic, Hungary, Poland, Romania, Russia, Turkey and Ukraine). The global risk factors include the gold prices in USD per ounce, the implied volatility index (VIX) of the Chicago Board Options Exchange (CBOE) and the crude oil price in USD per barrel. The main motivation for the selection of the global risk factors arises from the fact that gold and oil are heavily used by international investors for hedging and diversification purposes. In addition, US stock market (S&P 500) uncertainty represented by the VIX significantly affects investors’ risk perceptions. The quantile regression (QR) technique is conducted to model the dependence structure between emerging European stock returns and global risk factors. The QR method enables us to empirically investigate the conditional dependence of different quantiles of emerging markets’ stock returns in Europe with regard to the risk factors. In this context, the QR technique is highly useful for our study as it allows us to examine the reaction of emerging markets to the global factors under different market conditions, such as bearish (lower quantiles), normal (intermediate quantile) and bullish (higher quantiles) times.
Our overall results suggest heterogeneous sensitivity of stock markets to the global risk factors; stock returns of larger countries, such as Poland, Russia and Turkey, are highly dependent on global risk factors. The dependence structure is asymmetric in some cases; the significance and magnitude of the coefficients vary across quantiles of the conditional distribution. The overall results suggest that the emerging European stock returns are positively dependent on gold and oil price changes while they are negatively affected by VIX changes. Furthermore, most of the quantile parameters are larger in magnitude at lower quantiles compared to upper quantiles, showing that the dependence gains intensity when the stock markets are bearish.
Our main contribution to the existing literature is twofold. First, this study investigates the dependence of emerging European stock market returns on global risk factors as previous relevant studies mostly focus on developed markets or large emerging markets, such as BRICSs. Second, we analyse the dependence structure within the QR framework, which allows us to model the co-movement dynamics under changing market circumstances.
2 For studies investigating the links between financial integration and output synchronisation, see among others Imbs (2006), Claessens et al. (2012) and Dées and Zorell (2012).
In this regard, our results from this research are of particular importance for international investors and policy makers. The results provide implications for investors in terms of hedging and diversification opportunities under different market conditions. For policy makers and authorities, understanding the sensitivity of stock returns to global factors may help formulating optimal policy decisions with regard to implementation of regulatory measures in mitigating the adverse effects of global shocks.
2. Background and Brief Literature Review
In the existing literature, previous works mostly focus on the links between only one global risk factor and developed/large emerging stock markets. A few studies analyse the dependence structure between multiple risk factors and stock returns. In their seminal paper, Mensi et al. (2014) examine the impacts of global factors (changes in S&P 500 stock index, gold, oil, VIX and US economic policy uncertainty) on stock returns in BRICS countries by employing the QR method. Their results show that BRICS stock markets display dependence on the global factors, except US economic policy uncertainty. In another study, Mensi et al. (2016) analyse the asymmetric dependence between BRICS equity markets and country risk ratings in the presence of global factors. Their findings show that oil and gold markets positively affect the BRICS market performance while increases in the VIX index cause reductions in BRICS stocks.
The effect of gold price changes on stock returns is widely investigated by various researchers (El Hedi Arouri et al., 2015; Baur and Lucey, 2010; Baur and McDermott, 2010; Ciner et al., 2013; Hood and Malik, 2013; Gürgün and Ünalmış, 2014; Lucey and Li, 2015). The general perception of gold among investors is that it is a safe haven asset in times of market turbulence. Under adverse stock market conditions, investors switch their portfolios from risky equities towards safer gold investments, leading to higher demand for gold and rising gold prices. Baur and McDermott (2010) define a strong (weak) safe haven asset as “an asset that is negatively correlated (uncorrelated) with another asset or portfolio in certain periods only, e.g., in times of falling stock markets.” They test the safe haven property of gold against stock markets of major developed and emerging countries. Their results suggest that gold is a hedge (negatively correlated with other assets on average) and a safe haven for the majority of the developed markets but not for large emerging markets such as BRIC countries. Baur and Lucey (2010) analyse the safe haven property of gold for German, UK and US stocks and demonstrate that gold is a safe haven asset. They also perform a portfolio analysis and find that the safe haven property of gold is short-lived at around 15 trading days.
The US volatility index (VIX) is a popular barometer of near-term volatility on the US market as it reflects price expectations in the future. The VIX is computed on a real-time basis using the implied volatility of a wide range of S&P 500 call and put options. The VIX is generally referred to as the “investor fear gauge” since studies show that higher VIX values coincide with market turbulence episodes (Whaley, 2000; Whaley; 2009). The VIX index is also commonly used as a proxy for risk aversion and market uncertainty (Bekaert et al.,
2013; Bloom, 2009). Despite the importance of the VIX, its effects on foreign stock markets have received relatively little attention compared to the other risk factors in the empirical literature. Giot (2005) examines the relationship between implied volatility indices and stock markets for S&P 500 and Nasdaq 100 and reports a strong negative link. Sarwar (2012) analyses the intertemporal relationships between the VIX index and stock returns in the US and BRIC countries. The empirical findings provide evidence that the VIX is not a fear measure only for the US equity market but also for the markets of China, Brazil, and India. Tsai (2014) studies the volatility spillover effect on stock markets of five developed countries (France, Germany, Japan, US and UK). The findings indicate that the spillover effect is significantly correlated with the VIX index, suggesting that US stock market sentiments may spread to the studied markets.
Oil prices have significant repercussions on global economic activity and thus exert an influence on stock markets. Theoretically, an increase in oil prices leads to higher input costs and negatively affects firm earnings, which depresses share prices. Increases in oil prices also affect the production costs of many consumption goods and hence the overall consumer price index (CPI). Central banks, consequently, increase interest rates to offset inflationary pressures. Higher interest rates cause lower stock prices as interest rates have a direct impact on discount rates used in the standard equity pricing formulation. Some scholars provide evidence of negative oil effects on stock returns (Jones and Kaul, 1996; Filis and Chatziantoniou, 2014; Driesprong et al., 2008, Lee and Chiou, 2011). On the other hand, some researchers find that oil price increases may positively affect stock market performance, especially in emerging markets (Aloui et al., 2013; Narayan and Narayan, 2010; Cong et al., 2008; Lin et al., 2014; Zhu et al., 2016). The scholars assert that the potential reason behind the positive impact is the rapid economic growth in developing economies during the recent years. Higher energy demand in developing countries causes an increase in oil prices. Therefore, despite the a priori belief that higher oil prices lead to lower stock prices, economic achievements and rapid growth in developing countries would offset the negative impacts of oil price changes.
3. Methodology and Data
3.1 Empirical model
We conduct the Quantile Regression (QR) technique proposed by Koenker and Ba-ssett (1978), which is a robust alternative to the least square estimator for the linear regression model. The Ordinary Least Square (OLS) method only estimates the mean value of the dependent variable for the given independent (exogenous) regressors and does not consider different quantiles of the conditional distribution of the dependent variable. In contrast, the QR model gives us a complete picture of the conditional distribution and allows us to analyse asymmetric linear dependence as it produces a set of regression curves that differ across distribution quantiles (Mensi et al., 2014). Besides, compared to the OLS estimations, the QR predictor is more robust to the existence of outliers, skewness and heteroscedasticity (Koenker and Hallock, 2001).
Let Y be a dependent variable (stock returns) and linearly dependent on a set of exogenous variables (changes in gold prices, oil prices and VIX in our case). The conditional distribution function of Y is the function F given by F y( ) (Y y y), . In general, the τth quantile of Y is Q( ) inf
y F y: ( )
.By taking a random sample y1, y2, y3, …, yk with the empirical distribution function
ˆ (1/ )
y i
F k y , the empirical unconditional quantile function can be written as:
1 ˆ ˆ inf ˆ y y y Q F F (1)In this case, the quantile regression model can be specified as follows:
( ) ( )
y
Y X with Q X X (2)
where X is the vector of exogenous variables, 0 < τ < 1, Qy(τ│X) represents the τ-th condi-tional quantile of Y and β(τ) is the model parameter to be estimated in the QR model.
The τ-th sample quantile can be written as the solution to the minimisation problem:
: : ˆ ( ) arg min (1 ) i i y i i R i i y i i y Q y y
(3) Qˆy
arg min
i
R i y
with the check function that splits the error terms into positives and negatives:
0 ( ) 1 0 u u u u u As stated by Mensi et al. (2014) and Reboredo and Uddin (2016), the dependence structure of stock returns based on a particular exogenous variable (risk factors in our case) can be (1) constant when β(τ) coefficients do not change across τ; (2) mono-tonically decreasing (increasing) when β(τ) coefficients decrease (increase) across τ; (3) symmetric (asymmetric) when β(τ) coefficients are similar (different) for low and high quantiles.
The quantile regression equations are estimated at τ = 0.05; 0.1; 0.25; 0.5; 0.75; 0.9; 0.95. In order to ensure that the statistical inference is valid, the pairs bootstrapping by Buchinsky (1995) is used to compute the standard errors given that the errors produced with this method are asymptotically valid under heteroscedasticity and misspecification. This method of bootstrapping includes drawing pairs with replacement from the sample, each with equal probability (Chevapatrakul, 2015). The Monte Carlo simulation results documented by Buchinsky (1995) suggest that the pairs-bootstrap estimator produces the best results.
3.2 Data and descriptive statistics
The data used in this paper are the daily equity returns from 6 January 2004 to 31 December 2013.3 The data set includes the stock indices of Bulgaria (BSE SOFIX),
Croatia (CROBEX), the Czech Republic (PX), Hungary (BUX), Poland (WIG), Romania (BET), Russia (RTSI), Turkey (BIST) and Ukraine (PFTS). The global risk factors consist of gold price per ounce, Brent crude oil per barrel and implied volatility of the S&P 500 stock index measured by the VIX index. For all the variables, we compute the continuously compounded log-returns.4
The descriptive statistics are reported in Table 1. Based on the results, it is apparent that the daily mean stock market returns are positive for the entire sample period. The Romanian stock exchange provides the highest average return during the study period, while the lowest mean return is observed for the Bulgarian market. Among the risk factors, gold and oil give positive returns and the VIX has a negative mean value. In terms of risk profiles measured by standard deviations, the Russian stock market is the most risky whilst the Polish market poses the lowest risk. Therefore, the summary statistics demonstrate the heterogeneity of the sample stock markets with regard to risk-return assessment.
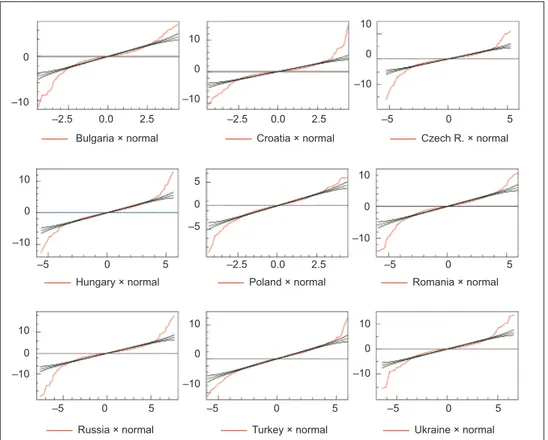
From Table 1, non-normality of the time series is also evident. The skewness values are all negative, except oil and VIX. This suggests that the probability of having a positive return is lower than the probability of getting a negative return for the whole study period. The kurtosis values are all greater than three, indicating larger peaks than a normal distribution would have. Thus, the higher moment statistics imply that the variables have fat tails with large peaks. The non-normality is also verified from the JB test statistics. The statistics indicate that the normality assumption is rejected at the 1% significance level. In addition, the ADF tests are employed for the presence of a unit root in the time series.5 As shown in Table 1, the null hypothesis of a unit root
is rejected at the 1% level and hence the variables are stationary and appropriate for further econometric modelling.
The summary statistics related to the non-normality of stock returns support the implementation of QR modelling. Given that the variables are non-normal, the im- pacts of the global risk factors on stock returns can be asymmetric and non-linear. In Figure 1, the quantile-quantile (QQ) plots for the data are presented to analyse how distribution can change across quantiles. The charts in Figure 1 show that none of the series display a good fit to normal distribution and justify that quantile regression can provide more efficient estimates to examine the dependence structure.
3 The data are extracted from Bloomberg.
4 The log-returns are calculated as rit= log (Pt /Pt−1) * 100, where rit is the continuously compounded return of the market i at the time t, and Pit represents the stock price of the market i at the time t. 5 For more details on unit-root properties of autoregressive time series processes, see Dickey and
T a b le 1 | D e s c ri p ti v e St a ti s ti c s Bulgaria C roat ia Cz ech Re public Hungar y P oland R omania Russia T u rk e y Uk ra ine G old O il VI X Mean 0. 0 1 5 0 .0 36 0. 0 2 7 0 .0 1 7 0. 0 3 2 0 .0 6 6 0. 0 1 7 0 .0 4 3 0. 05 5 0 .0 38 0. 0 4 5 − 0. 0 0 3 Me dian 0. 0 4 8 0 .0 3 9 0. 0 8 1 0 .0 3 9 0. 0 7 1 0 .0 7 5 0. 1 2 0 0 .1 0 3 0. 0 8 8 0 .0 8 5 0. 11 3 − 0. 58 6 Maxim u m 7. 2 9 2 1 4 .7 7 9 11 .0 9 3 1 3 .17 8 6 .0 8 4 1 0 .5 6 5 17 .7 8 4 1 2 .1 2 7 1 3 .5 1 8 9 .5 5 4 1 6 .4 1 4 4 9 .6 0 1 M inimum −1 1 .3 6 0 − 1 0 .7 6 4 −1 6 .1 8 5 − 1 2 .6 4 9 −1 0 .1 8 6 − 1 4 .3 0 9 − 2 0 .6 5 7 − 11 .0 6 4 −15 .4 8 1 − 8 .9 1 3 − 1 2 .8 2 7 − 3 5 .0 5 9 St d . D e v . 1. 3 2 4 1 .3 2 2 1. 5 7 4 1 .6 7 0 1. 3 11 1 .7 6 6 2 .2 6 4 1 .7 76 1. 9 4 8 1 .3 2 4 2 .3 7 2 6 .7 5 2 Sk ewness − 0 .8 8 8 0. 0 6 1 − 0. 8 2 3 − 0. 0 3 0 − 0. 50 8 − 0.7 9 8 − 0. 89 1 − 0. 30 7 − 0. 2 7 3 − 0. 6 4 1 0 .0 22 0. 6 7 9 Ku rt o s is 1 2 .1 8 2 1 7. 5 3 7 1 5 .66 9 9 .1 4 7 7. 2 7 2 11 .6 3 6 1 6 .096 6. 3 3 7 1 2. 2 11 9 .2 5 0 8.0 0 9 7. 2 7 6 JB 9 ,1 5 8. 5 5 8 2 2 ,1 2 8. 7 0 0 1 7, 088.6 9 0 3 ,9 5 6 .2 5 2 2 ,0 1 9 .3 2 9 8 ,0 7 5 .5 0 2 1 8 ,2 9 1 .3 3 0 1 ,2 0 5 .2 0 9 8 ,9 1 4 .9 9 3 4 ,2 6 2. 2 5 0 2 ,6 2 7. 2 9 5 2 ,1 0 7. 9 2 1 JB (p ) 0 .000 0 .000 0 .000 0 .000 0 .000 0 .000 0 .000 0 .000 0 .000 0 .000 0 .000 0 .000 AD F − 2 3 .1 2 2 − 4 3 .5 9 5 −44 .8 9 8 − 3 5 .7 5 2 −44 .9 4 1 − 44 .6 2 0 3 6 −4 5 .3 8 8 5 1 − 4 8 .3 8 1 − 2 7. 3 3 7 − 4 8 .4 9 4 − 5 0 .8 7 9 − 3 3 .5 8 5 AD F (p ) 0 .000 0 .000 0 .000 0 .000 0 .000 0 .000 0 .000 0 .000 0 .000 0 .000 0 .000 0 .000 N o te s: J B r e p re se n ts th e J a rq u e -B e rr a s tatis ti c s f o r n o rm a li ty . AD F d e n o te s th e Au g m e nte d D ickey -F u ll e r te st f o r u n it r o o t. Sou rc e : A u th or
Figure 1 | Quantile-Quantile Plots for Stock Returns
Source: Author
4. Empirical Results and Discussion
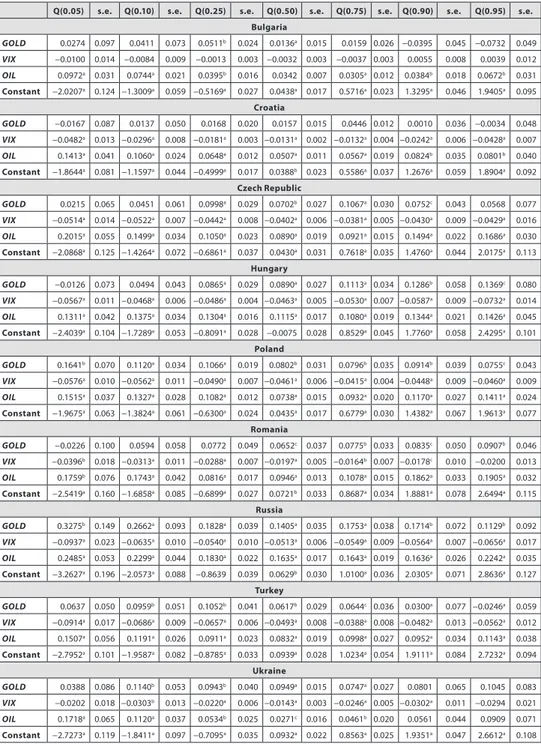
In this section of the paper, the empirical results are presented and discussed. Table 2 reports the estimation results.6
Regarding the effect of gold returns, the empirical findings in Table 2 indicate that gold price variations positively affect most of the emerging market returns in Europe. However, the significance and magnitude of the parameters vary across quantiles of the conditional distribution. In some cases, the significant coefficients are found in the intermediate and the upper quantiles, as in the case of Bulgaria (τ0.25 − τ0.5), the Czech Republic
(τ0.25 − τ0.9), Hungary (τ0.25 − τ0.95), and Romania (τ0.5 − τ0.95). This suggests an asymmetric
co-movement structure with independence in lower tails and dependence in intermediate and higher tails. As for Ukraine, the quantile parameters are statistically significant at lower
6 The Wald tests are also performed to assess whether quantile coefficients are statistically different. We conduct the F-tests for all the models across examined quantiles. For the sake of brevity, we do not exhibit the test results; however, the Wald test findings are available upon request.
––––– Bulgaria × normal ––––– Croatia × normal ––––– Czech R. × normal
0 –10 10 0 –10 5 –5 10 0 –10
––––– Hungary × normal ––––– Poland × normal ––––– Romania × normal
––––– Russia × normal ––––– Turkey × normal ––––– Ukraine × normal
–2.5 0.0 2.5 –2.5 0.0 2.5 –5 0 5 –5 0 5 –2.5 0.0 2.5 –5 0 5 10 0 –10 10 0 –10 10 0 –10 10 0 –10 10 0 –10 –5 0 5 –5 0 5 –5 0 5 10 0 –10 10 0 –10 10 0 –10 5 –5 0
and intermediate quantiles (τ0.1 − τ0.75); the highest coefficient in magnitude is at the 10th
quantile (τ0.1), showing that gold prices affect the Ukrainian stock returns mostly during bearish periods. Gold returns do not influence the Croatian stock returns. The results for Poland, Russia and Turkey demonstrate that gold returns have a significant impact for almost all quantiles of the return distributions, providing evidence that extreme gold price fluctuations considerably influence these stock prices during bear and bull market conditions. The highest quantile parameters are found for τ0.05 in Poland and Russia and
τ0.25 in Turkey. Therefore, the dependence intensifies during bearish market episodes
in these countries.
The quantile regression results point out an interesting connection between the emer-ging markets and gold returns. Intrinsically, gold is perceived as an alternative quality asset that is negatively correlated with stocks during periods of falling stock prices (Baur and McDermott, 2010; Hood and Malik, 2013; Baur and Lucey, 2010; El Hedi Arouri et al., 2015). In this context, gold is a unique and safe haven asset that limits portfolio losses at times of market distress. However, our results are in line with findings of Baur and McDermott (2010) in that gold is not a refuge asset for emerging markets and global investors do not gravitate towards gold investments even at times of falling stock markets. As suggested by Baur and McDermott (2015), even severe losses in emerging markets may not induce investors towards the safe haven as market participants respond differently to external shocks in developing economies. Instead, investors may prefer shifting their portfolios towards safer developed stock markets during market turbulences. Another potential reason behind the positive impact of gold on emerging markets is that the safe haven feature of gold is short-lived. Baur and Lucey (2010) document that gold acts as a safe haven asset for a short time of around 15 trading days.
As for the impacts of implied volatility on the US equity market, the empirical results show significant and negative quantile coefficients in all the countries except Bulgaria. The model parameters are almost all statistically significant, showing that US implied volatility is an important determinant of emerging stock returns in Europe. Most of the quantile parameters are found to be larger in magnitude in lower quantiles compared to upper quantiles, suggesting an asymmetric dependence structure. The dependence gains intensity when the stock markets are bearish.
The VIX as a measure of the implied volatility of S&P 500 options reflects near-term risk expectations of investors. When option premiums are high, investors predict higher volatility, which leads to increased fear and anxiety among stock investors. Therefore, in bearish market conditions, market panic causes higher demand for put options as a hedge against stock price declines and higher VIX values (Naifar, 2016), which is consistent with the negative dependence between implied volatility and emerging market returns. From a different viewpoint, our analysis documents spillover of fear and anxiety resulting from the US market to emerging European stocks. As empirically reported in Tsai (2014) and Mensi et al. (2014), fear on the US market can spread to other countries. In our case, the possibility of a financial recession in the US adversely affects investor sentiment and risk perceptions towards the emerging markets under investigation.
As can be seen from the empirical results, oil prices have a statistically significant and positive impact on the distributions of emerging stock returns in Europe. The largest coefficients are found in lower quantiles, except Hungary and Romania, suggesting an asymmetric tail dependence structure and a higher level of co-movement during bearish market episodes with low expected returns. The dependence loses intensity during normal times with average returns while there is relatively increased dependence during bull markets with high expected returns.
There is an ongoing debate on the sign of the relation between oil prices and stock returns. The empirical findings in the existing literature are mixed due to the nature of oil shocks (demand-side and supply-side shocks) and country characteristics (oil-im-porting and oil-ex(oil-im-porting). Our results are inconsistent with the mainstream theoretical expectation that oil prices exert a negative influence on stock returns as found in some studies, such as Jones and Kaul (1996), Driesprong et al. (2008), Filis (2010) and Lee and Chiou (2011). However, our findings support the results of Narayan and Narayan (2010), Lin et al. (2014) and Tsai (2015) in that higher stock prices are accompanied by higher oil prices. This empirical finding may be attributed to economic growth dynam-ics in the studied emerging markets; growth of the developing economies may offset the negative influence of adverse oil price changes even in bear market conditions. Furthermore, oil price increases are sometimes associated with a booming economy; higher global demand for oil accelerates economic activity, which also increases the de-mand for production factors such as labour. The economy is stimulated by higher wages and increased spending, contributing to the economic growth and hence higher stock prices. More clearly, as stated by Kilian and Park (2009), higher oil prices due to an unexpected global economic expansion may positively drive stock returns since a posi-tive shock to the global business cycle stimulates economic activity and the same shock drives both oil prices and stock returns. Our findings are also consistent with those provided by Aloui et al. (2013), who document a positive effect of oil price changes on six CEE countries’ stock returns. They highlight the importance of the global busi-ness cycle; both oil price and stock returns are cyclically and strongly related to global business performance.
The empirical findings of this study have crucial implications for portfolio mana-gement and risk modelling. The emerging stock market returns in Europe are positively related to gold price changes, which casts doubt on gold’s ability as a safe haven asset. Moreover, oil price variations have contagious effects as the dependence between the sample markets and oil prices is very strong and highly positive. In this regard, gold and oil cannot provide additional protection for investors at times of falling stock returns. Expected financial market uncertainty measured by the VIX negatively affects the stock returns, suggesting that the emerging equity markets experience declines when US risk aversion increases. Therefore, constructing a portfolio with the sample markets may not be optimal given that potential diversification benefits can diminish when global risk factors are considered.
Table 2 | Quantile Regression Results
Q(0.05) s.e. Q(0.10) s.e. Q(0.25) s.e. Q(0.50) s.e. Q(0.75) s.e. Q(0.90) s.e. Q(0.95) s.e. Bulgaria GOLD 0.0274 0.097 0.0411 0.073 0.0511b 0.024 0.0136a 0.015 0.0159 0.026 −0.0395 0.045 −0.0732 0.049 VIX −0.0100 0.014 −0.0084 0.009 −0.0013 0.003 −0.0032 0.003 −0.0037 0.003 0.0055 0.008 0.0039 0.012 OIL 0.0972a 0.031 0.0744a 0.021 0.0395b 0.016 0.0342 0.007 0.0305a 0.012 0.0384b 0.018 0.0672b 0.031 Constant −2.0207a 0.124 −1.3009a 0.059 −0.5169a 0.027 0.0438a 0.017 0.5716a 0.023 1.3295a 0.046 1.9405a 0.095 Croatia GOLD −0.0167 0.087 0.0137 0.050 0.0168 0.020 0.0157 0.015 0.0446 0.012 0.0010 0.036 −0.0034 0.048 VIX −0.0482a 0.013 −0.0296a 0.008 −0.0181a 0.003 −0.0131a 0.002 −0.0132a 0.004 −0.0242a 0.006 −0.0428a 0.007 OIL 0.1413a 0.041 0.1060a 0.024 0.0648a 0.012 0.0507a 0.011 0.0567a 0.019 0.0824b 0.035 0.0801b 0.040 Constant −1.8644a 0.081 −1.1597a 0.044 −0.4999a 0.017 0.0388b 0.023 0.5586a 0.037 1.2676a 0.059 1.8904a 0.092 Czech Republic GOLD 0.0215 0.065 0.0451 0.061 0.0998a 0.029 0.0702b 0.027 0.1067a 0.030 0.0752c 0.043 0.0568 0.077 VIX −0.0514a 0.014 −0.0522a 0.007 −0.0442a 0.008 −0.0402a 0.006 −0.0381a 0.005 −0.0430a 0.009 −0.0429a 0.016 OIL 0.2015a 0.055 0.1499a 0.034 0.1050a 0.023 0.0890a 0.019 0.0921a 0.015 0.1494a 0.022 0.1686a 0.030 Constant −2.0868a 0.125 −1.4264a 0.072 −0.6861a 0.037 0.0430a 0.031 0.7618a 0.035 1.4760a 0.044 2.0175a 0.113 Hungary GOLD −0.0126 0.073 0.0494 0.043 0.0865a 0.029 0.0890a 0.027 0.1113a 0.034 0.1286b 0.058 0.1369c 0.080 VIX −0.0567a 0.011 −0.0468a 0.006 −0.0486a 0.004 −0.0463a 0.005 −0.0530a 0.007 −0.0587a 0.009 −0.0732a 0.014 OIL 0.1311a 0.042 0.1375a 0.034 0.1304a 0.016 0.1115a 0.017 0.1080a 0.019 0.1344a 0.021 0.1426a 0.045 Constant −2.4039a 0.104 −1.7289a 0.053 −0.8091a 0.028 −0.0075 0.028 0.8529a 0.045 1.7760a 0.058 2.4295a 0.101 Poland GOLD 0.1641b 0.070 0.1120a 0.034 0.1066a 0.019 0.0802b 0.031 0.0796b 0.035 0.0914b 0.039 0.0755c 0.043 VIX −0.0576a 0.010 −0.0562a 0.011 −0.0490a 0.007 −0.0461a 0.006 −0.0415a 0.004 −0.0448a 0.009 −0.0460a 0.009 OIL 0.1515a 0.037 0.1327a 0.028 0.1082a 0.012 0.0738a 0.015 0.0932a 0.020 0.1170a 0.027 0.1411a 0.024 Constant −1.9675a 0.063 −1.3824a 0.061 −0.6300a 0.024 0.0435a 0.017 0.6779a 0.030 1.4382a 0.067 1.9613a 0.077 Romania GOLD −0.0226 0.100 0.0594 0.058 0.0772 0.049 0.0652c 0.037 0.0775b 0.033 0.0835c 0.050 0.0907b 0.046 VIX −0.0396b 0.018 −0.0313a 0.011 −0.0288a 0.007 −0.0197a 0.005 −0.0164b 0.007 −0.0178c 0.010 −0.0200 0.013 OIL 0.1759b 0.076 0.1743a 0.042 0.0816a 0.017 0.0946a 0.013 0.1078a 0.015 0.1862a 0.033 0.1905a 0.032 Constant −2.5419a 0.160 −1.6858a 0.085 −0.6899a 0.027 0.0721b 0.033 0.8687a 0.034 1.8881a 0.078 2.6494a 0.115 Russia GOLD 0.3275b 0.149 0.2662a 0.093 0.1828a 0.039 0.1405a 0.035 0.1753a 0.038 0.1714b 0.072 0.1129b 0.092 VIX −0.0937a 0.023 −0.0635a 0.010 −0.0540a 0.010 −0.0513a 0.006 −0.0549a 0.009 −0.0564a 0.007 −0.0656a 0.017 OIL 0.2485a 0.053 0.2299a 0.044 0.1830a 0.022 0.1635a 0.017 0.1643a 0.019 0.1636a 0.026 0.2242a 0.035 Constant −3.2627a 0.196 −2.0573a 0.088 −0.8639 0.039 0.0629b 0.030 1.0100a 0.036 2.0305a 0.071 2.8636a 0.127 Turkey GOLD 0.0637 0.050 0.0959b 0.051 0.1052b 0.041 0.0617b 0.029 0.0644c 0.036 0.0300a 0.077 −0.0246a 0.059 VIX −0.0914a 0.017 −0.0686a 0.009 −0.0657a 0.006 −0.0493a 0.008 −0.0388a 0.008 −0.0482a 0.013 −0.0562a 0.012 OIL 0.1507a 0.056 0.1191a 0.026 0.0911a 0.023 0.0832a 0.019 0.0998a 0.027 0.0952a 0.034 0.1143a 0.038 Constant −2.7952a 0.101 −1.9587a 0.082 −0.8785a 0.033 0.0939a 0.028 1.0234a 0.054 1.9111a 0.084 2.7232a 0.094 Ukraine GOLD 0.0388 0.086 0.1140b 0.053 0.0943b 0.040 0.0949a 0.015 0.0747a 0.027 0.0801 0.065 0.1045 0.083 VIX −0.0202 0.018 −0.0303b 0.013 −0.0220a 0.006 −0.0143a 0.003 −0.0246a 0.005 −0.0302a 0.011 −0.0294 0.021 OIL 0.1718a 0.065 0.1120a 0.037 0.0534b 0.025 0.0271c 0.016 0.0461b 0.020 0.0561 0.044 0.0909 0.071 Constant −2.7273a 0.119 −1.8411a 0.097 −0.7095a 0.035 0.0932a 0.022 0.8563a 0.025 1.9351a 0.047 2.6612a 0.108
Notes: a,b and c denote the statistical significance at the 1%, 5% and 10% levels. (s.e.) represents robust bootstrapped standard errors.
5. Conclusion
This study analyses the sensitivity of emerging European stock markets to global risk factors. The market data set includes the stock indices of Bulgaria, Croatia, the Czech Republic, Hungary, Poland, Romania, Russia, Turkey and Ukraine. The global risk factors consist of changes in gold prices, the US implied Volatility Index (VIX) and oil prices. The quantile regression method is employed to analyse how the dependence structure between emerging European equity returns and global factors changes during bull and bear market conditions.
The empirical results suggest that the structure and degree of dependence change across emerging markets. Market returns of larger emerging economies such as Poland, Russia and Turkey are found to be highly sensitive to global risk factors, while smaller markets such as Bulgaria and Croatia are the least sensitive. Therefore, it is clear that larger emerging markets in Europe are more prone to shocks originating from the global risk factors. The dependence structure is asymmetric in some cases; the significance and magnitude of the model parameters vary across quantiles of the conditional distribution.
The empirical findings show that gold price changes positively affect most of the emer-ging market returns in Europe, which casts doubt on the safe haven property of gold. Regarding the effects of US equity market uncertainty represented by the VIX, significant and negative quantile coefficients are reported for all the countries except Bulgaria, which indicates that fear and anxiety on US financial markets can spread to emerging European stock markets. As for the oil impact, the results reveal that the dependence of emerging markets on oil price variations is positive, implying that rapid economic growth of the emerging European countries in recent years and global business cycle synchronisation may offset the negative effect of oil price changes. Additionally, our empirical findings demonstrate that, in most of the cases, the dependence gains intensity during bearish market episodes with low expected returns.
References
Aloui, R., Hammoudeh, S., Nguyen, D. K. (2013). A Time-varying Copula Approach to Oil and Stock Market Dependence: The Case of Transition Economies. Energy Economics, 39, 208–221, https://doi.org/10.1016/j.eneco.2013.04.012
Baur, D. G., Lucey, B. M. (2010). Is Gold a Hedge or a Safe Haven? An Analysis of Stocks, Bonds and Gold. Financial Review, 45(2), 217–229, https://doi. org/10.1111/j.1540-6288.2010.00244.x
Baur, D. G., McDermott, T. K. (2010). Is Gold a Safe Haven? International Evidence. Journal of Banking & Finance, 34(8), 1886–1898, https://doi.org/10.1016/j.jbankfin.2009.12.008 Bekaert, G., Hoerova, M., Lo Duca, M. (2013). Risk, Uncertainty and Monetary Policy. Journal of Monetary Economics, 60(7), 771–788, https://doi.org/10.1016/j.jmoneco.2013.06.003 Bloom, N. (2009). The Impact of Uncertainty Shock. Econometrica, 77(3), 623–685,
https://doi.org/10.3982/ecta6248
Buchinsky, M. (1995). Estimating the Asymptotic Covariance Matrix for Quantile Regression Models a Monte Carlo Study. Journal of Econometrics, 68(2), 303–338, https://doi.org/10.1016/0304-4076(94)01652-g
Chevapatrakul, T. (2015). Monetary Environments and Stock Returns: International Evidence Based on the Quantile Regression Technique. International Review of Financial Analysis, 38, 83–108, https://doi.org/10.1016/j.irfa.2015.01.013
Ciner, C., Gurdgiev, C., Lucey, B. M. (2013). Hedges and Safe Havens: An Examination of Stocks, Bonds, Gold, Oil and Exchange Rates. International Review of Financial Analysis, 29, 202–211, https://doi.org/10.1016/j.irfa.2012.12.001
Claessens, S., Kose, M. A., Terrones, M. E. (2012). How do Business and Financial Cycles Interact? Journal of International Economics, 87(1), 178–190, https://doi.org/10.1016/j. jinteco.2011.11.008
Coeurdacier, N., Rey, H., Winant, P. (2015). Financial Integration and Growth in a Risky World. National Bureau of Economic Research. Cambridge Working Paper No. 21817, https://doi.org/10.3386/w21817
Cong, R. G., Wei, Y. M., Jiao, J. L., Fan, Y. (2008). Relationships between Oil Price Shocks and Stock Market: An Empirical Analysis from China. Energy Policy, 36(9), 3544–3553,
https://doi.org/10.1016/j.enpol.2008.06.006
Dées, S., Zorell, N. (2012). Business Cycle Synchronisation: Disentangling Trade and Financial Linkages. Open Economies Review, 23(4), 623–643, https://doi.org/10.1007/ s11079-011-9208-2
Demiralay, S., Bayraci, S. (2015). Central and Eastern European Stock Exchanges under Stress: A Range-Based Volatility Spillover Framework. Finance a Uver, 65(5), 411.
Dickey, D. A., Fuller, W. A. (1979). Distribution of the Estimators for Autoregressive Time Series with a Unit Root. Journal of the American Statistical Association, 74(366), 427,
https://doi.org/10.2307/2286348
Driesprong, G., Jacobsen, B., Maat, B. (2008). Striking Oil: Another Puzzle? Journal of Financial Economics, 89(2), 307–327, https://doi.org/10.1016/j.jfineco.2007.07.008
El Hedi Arouri, M., Lahiani, A., Nguyen, D. K. (2015). World Gold Prices and Stock Returns in China: Insights for Hedging and Diversification Strategies. Economic Modelling, 44, 273–282, https://doi.org/10.1016/j.econmod.2014.10.030
Filis, G. (2010). Macro Economy, Stock Market and Oil Prices: Do Meaningful Relationships Exist among their Cyclical Fluctuations? Energy Economics, 32(4), 877–886, https://doi. org/10.1016/j.eneco.2010.03.010
Filis, G., Chatziantoniou, I. (2014). Financial and Monetary Policy Responses to Oil Price Shocks: Evidence from Oil-importing and Oil-exporting Countries. Review of Quantitative Finance and Accounting, 42(4), 709–729, https://doi.org/10.1007/s11156-013-0359-7
Giot, P. (2005). Relationships between Implied Volatility Indexes and Stock Index Returns. The Journal of Portfolio Management, 31(3), 92–100, https://doi.org/10.3905/ jpm.2005.500363
Gürgün, G., Ünalmış, İ. (2014). Is Gold a Safe Haven against Equity Market Investment in Emerging and Developing Countries? Finance Research Letters, 11(4), 341–348, https://doi.org/10.1016/j.frl.2014.07.003
Hood, M., Malik, F. (2013). Is Gold the Best Hedge and a Safe Haven Under Changing Stock Market Volatility? Review of Financial Economics, 22(2), 47–52, https://doi.org/10.1016/j. rfe.2013.03.001
Imbs, J. (2006). The Real Effects of Financial Integration. Journal of International Economics, 68(2), 296–324, https://doi.org/10.1016/j.jinteco.2005.05.003
Jones, C. M., Kaul, G. (1996). Oil and the Stock Markets. The Journal of Finance, 51(2), 463, https://doi.org/10.2307/2329368
Kilian, L., Park, C. (2009). The Impact of Oil Price Shocks on the U.S. Stock Market. International Economic Review, 50(4), 1267–1287, https://doi.org/10.1111/j.1468-2354.2009.00568.x Koenker, R., Bassett, G. (1978). Regression Quantiles. Econometrica, 46(1), 33, https://doi.
org/10.2307/1913643
Koenker, R., Hallock, K. (2001). Quantile Regression: An Introduction. Journal of Economic Perspectives, 15(4), 43–56, https://doi.org/10.1257/jep.15.4.143
Lee, Y. H., Chiou, J. S. (2011). Oil Sensitivity and its Asymmetric Impact on the Stock Market. Energy, 36(1), 168–174, https://doi.org/10.1016/j.energy.2010.10.057
Lin, C. C., Fang, C. R., Cheng, H. P. (2014). The Impact of Oil Price Shocks on the Returns in China’s Stock Market. Emerging Markets Finance and Trade, 50(5), 193–205. Lucey, B. M., Li, S. (2015). What Precious Metals Act as Safe Havens, and When? Some US
Evidence. Applied Economics Letters, 22(1), 35–45, https://doi.org/10.1080/13504851.2014 .920471
Mensi, W., Hammoudeh, S., Reboredo, J. C., Nguyen, D. K. (2014). Do Global Factors Impact BRICS Stock Markets? A Quantile Regression Approach. Emerging Markets Review, 19, 1–17, https://doi.org/10.1016/j.ememar.2014.04.002
Mensi, W., Hammoudeh, S., Yoon, S. M., Nguyen, D. K. (2016). Asymmetric Linkages between BRICS Stock Returns and Country Risk Ratings: Evidence from Dynamic Panel Threshold Models. Review of International Economics, 24(1), 1–19, https://doi.org/10.1111/roie.12201 Naifar, N. (2016). Do Global Risk Factors and Macroeconomic Conditions Affect Global Islamic
Index Dynamics? A Quantile Regression Approach. The Quarterly Review of Economics and Finance, 61, 29–39, https://doi.org/10.1016/j.qref.2015.10.004
Narayan, P. K., Narayan, S. (2010). Modelling the Impact of Oil Prices on Vietnam’s Stock Prices. Applied Energy, 87(1), 356–361, https://doi.org/10.1016/j.apenergy.2009.05.037
Reboredo, J. C., Uddin, G. S. (2016). Do Financial Stress and Policy Uncertainty have an Impact on the Energy and Metals Markets? A Quantile Regression Approach. International Review of Economics & Finance, 43, 284–298, https://doi.org/10.1016/j.iref.2015.10.043
Sarwar, G. (2012). Is VIX an Investor Fear Gauge in BRIC Equity Markets? Journal of Multinational Financial Management, 22(3), 55–65, https://doi.org/10.1016/j.mulfin.2012.01.003 Tsai, C. L. (2015). How do U.S. Stock Returns Respond Differently to Oil Price Shocks Pre-crisis,
within the Financial Crisis, and Post-crisis? Energy Economics, 50, 47–62, https://doi. org/10.1016/j.eneco.2015.04.012
Tsai, I. C. (2014). Spillover of Fear: Evidence from the Stock Markets of Five Developed Countries. International Review of Financial Analysis, 33, 281–288, https://doi. org/10.1016/j.irfa.2014.03.007
Whaley, R. E. (2000). The Investor Fear Gauge. The Journal of Portfolio Management, 26(3), 12–17, https://doi.org/10.3905/jpm.2000.319728
Whaley, R. E. (2009). Understanding the VIX. The Journal of Portfolio Management, 35(3), 98–105, https://doi.org/10.3905/jpm.2009.35.3.098
Zhu, H., Guo, Y., You, W., Xu, Y. (2016). The Heterogeneity Dependence between Crude Oil Price Changes and Industry Stock Market Returns in China: Evidence from a Quantile Regression Approach. Energy Economics, 55, 30–41, https://doi.org/10.1016/j. eneco.2015.12.027