INVESTIGATING THE EFFECT OF INDOOR SOUNDSCAPING TOWARDS
EMPLOYEES’ MOOD AND PERCEPTION IN OPEN PLAN OFFICES
A Master’s Thesis
by
Volkan Acun
Department of
Interior Architecture and Environmental Design
İhsan Doğramacı Bilkent University
Ankara
August 2015
INVESTIGATING THE EFFECT OF INDOOR SOUNDSCAPING TOWARDS
EMPLOYEES’ MOOD AND PERCEPTION IN OPEN PLAN OFFICES
Graduate School of Economics and Social Sciences
of
İhsan Doğramacı Bilkent University
By
Volkan Acun
In Partial Fulfilment of the Requirements for the Degree of
MASTER OF FINE ARTS
in
DEPARTMENT OF
INTERIOR ARCHITECTURE AND ENVIRONMENTAL DESGIN
İHSAN DOĞRAMACI BİLKENT UNIVERSITY
ANKARA
August, 2015
I certify that I have read this thesis and have found that it is fully adequate, in scope and in quality, as a thesis for the degree of Master of Fine Arts in Interior
Architecture and Environmental Design.
________________________________ (Assoc. Prof. Semiha Yılmazer) Supervisor
I certify that I have read this thesis and have found that it is fully adequate, in scope and in quality, as a thesis for the degree of Master of Fine Arts in Interior
Architecture and Environmental Design.
________________________________ (Assist. Prof. Yasemin Afacan) Examining Committee Member
I certify that I have read this thesis and have found that it is fully adequate, in scope and in quality, as a thesis for the degree of Master of Fine Arts in Interior
Architecture and Environmental Design.
________________________________ (Assoc. Prof. Arzu Gönenç Sorguç) Examining Committee Member
Approval of the Graduate School of Economics and Social Sciences
________________________________ (Prof. Erdal Erel)
iii
ABSTRACT
INVESTIGATING THE EFFECT OF INDOOR SOUNDSCAPING TOWARDS
EMPLOYEES’ MOOD AND PERCEPTION IN OPEN PLAN OFFICES
Volkan Acun
MFA., Interior Architecture and Environmental Design Supervisor: Assoc. Prof. Semiha Yılmazer
August, 2015
Over the past decade, soundscape studies have proposed ways to differentiate sonic environments and showed that it is not always the sound levels that matters. Meanings associated with sound sources, how they are perceived by the listener and the physical settings are equally important. On the other hand, very few studies are conducted to examine whether these principles of soundscape can be applied to indoor spaces. Aim of this research is to identify sound sources within an open office space, understand how employees’ perceive these sound sources, explore its impact on their mood and task performance. In order to achieve this goal,
measurements and interviews are conducted at two different open planed offices. A user focused, subjective, approach of Grounded Theory, is used to capture the lived experience of an open plan office space and examine the effects of indoor soundscape quality towards employees’ perception of their work environment.
iv
PANAS (Positive and Negative Affect Schedule) test is conducted to explore employees’ mood. In order to understand the acoustical conditions of case study settings, in-situ measurements of sound levels (Leq), ODEON simulation of Speech Transmission Index (STI) and Reverberation Time (T 30) is used. Semi-structured interviews, as part of Grounded Theory, and PANAS test are conducted with 47 employees. Their responses are used to generate a conceptual framework which conceptualizes employees’ subjective response to the soundscape of their work environment. Generated conceptual framework showed patterns between
employees' perception of sound sources, sound preference and type of work they are performing as well as the association between positive affect (PA), negative affect (NA) and soundscape.
v
ÖZET
AÇIK PLANLI OFİSLERDE İŞİTSEL PEYZAJIN ÇALIŞANLARIN RUH HALİ VE
ALIGISI ÜZERİNE OLAN ETKİSİNİN ARAŞTIRILMASI
Volkan Acun
Yüksek Lisans, İç Mimarlık ve Çevre Tasarımı Bölümü Tez Yöneticisi: Doç. Dr. Semiha Yılmazer
Ağustos, 2015
Geçtiğimiz on yıllık sürede, işitsel peyzaj çalışmaları, ses ortamını ayırt etmek için pek yöntem sundu ve bu çalışmalar gösterdi ki ses seviyeleri her zaman en önemli konu değil. Ses kaynakları ile ilişkilendirilmiş anlamlar, bu seslerin dinleyici
tarafından algılanışı ve fiziksel ortam, eşit derece önemli. Fakat, işitsel peyzaj prensiplerinin iç mekanlarda uygulanışı ile ilgili çok az çalışma yapılmış
bulunmaktadır. Bu araştırmanın amacı açık planlı ofis ortamındaki ses kaynaklarını belirlemek, çalışanların bu kaynakları nasıl algıladığını bulmak ve bunların
çalışanların ruh hali ve görev performansı üzerine olan etkisini gözlemlemektir. Bu amaca ulaşmak için, iki farklı açık planlı ofis ortamında ölçümler ve görüşmeler yapılmıştır. Bu çalışma, açık planlı ofis ortamını canlandırmak ve işitsel peyzajın, çalışanların algınısı üzerindeki etkisini yakalamak için, subjektif bir yaklaşım olan “Grounded Theory – Köklenmiş Teori” kullanmaktadır. Çalışanların ruh hallerini değerlendirmek için “Positive and Negative Affect Schedule (PANAS) – Pozitif ve Negatif Etki Çizelgesi” testi kullanılmıştır. Vaka çalışması yapılan ortamların akustik
vi
koşullarını anlamak için, yerinde A-Ağırlıklı Eşdeğer Ses Seviyesi (LAeq) ölçümü, ODEON Room Acoustics Software 13.01 Combined, kullanılarak oluşturulan simülasyon ile de Konuşma İletim İndeksi (STI) ve Çınlama Süresi (T 30) hesaplanmıştır. Köklenmiş Teori’nin bir parçası olarak, 47 çalışan ile yarı
yapılandırılmış görüşmeler yapılmıştır. Görüşmelerin sonuçları, çalışanların ofis ortamlarının işitsel peyzajına olan subjektif yaklaşımlarını canlandıran bir kavramsal sistem yaratmak için kullanılmıştır. Oluşturulan bu kavramsal sistem, çalışanların ses kaynaklarını algısını, ses tercihleri, ve yaptıkları iş arasında bağlantıları ortaya çıkartıp, aynı zamanda da işitsel peyzaj ve çalışanların pozitif ve negatif etkisi arasındaki bağlantıyı göstermiştir.
vii
ACKNOWLEDGEMENTS
I would like to express my sincere gratitude to Assoc. Prof. Semiha Yılmazer her encouragement, patience, supervision and guiding me throughout this work. I would also like to thank all examining committee members. I would also like to thank the academic staff of Interior Architecture and Environmental Design Department and the examining committee members for their feedback.
I owe my gratitude to all employees and administrators of Öncüoğlu + ACP
Architects and Promer Engineering Consultancy for letting me use their open office spaces for this thesis. Also special thanks for their patience and cooperation during the interviews.
Sincere thanks Özgün Sinal for his assistance with the ODEON Room Acoustics Software and for his company during conference and preparation of this thesis.
I would like to thank Zühre Sü Gül and all the staff of Mezzo Studyo for providing the necessary software and providing help during the pilot study.
I would also like to thank Dr. Burçak Altay with her feedback and support on the Grounded Theory.
Finally, i would like thank my father Bülent Acun as well as my close friends for their smiling faces and endless support throughout my life.
viii
TABLE OF CONTENTS
ABSTRACT ... iii
ÖZET ... v
ACKNOWLEDGEMENTS ...vii
TABLE OF CONTENTS ... viii
LIST OF TABLES ...xi
LIST OF FIGURES ... xii
CHAPTER 1INTRODUCTION ... 1
1.1. Aim and Scope ... 3
1.2. Structure of Thesis ... 5
CHAPTER 2SOUNDSCAPE ... 7
2.1. The Concept of Soundscape ... 7
2.2. Previous Studies Regarding the Evaluation of Soundscape ... 11
2.2.1. Evaluation Methods of Soundscape ... 16
2.2.1.2. Objective parameters Methods ... 16
2.2.1.2.1. Sound Pressure Level (SPL) and Equivalently Continuous Sound Level (Leq) ... 16
2.2.1.2.2. Reverberation Time ... 18
2.2.1.2.3. Speech Transmission Index (STI) ... 20
2.2.2. Subjective Survey Methods... 20
2.2.2.1. Grounded Theory ... 22
ix
2.3.1. Acoustical Factors ... 25
2.3.2. Psychological Factors ... 29
CHAPTER 3INVESTIGATING THE EFFECT OF INDOOR SOUNDSCAPING TOWARDS EMPLOYEES’ MOOD AND PERCEPTION IN OPEN PLAN OFFICES ... 32
3.1. Design of the Study ... 32
3.1.1. Research Question ... 33
3.1.2. Hypothesis ... 33
3.2. Methodology ... 33
3.2.1. Case Study Settings ... 33
3.2.1.1. Öncüoğlu + ACP Architects ... 34
3.2.1.2. Promer Engineering Consultancy ... 35
3.2.2. Objective Measurements ... 37
3.2.3. Subjective Measurements ... 40
3.2.4. PANAS (Positive and Negative Affect Schedule) ... 41
CHAPTER 4RESULTS ... 43
4.1. Objective Results ... 43
4.1.1. Equivalently Continuous A-Weighting Sound Levels (LAeq) and Reverberation Time (T 30) ... 43
4.1.2. Speech Transmission Index (STI) ... 45
4.1. Subjective Results ... 47
4.1.1. Soundmarks ... 53
4.2. Results of PANAS Test ... 54
CHAPTER 5DISCUSSION ... 59
5.1. Auditory Perception of Soundscape ... 60
5.1.1. What do they prefer to hear? ... 64
5.1.2. Outdoor Sounds ... 69
5.1.3. Soundmarks and Keynote Sounds ... 70
x
CHAPTER 6CONCLUSION ... 74
REFERENCES ... 78
APPENDIX A ... 83
xi
LIST OF TABLES
Table 1. The list and frequency of sound sources perceived by employees…………..52 Table 2. Results of the Spearman’s rho correlation test……….56
Table 1: Output of the independent samples T-Test, conducted using IBM
xii
LIST OF FIGURES
Figure 1. The Taxonomy suggested by Brown et al. (2011) which shows the
categories of spaces and categories of sound sources………..12
Figure 2. Required reverberation time ranges for different types of rooms…………..19
Figure 3. Speech Intelligibility (STI) scale……….20
Figure 4. Flow chart showing the process of grounded theory………23
Figure 5. The prediction schematic, showing the relation between STI and DP (Decrease in Performance)……….………..…27
Figure 6. Determination of radius of privacy, and radius of distraction……….28
Figure 7. Open office space of Öncüoğlu + ACP Architects……….………35
Figure 8. Main office space of Promer Engineering Consultancy………36
xiii
Figure 10. ODEON 3D elevation of Main office space (Office ENG1) of Promer
Engineering Consultancy (Office ENG)……….….…38
Figure 11. ODEON 3D elevation of subspace (Office ENG2) of Promer Engineering Consultancy (Office ENG)……….………39
Figure 12. ODEON 3D perspective of Öncüoğlu + ACP Architects (Office ARCH)…….39
Figure 13. ODEON 3D perspective of Main office space (Office ENG1) of Promer Engineering Consultancy (Office ENG)………..…40
Figure 14. Reverberation times for all central frequencies. The dashed rectangle indicates the common speech frequencies………44
Figure 15. STI Grid response of open plan office of Öncüoğlu + ACP Architects (Office ARCH)………46
Figure 16. STI grid response of open plan office of Promer Engineering Consultancy (Office ENG)……….………46
Figure 17. Sample taken from the transcriptions, which shows how data is broken down into labels during open coding……….48
Figure 18. The conceptual Framework………..50
Figure 19. Soundmarks mentioned by employees of Office ARCH………..……….53
Figure 20. Soundmarks mentioned by employees of Office ENG….………..54
Figure 21. STI grid response of the workstations that are located near the meeting room at upper floor……….62
1
CHAPTER 1
INTRODUCTION
In contemporary world, society tends to disregard hearing, and upraise, what Schafer (1977) calls as “Eye Culture”. Contemporary society, often only pays attention to the sonic environment either when it is too loud or when there is a technological innovation (Truax 2001). There are traditional disciplines, which are scattered throughout, arts, science, engineering and medicine that deals with the behaviour of sound. Yet, when it comes to understand how sound connects with the environment, these disciplines are not enough (Wrightson 1999; Truax, 2001). This field of acoustic communication can only be explored by the interdisciplinary approach of Soundscape (Traux, 2001).
According to the Truax’s Handbook for Acoustic Ecology soundscape can be defined as the ‘‘the environment of sound (or sonic environment with emphasis on the way it is perceived and understood by the individual, or by a society”. It is actually a quite old approach but it significant attention is not payed until 1999s (Brown et al., 2011). The term is first introduced by Schafer in his book “The New Soundscape”.
2
Schafer, being a composer and a scholar, worried that individuals perception is dominated by the eye culture and sound is taken for granted. He addressed this issue as the “sonological competence”. He asked music students to name five environmental sounds which they hear that day, five sounds that they like and 5 sounds that they don’t. In the end he saw that most of the students could not name five sounds even after fifteen minutes (Wrightson, 1999). To address this issue he developed ear cleaning exercises and the soundwalk method, which is widely used in soundscape studies to this day.
Perhaps soundscape can best be summarised as individuals communication with the environment through sound. It is concerned about the context of sound rather than the energy. According to Truax (2001), a sounds’ meaning is partly associated with what produces it but mainly associated with the circumstances it is heard. A music, heard in a bar can be accepted and even perceived positive but same music can be very odd in an office because it is out of context. Based on these, it can be said that, soundscape studies provide a new perspective to our sonic environment, a perspective where our awareness of sound is what really matters.
Soundscape studies became the centre of attention in last decade. In 2008, working group of ISO/TC 43/SCI/WG 54 “Perceptual Assessment of Soundscape Quality of the International Organization for Standardization” was established to create a standardization for soundscape studies. In 2014, working group published ISO 12913-1:2014, the first part of the standard. This part focuses on the concept of
3
soundscape by providing an international consensus on the definition of the term “soundscape”. The standard suggests that soundscape is understood as a
perceptual construct, related to a physical phenomenon and distinguishes the perceptual construct from the physical phenomenon by clarifying that soundscapes exits through the human perception of the acoustic environment. However, this is still the first part of the standard and most of the studies are concerned with the methods to explore outdoor soundscape while assuming that it is mostly the same for indoor soundscape.
At the moment indoor soundscape research significantly lacks case studies. This study is an attempt to provide more information about people’s perception of indoor soundscape. In order to achieve this goal, a research consisting of measurement/simulation of objective parameters and subjective surveys, are conducted at two open planed office spaces.
1.1. Aim and Scope
Due to their flexibility and cost efficiency, open offices has become perhaps the most popular type of workplace since the middle of 20th century. However, they
come with a body of problems such as worker dissatisfaction, increased cognitive workload, fatigue, and loss of concentration and lack of privacy (Haapakangas et al., 2011). To address these issues, a standard has been published in 2012, ISO 3382-3 Measurement of Room Acoustic Parameters – Part 3: Open Plan Offices. This
4
standard specifies measurement methods to provide speech privacy between workstations.
This study aims to address these issues by creating a lived-in experience of an open plan office space to explore employees’ perception of their office soundscape. In order to achieve this goal three means of survey has been conducted at two open offices. These methods are; subjective survey, mood tests and objective
measurements of acoustical properties of offices. Mood
Grounded Theory is used as the main means of subjective survey. Semi structured interviews are conducted with total of 49 employees’. Interviews are concluded once the collected data no longer produced significant conceptual variations (Corbin & Strauss, 1998; Dey, 1999). After each interview employees are asked to fill Positive and Negative Affect Schedule (PANAS) test which is a mood test.
Objective parameters includes measurement of three main acoustical properties of open office spaces. These are Continuous A Weighted Sound Levels (LAeq),
Reverberation Time (T 30) and Speech Transmission Index (STI). T 30 and STI are calculated from a computer simulation using Odeon Room Acoustics Software while LAeq is determined through in-situ measurements. These objective parameters are used to see the acoustical conditions of case study settings and to compare with the subjective survey and mood test.
5
1.2. Structure of Thesis
Study consists of six chapters. The first chapter is Introduction, which gives the main idea about the thesis. It briefly describes the subject, why it is significant, and what is the scope and what is the aim of the study.
Second chapter is the literature review part of the thesis. This chapter is designed to give information about the concepts that will be used throughout the study. It is divided into three sections. First section titled “Concept of soundscape” explains the emergence of this concepts, the underlying themes, its significance, and features of soundscape. Next section gives examples from significant studies briefly, and explains the methods used to evaluate soundscapes. This section is aims to provide a prior knowledge about the evaluation methods. It is intended to be reference for the following sections, a section which gives the definitions of the methods that will be seen further in thesis. Last section of literature review explains the significant acoustical parameters within an office space. This section also provides information and case studies about psychological factors of mood, emotion, and affect.
Third chapter explains the design of the study and methodology. Research questions and hypothesis can be found within in this chapter. Methodology
6
describes the case study setting, and explaining the research procedures by telling why certain research methods are used.
In the fourth chapter, results of the study are presented under two sections; Objective measurements is the first section, which provides the findings of simulations and in-situ measurements. Second section presents the findings of subjective survey, which consists of, Grounded Theory, and PANAS. As it was mentioned previously, soundscape is about individuals’ awareness of his sonic environment. In order to reflect this as clearly as possible employees’ exact answers during the interviews are quoted when it is necessary.
Discussion chapter compares the findings of this research with previous ones and elaborates significant findings to understand the underlying phenomenon. Throughout this chapter, employees’ answers are quoted, to clearly reflect employees’ awareness of their sonic environment. Thesis ends with Conclusion chapter, which summarises the whole research, and refers to possible future studies.
7
CHAPTER 2
SOUNDSCAPE
2.1. The Concept of Soundscape
The World Soundscape Project started at 1969 by R. M. Schafer of Simon Fraser University. Projects aim was to find an ecological harmony between the human community and its sonic environment (Westerkamp, 2006). The project raised public awareness of sound, exploring, and documenting the environmental sound and its changing character, and established the concept and practice of soundscape design (Westerkamp, 2006). It is considered as the foundation of the acoustical ecology studies or, as its more common name, the soundscape studies
(Westerkamp, 2006; Wrightson, 1999). Many of the seminal works are published from this study such as, The Tuning of the World, The Vancouver Soundscape, and The Handbook of Acoustic Ecology.
The term “soundscape” indicates how the environment is understood by the listener (Truax, 2001; Schafer, 1988; Westerkamp, 2006). As the listener is also the
8
sound maker, when we step into an environment we inevitable effect the environment, and the environment affects the way we perceive sounds. World Soundscape Project showed that there is a delicate relationship between listening and sound making. This balance can be used to measure the quality of a sonic environment (Westerkamp, 2006). An imbalance between listening and sound making can be seen in situations where, what we hear is louder than our own sound.
Soundscape approach considers the listener and environment together, not as isolated entities. Listener within a sonic environment engages in a dynamic range of information exchange. The major difference between soundscape and the
traditional energy transfer approach is, one of them is concerned with the
acoustical communication, the individual’s communication with the environment through sound, whereas other one is concerned with the transfer of energy. Truax explains their difference with the classic expression of “if a tree falls in a forest…”
“The tree falling in the forest creates a momentary series of energy transfers whether it is heard or not. Within a communicational framework we will be much more concerned about the information communicated by the sound of that tree (Truax, 2001).”
Schafer (1977) based his theory of soundscape on three foundations; philosophy of music, ecological consciousness and aural culture. In his book “Tuning of the
World”, he proposed a typology for sounds, which divides sounds into three groups. He defined background sounds as “keynote sounds”, a reference to music theory
9
where keynotes identify the fundamental tonality of a music (Schafer, 1977;
Wrightson, 1999). Signal sounds refer to the foreground sounds such as fire alarms. And lastly, soundmarks, a reference to landmarks. Just as the landmark is used to define the space it is associated with, a soundmark is also associated with a certain environment. An example could be the sound of a distinctive church bell.
Just like a certain community’s architecture and customs are associated with its identity, typology of sounds reflect identity of a local environment which can be recognised and characterised by their soundscapes (Wrightson, 1999). However, since the industrial revolution the unique soundscapes started to become
homogenised. What is meant by homogenised is, with the rise of the mechanised world the more quite sounds get masked by louder sounds. Most common example is the soundscape of a city with its dominant keynote, traffic.
Aware of this situation, Schafer described it with the term “hi-fi” (high fidelity) and “lo-fi” (low fidelity). Hi-fi is used to describe environments in which the sounds overlap less frequently, environments more like the pre-industrial era (Schafer, 1977). Lo-fi is the environment in which the sounds are more homogenised (Schafer, 1977).
While transcribing the recording of World Soundscape Project, researchers
10
led to Krause’s “Niche Hypothesis” (1993). Krause stated that, in a natural environment, a sound of mammal or bird fit in relation to all natural sounds in terms of frequency and rhythm. Sounds of each animal and insect occupies small bands of frequencies leaving “spectral niches” into which vocalisations of other animals and insects can fit in. Therefore, on contrary to soundscape of cities, in a natural environment sounds do not mask or block each other, creating a more perceptual sonic environment. Just like the way individuals communicate with environment through sound, animals do the same. Krause’s theory suggests that these niches between frequencies are used by animals to fit in mating calls.
In hi-fi soundscapes, sounds from each frequencies can be heard distinctively. This provides listeners significant amount of information about the physical nature of environment, the context and a sense of place. Truax states that the travelling sound waves are charged each time it interacts with the environment, thus providing information about the physical environment.
On the other hand, in lo-fi soundscapes, due to the homogenised nature of sonic environment, meaningful sounds can be masked. This may even cause an individual to not being able to hear the reflected sound of his/her movement or speech and by creating a “sound wall” (Schafer, 1977) and becoming isolated from the sonic environment (Wrightson, 1999).
11
2.2. Previous Studies Regarding the Evaluation of Soundscape
Soundscape studies started nearly 40 years ago. However, significant attention to the subject is not paid until late 1990’s. As it was stated, currently the working group of ISO/TC/43/SC1 is working towards a standardization of the concept and evaluation of soundscape.
In their paper “Towards standardization in soundscape preference assessment”, Brown et al. (2011) represents authors personal view and suggestions based on the studies of working group of ISO/TC 43/SC1, the group which studies the
standardization of soundscape. This point of view provides a valuable insight about the standardization of soundscape evaluation. They set the focus of soundscape studies as the acoustic environment of any place. They suggested to utilize the term of soundscape as both “acoustic environment of sounds, as perceived by humans” and “the total collection of sounds”. Authors put emphasis on identification and description of sound sources because it gives valuable information about the soundscape of that place as the sound sources can be perceived differently from place to place. In order to do this, authors suggested a taxonomy of the acoustic environment (Figure 1). This taxonomy categorises acoustic environment as indoor and outdoor acoustic environment, while assuming that principles used in outdoor studies also apply to indoors.
12
Figure: The Taxonomy suggested by Brown et al. (2011). It shows the categories of spaces and categories of sound sources.
Fiebig and Schulte-Fortkamp (2004) used grounded theory to create a common perceptive pattern as it provides means to systematically analyse the qualitative data. Mackrill et al. (2013) also used this approach to create a conceptual model that shows patients and nurses perception of a hospital ward.
13
Research conducted by Brambilla et al. (2012) aimed to categorize urban places by means of acoustic descriptors and analysis of relationship between features of objective parameters and subjective laboratory measurements. Researchers conducted soundwalks to record the soundscape of 20 squares in Rome.
Researchers used the recordings for their laboratory study, where they carried out sound recognition and semantic differential tests. They analysed the results using cluster analysis. As Objective parameters, they used LAeq. Authors concluded that soundscape quality assessment can be more comprehensively examined by merging field measurements of physical parameters with subjective ratings of laboratory and/or field.
In a different study, Brambilla et al. (2013) used psychoacoustic parameters, objective measurements of sound levels and face to face interviews to investigate the user’s perception of environmental quality in parks and its relationship with acoustical parameters. They concluded that the sound environment in urban parks are often rated as “good” or “excellent” even if the sound levels are higher than it is supposed to be. Researchers suggested that this can be due to the presence of natural features that gives a sense of tranquillity.
Yang and Kang (2013) also used psychometric parameters to study the
characteristics of various natural and urban environmental sounds and examine their differences. They concluded that sound categories cannot be identified using a single acoustical or psychoacoustical parameter but rather with a group of
14
parameters. They categorized urban sounds in four main groups, birdsong, wind, water, and urban.
Research carried out by Okcu et al, in 2011, aimed to determine if objective noise levels and subjective perceptions differ. Their study focused on the comparing ICUs of two hospitals, one being rather old and other one being new. They used LAeq as the main tool of objective measurement. For the subjective measurement,
researchers conducted a questionnaire survey. This questionnaire consisted of, noise annoyance, perceived loudness and work performance questions. This study revealed that even thought, there are very little difference between the objective measurements, one of the ICUs is perceived louder, more annoying and has greater negative impact of noise towards work performance. Therefore, the results
indicated that the traditional overall noise measurements may be inadequate to capture the differences between perceived annoyance, loudness and performance.
Dökmeci and Kang (2012), used objective and subjective analysis to explore the indoor soundscape of three libraries in Sheffield. They used sound measurements and socio-acoustic questionnaires. Their aim was to understand the objective sonic environment through the acoustic and psychoacoustic parameters and compare it with the perceived evaluation results to explore different factors affecting
soundscape perception. They concluded that objective parameters such as sound pressure level (SPL) and loudness (N) are significantly related with subjective evaluations of the soundscape.
15
Another research about hospitals is conducted by Mackrill et al (2013), which used grounded theory to explore patients and nurses perception of the cardiothoracic ward of a hospital. This study is a major inspiration for this thesis. Researchers applied a user focused approach, which aimed to conceptualize the lived experience of soundscape from patients and nurses, discovering positive and negative aspects. This research also used objective and subjective measurements however, objective measurements are only used to give a general idea about the acoustical conditions of the space. Results showed that, information given about a specific sound can ease the negative feelings towards it. Individuals can also develop coping methods such as habituating or accepting the negative sounds sources. Just as it was stated by Truax (2001) in “Acoustical Communication”, the context of sound has significant importance towards the perception of sonic environment. Patients are more likely to accept a certain sound when they can understand it. Their research also
suggested that physical and cognitive interventions could make the soundscape perceived more positively.
Following up on their findings in hospital soundscape study, Mackrill et al (2013), used laboratory listening evaluations to rate participants’ emotional (relaxation) and cognitive (understanding and interest) responses to a variety of hospital soundscape clips with three interventions. One of the significant findings is, relaxation response is affected by the natural sound interventions by produce 10.1% more positive response. In the end, authors suggest that improving the
16
sounds of a hospital ward provide subjective benefits that cannot be achieved by sound level reduction.
2.2.1. Evaluation Methods of Soundscape
Through the course of soundscape studies, researchers used variety of different approaches to evaluate soundscapes. There are three main approaches, objective parameters, subjective survey and psychoacoustic survey. Each of these approaches consist of various methods and it is very common among researchers to use
combination of different approaches.
Following chapters will explain the objective parameters and subjective survey methods, with emphasis on the methods chosen for this research. As
psychoacoustic survey is not within the scope of this research, there aren’t any chapter explaining its methods and features.
2.2.1.2. Objective parameters Methods
2.2.1.2.1. Sound Pressure Level (SPL) and Equivalently Continuous Sound Level (Leq)
SPL is defined as “the logarithmic measure of the RMS sound pressure of a sound relative to a reference value, the threshold of hearing.” Leq is similar to SPL,
17
however, it is the total amount of sound energy over a given time period. Measurement unit for both of them is the logarithmic scale unit of dB and it is measured by Sound Level Meter.
Human ears can detect the frequencies between 20Hz to 20 000Hz. However, it is more responsive to certain range of frequency which is between 500Hz and 6000Hz. Human ears are less sensitive to very low and very high frequencies. Frequency weighting is a method that is used to capture humans’ subjective response to the objective sound levels. The most common weighting type is the A-Weighting. Just like the human ears, this weighting type is less sensitive to low audio frequencies and it can reflect human response more accurately than other weightings and SPL. The A-weighted measurement of Leq is shown as LAeq, and the measurement unit for both SPL and LAeq is shown as dB(A).
Occupational Health and Safety regulations of OSHA (Occupational Safety and Health Administration of United States) limits exposure to 90 dBA for all workers for an 8 hours a day. As it can be seen, this limit is mostly concerned with workplaces involving hard labour, where sound levels can become very high. Sound levels in a typical office is between 50 to 60 dB(A).
18 2.2.1.2.2. Reverberation Time
Reverberation time (RT 60) is the time required for sound to decay 60 dB from its initial sound level (Egan, 1988). It is introduced by Wallace Clement Sabine at 1895. Sabine’s goal was to improve the listening conditions in lecture halls. The method Sabine introduced correlates the total volume of the room with the total sound absorption coefficients of materials within the room. The following formula is known as the Sabine Formula, which is used to measure the reverberation time of any given space.
T60 = 0.161 x v/a
In this formula:
T60: is the time required for 60 dB decay of sound;
v: is the total velocity of the room;
a: is the total amount of absorption of room
However, Sabine’s formula ignores air absorption which can be significant for large halls. Rossing (1990) proposed a modification to this formula to include air
absorption. Air absorption is greater at higher frequencies and also depends on the humidity of space. Formula modified by Rossing can be seen below, with mV representing the air absorption coefficient (Appendix Table A 1).
19
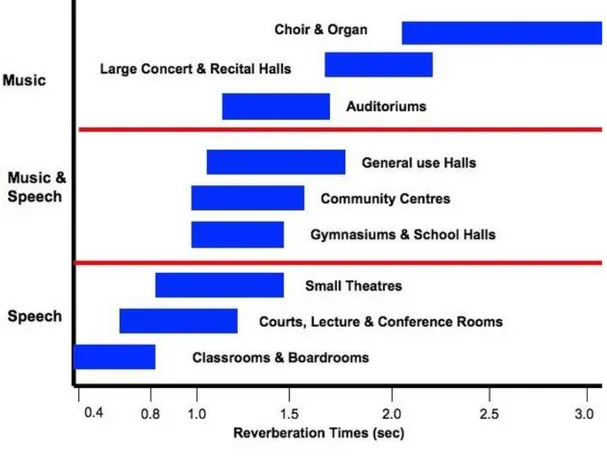
There are also other formulas to measure reverberation time, such as the Eyring Formula. However, these methods of measuring reverberation time are only used for special conditions such as, for recording studios or anechoic chambers, which have very high amount of absorption (Egan, 1988). Reverberation requirements of a room depends on the activity (Figure 2). Larger rooms require higher reverberation time while smaller rooms require lower (Egan, 1988).
Figure 1: Required reverberation time ranges for different types of rooms (“Reducing a rooms,” n.d.).
20 2.2.1.2.3. Speech Transmission Index (STI)
Speech transmission index is the measurement unit of quality of speech
intelligibility (Egan, 1988). It ranges between the scale of 0 to 1, with “1” referring to excellent intelligibility and “0” referring to bad intelligibility (Figure 3). There is also another scale proposed by Barret (1995) known as Common Intelligibility Index (CIS).
Figure 2: Speech Intelligibility scale (Acousticator, 2012).
2.2.2. Subjective Survey Methods
Various approaches are used to capture individual’s subjective response to the soundscape. Some of these approaches are; sound preference tests, semantic differential scales and noise annoyance surveys. As the name suggests, sound preference test is concerned with the sounds preferred or unwanted by individuals. Sound preference can vary depending on age and gender.
Sound annoyance is the negative evaluation of environmental conditions due to their association with disturbance, aggravation, dissatisfaction, concern, bother, displeasure, harassment, irritation, nuisance, vexation, exasperation, discomfort, uneasiness, distress, negative evaluation of sound source and high sound levels
21
(Koelega, 1987; Guski et al., 1998). As the sound annoyance changes from person to person there isn’t any method specific survey method other than noise annoyance questioners or interviews.
Semantic differentials is a rating scale that consists of adjective pairs. Subjects are asked to choose between one of the adjectives from each pair. In acoustics, subjects are expected to judge the sound by means of adjective pairs such as quiet or loud, pleasant or unpleasant. These pairs of adjectives are decided according to findings of pilot studies and soundscape literature (Ozcevik & Yuksel, 2012). The findings of semantic differential test and questionnaires are analysed by using statistical analysis software to find out about statistical reliability of opinions, attitudes and values.
Sound walk method is one of the most iconic method to evaluate a soundscape. Like most of the concepts regarding soundscape, it is introduced by Schafer. This method is used, in order to judge sound based on its components and perceptibility. It is a procedure of focused listening, in which the participants move through the environment with complete attention to their sonic environment. Participants can be guided with written or oral instruction and they may also be walking with a blindfold, stand still or move in response to the sound field (Basco, 2011). There are different adaptations of soundwalk method, but at this point none of them are suitable to be used indoors.
22
This thesis uses “Grounded Theory” as the main subjective survey method. Grounded Theory provides a broad scope and flexibility to conduct a research, which can explore some of the most common subjective survey methods above such as noise annoyance and sound preference. The following section will provide detailed information about the aspects of grounded theory.
2.2.2.1. Grounded Theory
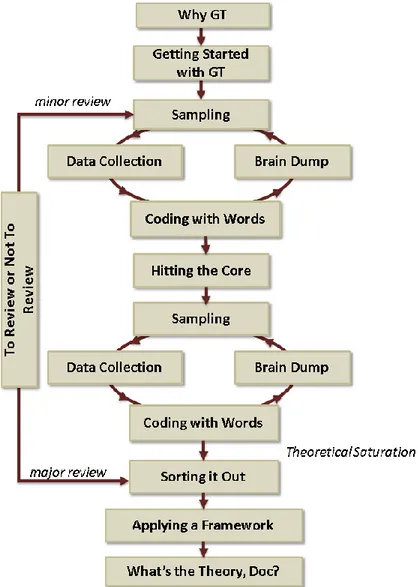
Grounded Theory is a qualitative research method that aims to generate or discover a theory (Corbin & Strauss, 1998; Dey, 1999). It is introduced by Barney Glaser and Anselm Strauss in 1967 and they briefly describe it as “The discovery of theory from data”. In fact the name “Grounded Theory”, comes from the fact that theory is derived as the research advances, in a way the theory is grounded to the data (Corbin & Strauss, 1998).
Grounded theory uses interviews, documents, and observations, as means to collect data. Data analysis is systematic and begins as soon as the data becomes available. Data analysis consist of identifying categories, defining patterns and connecting them to derive concepts (Figure 4). The data collecting stops when data no longer
23
produces any significant categories, which is called the “Theoretical Saturation Point” (Corbin & Strauss, 1998; Dey, 1999; Jones & Alony, 2011).
Glaser and Strauss described the analysis of data as “constant comparative”
method. Coding is the major tool of analysis which has three stages. First one is the “Open Coding”, where the data is broken down in to pieces to generate categories.
Figure 3: Flow chart showing the process of grounded theory (Hoda et al. 2011).
24
In “Axial Coding”, researcher looks for patterns between these pieces and put them together. This stage of coding can be described as building a puzzle, researcher has to compare categories constantly with each other to understand where a certain piece goes. At the end of this phase categories grouped together to from themes. Last stage of coding is the “Selective Coding”. In these phase a core theme/category is selected and searched for relations with other themes. Theory is generated after this phase. Strauss and Corbin define it as:
“…the process of selecting the core category, systematically relating it to other categories, validating the relationships, and filling in categories that need further refinement and development (Strauss & Corbin, 1990:116).
Grounded theory is one of the most popular research methods among social science studies. It works quite opposite than the traditional social science research methods. Instead of finding an existing framework and applying tests to figure out whether this framework applies to the phenomenon, researcher begins the study with a question, with almost no prior knowledge about the phenomenon (Corbin & Strauss, 1998; Dey, 1999). It is concerned with generating a theory rather than testing one. Popularity of grounded theory comes from its strong and successful institutional support, its flexibility and its ability to zero in to a specific subject with almost no requirement of prior knowledge (Hoda et al. 2011).
25
2.3. Open Offices Spaces
Open-plan offices are one of the most popular workspace layouts. They are believed to promote communication and interaction between employees along with the advantages of, increased net usable area, higher occupant density and ease of reconfiguration ( Hongisto et al., 2004; Kim and de Dear, 2013).
However there is no empirical evidence showing that open plan layout will increase task performance (Kim and de Dear, 2013). In fact they are associated with lack of speech privacy and uncontrolled sounds levels which can cause significant decrease in task performance and workplace satisfaction (Jahncke et al., 2013; Kim and de Dear, 2013).
2.3.1. Acoustical Factors
The most common type of sound within an office is speech. An appropriate room acoustic design for an open planed office requires that the distraction by speech is sufficiently controlled (Haapakangas et al., 2011). In order to provide this, several factors are needed to be considered. These factors can be listed as; absorbers on ceiling, walls and furniture, high screens and storage units, distance between workstations, enclosure of workstations and the use of artificial masking sound
26
(Bradley, 2003; Virjonen et al. 2009). All of these factors are associated with reduction of sound levels. However, “artificial masking sound” is about providing negative speech-to-noise ratio, which is the difference of levels of speech and background noise (Haapakangas et al., 2011). Negative speech-to-noise ratio corresponds to a less intelligible speech.
Overall noise levels are not always the most important issue regarding the sound quality of an open office (Jahncke et al. 2013). Intelligibility of background speech is also an important factor (Hongisto, 2005; Kitapcı, 2008; Haapakangas et al., 2011; Jahncke et al. 2013). Background speech can cause interference-by-process account of auditory distraction; this type of distraction is caused by a conflict that emerges between similar, competing processes (Jahncke et al. 2013). Involuntary processing of speech causes distractions on tasks that require similar process. Previous studies have shown that if a task involves processing of semantic information, it becomes more vulnerable to speech sounds (Jahncke et al. 2013).
A prediction model proposed by Hongisto (2005) showes the amount of
performance loss with relation to the STI. According to the schematic prediction model, STI values higher than 0.6 can decrease the task performance by 7% (Figure 5). However, between the STI ranges of 0.60 to 0.20 negative effect on task
27
performance significantly reduces. After 0.20, intelligibility of the speech comes down to a point where it hardly effects work performance.
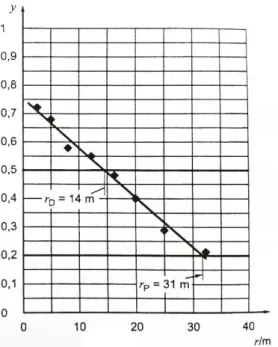
ISO 3382-3 Measurement of Room Acoustic Parameters – Part 3 Open Plan Offices, provides two significant STI parameters for open plan offices; radius of distraction (𝑟𝐷) and radius of privacy (𝑟𝑝). Radius of distraction is the distance from the sound
source where STI value drops below 0.50. Below this value, concentration and privacy conditions starts to increase rapidly. Similarly, radius of privacy is the distance from the speaker where STI drops below 0.20. An example showing the determination of radius of distraction and radius of privacy can be seen at figure 6.
At this point, intelligibility of speech is approximately equal to that of a single office room. There are obvious similarities between the values of ISO standard and the
Figure 4: The prediction schematic introduced by Hongisto (2005), showing the relation between STI and DP (Decrease in Performance)
28
study carried out by Hongisto, as his research contributed the preparation of this standard greatly.
Research done by Kim and de Dear (2013) showed that noise levels and speech privacy, are among the major problems of open planned offices, along with visual privacy. Same study also showed that exposure to noise and lack of speech privacy does not only cause performance loss but it also decreases the workplace
satisfaction significantly and sound interference causes increased distraction among open plan office employees.
As the speech is the most annoying sound source within an office, speech privacy between work stations should be as high as possible. Research conducted by Hongisto et al. (2004) aimed to present a simple and validated model that can
Figure 5: Determination of radius of privacy (𝑟𝑝), and radius of distraction (𝑟𝐷).
In the above graph, y represents the STI value and r represents the distance from the source (ISO, 2012).
29
predict the STI between two workstations. Their model uses signal-to-noise ratio to determine speech intelligibility by providing STI and rapid speech transmission index (RASTI).
2.3.2. Psychological Factors
Mood, affect and emotions considered to be among the fundamental issues in human psychology. However, it is hard to distinguish them from each other as they all belong to the same psychological background, which is referred to as the
“Affective Phenomenon” or “Affective Science” (Ekkekakis, 2013).
The term affect refers to a fundamental feeling state in human mind. According to Wundt (1997) people are “never in a state entirely free from feeling’’. On the other hand, researchers argue whether a state of feeling can be achieved consciously or not (Schnall, 2010). The one aspect of affect, which everybody mostly agrees upon is that, affect comprises both emotion and mood. So it can be said that affect is a main element which also includes emotions and moods within itself, therefore, affect can refer to subjective responses of moods or emotions.
Affect has three qualities which are; pleasantness/unpleasantness, called the valence, arousing/subduing, called the arousal, and strain/relaxation called the intensity (Barret & Bliss-Moreau, 2009; Schnall, 2010). These three qualities are the
30
indicators of a unified state. In order to describe an individual’s momentary mental state valence (pleasant or unpleasant) and arousal (arousing or subduing) are used, which provides the basic psychological primitive, common for all psychological states. This psychological primitive is called the Core Affect. Core affect can be a component of emotions and moods or, it can also occur in pure, or isolate form (Ekkekakis, 2013).
Emotions can be defined as a complex set of interrelated sub-events concerned with a specific object (Russel & Barret, 1999). Emotions are either elicited by something, reactions to something or generally about something, therefore the transaction between the individual and object is defined by the cognitive appraisal (Ekkekakis, 2013).
Mood, on the other hand, is an affective state, that lasts longer than emotions (Schnall, 2010; Ekkekakis, 2013). A mood can be about everything or about nothing specific (Ekkekakis, 2013). For example a person is in an anxious mood, this can be about the business meeting he will attend later that day or can be anxious about the future and when a person is in an irritable mood, object of this can be anything and anyone (Ekkekakis, 2013).
There are several ways to measure mood. One of the most frequent one, and the one chosen for this research, is Positive and Negative Affect Schedule (PANAS). This
31
test measures the two primary dimensions of mood, positive and negative affect. As it was mentioned above affect consists of three qualities. In PANAS test, positive affect reflects the extent in which an individual feel pleasant, active and alert. So it can be said that positive affect indicates pleasurable engagement. On the other hand, negative affect reflects the extent in which a person feels unpleasant and distress, which indicates unpleasurable engagement.
While there aren’t any case studies that explores the relation between employees’ mood and sonic environment, there are important studies that associate task performance and mood. Isen et al. (1987) found that positive affect increases problem solving by influencing the way material is processed, combine them and see relations between stimuli. Research conducted by Martin and Kerns (2011), suggests that positive mood can increase the visual scope of attention and has effects on cognitive control and impairing working memory.
There is also evidence, suggesting that the colour of a workspace effects mood. Kwallek et al. (1996) colour scheme of an office space alone may have an impact on employees’ mood
32
CHAPTER 3
INVESTIGATING THE EFFECT OF INDOOR SOUNDSCAPING TOWARDS
EMPLOYEES’ MOOD AND PERCEPTION IN OPEN PLAN OFFICES
3.1. Design of the Study
This study aims to conceptualize the lived in experience of an open office space to explore the factors that contributes to employees’ perception of the soundscape of their work environments. Research is conducted at two medium sized companies. Means of objective and subjective survey are used together. Objective parameters consists of, the in-situ sound level measurements (LAeq) within working hours and calculation of reverberation time (RT 30) and Speech Transmission Index (STI). Grounded Theory is adopted as the main research method of this thesis. Semi-structured interviews are conducted with employees to derive themes and create a conceptual framework that shows factors contrubuting to the perception of indoor soundscape. Descriptive statistic, mainly frequency tables, are used to show various results derived from the interview transcriptions. Şastşy, Positive and Negative Affect Schedule (PANAS) test is used evaluate employees’ mood.
33
3.1.1. Research Question
Grounded theory suggests starting the research with a very brief question, in order to not limiting the scope of the study (Corbin & Strauss, 1998; Dey, 1999; Jones & Alony, 2011). As grounded theory is not about testing a hypothesis but creating a theory, doing so will provide a broader perspective towards understanding the phenomenon. Therefore, this research has one research questions that involves multiple aspects of the phenomenon.
Does indoor soundscape quality effect employees’ mood, and perception of their office environment?
3.1.2. Hypothesis
The hypothesis of this study is; the indoor soundscape effects employees’, mood, and perception of their work environment.
3.2. Methodology
3.2.1. Case Study Settings
Semi-structured interviews and in-situ measurements are conducted within the open office spaces of two different companies.
34
3.2.1.1. Öncüoğlu + ACP Architects
First company is Öncüoğlu + ACP Architects. Even though it is in a very central location in Ankara / Turkey, it is located within a quiet and secluded residential block. Company owns the basement, ground floor and the first floor of a residential block. Open office space is within the ground floor, along with the more traditional office of the accounting department. Rest of the floors are used for services and management. The company has more than thirty employee, but only around 25 works within the open office space.
The main office area is a 215 m2 space (Appendix Figure A 1). This scape consists of
the open office space at one side and the private offices of more senior employees on the other side. Main office has two different ceiling levels. Majority of the open office space has ceiling height of 5.79 meters while other part has ceiling height of 2.40. Higher part of the ceiling is covered with, Metapan Multipanel, linear ceiling panels with acoustical properties. This material covers total of 105 m2 of ceiling
area, other part is covered with plaster. Floor material is vinyl throughout the office space and wall material is plaster on paint. Northern wall also has windows with dimension of 3.59m x 1.1m, covering 19.8 m2 of wall in total (Figure 7). The
partitions between employees desk consist of fabric, which is not only used for acoustical purposes but also used by employees to attach all kinds of documents.
35
3.2.1.2. Promer Engineering Consultancy
Second company is Promer Engineering Consultancy. Their office is a four storey building, located in the residential district of Ümitköy/Ankara. Company uses two floors as office space while using the rest for management and services. The spaces used as office has identical plans. The company has, around fifty employee, majority of them working in open office spaces.
The open office space is 135 m2 per floor (Appendix Figure A 2). Similar to the
former company, there are also private offices for in each floor but they are not included in the given measurement of area as they are not really located within the open office area but in a corridor leading to it. The open office space is divided into Figure 6: Open office space of Öncüoğlu + ACP Architects.
36
two parts; a main space with around fifteen employee and a subspace with six employee. Materials of the office space are; epoxy for floor material of whole building and, paint on plater for walls and ceiling. Ceiling high is same across all office, which is 2.60 meters. There aren’t any sound absorbing material except for the blackouts of windows. Even the partitions between desks are acrylic.
Figure 7: Main office space of Promer Engineering Consultancy.
In order to make it more clear, Öncüoğlu + ACP Architects will be referred to as Office ARCH, as in architecture and Promer Engineering Consultancy will be referred as Office ENG.
37
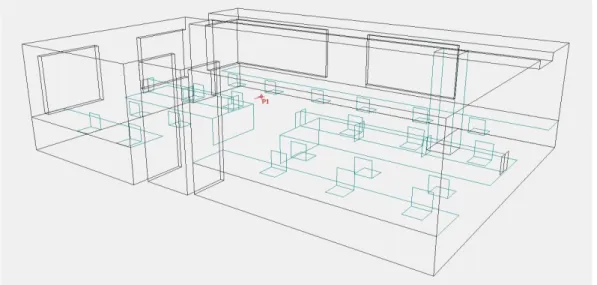
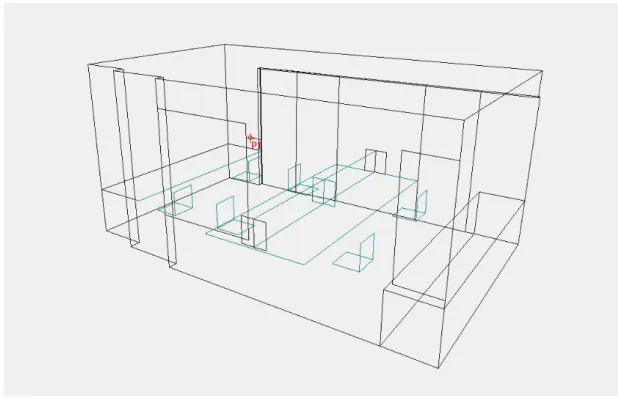
3.2.2. Objective Measurements
In order to analyse the acoustical characteristics of the office spaces, a combination of in-situ measurements and Odeon Room Acoustics Software 13.01 Combined are used (Figures 9-12). In-situ measurements are conducted for two days, during working hours and while the offices are occupied. Bruel & Kjaer Sound Level Meter type 2230 is used for measurements. Sound level meter is placed at central
locations of both offices at the height of 125cm and measured over 15 minute time intervals. In Office ARCH some workstations were no longer used by the employees’ during the time of measurements, thus in-situ measurements are conducted on the occupied part of the office. As for Office ENG, in-situ measurements are conducted at both floors. Sound Level meters is placed at a central location in main office space and later a location between the subspace and the printer room. This is intended as to capture the sound coming from both the main office space, subspace and printer room.
3D models of both offices are prepared at SketchUp 14 and imported to Odeon Room Acoustics Software 13.01 Combined, which provided the Speech
Transmission Index (STI) and Reverberation time (RT 30). Due to the plan of Office ENG, two separate models are prepared, one for the main space and other for the subspace. This decision is made to acquire more accurate data from simulation.
38
Results are later compared with employees’ answers to the semi-structured interview.
Figure 8: Main office space of Promer Engineering Consultancy.
Figure 9: ODEON 3D elevation of Main office space (Office ENG1) of Promer Engineering Consultancy (Office ENG).
39
Figure 11: ODEON 3D perspective of Öncüoğlu + ACP Architects (Office E). Figure 10: ODEON 3D elevation of subspace (Office E2) of Promer Engineering Consultancy (Office E).
40
3.2.3. Subjective Measurements
Grounded Theory is used as the main means of subjective survey. Semi structured interviews are conducted with 47 employees, 23 from Office ARCH and 24 from Office ENG. Interview process started with 7 core questions (Appendix Figure B 4), which are prepared based on previous studies, mainly to “Positive Soundscape Project”, conducted by Davies et al. (2013). However, the questionnaire needed adjustments as this is study is concerned with indoor spaces.
These questions are meant to be very generic and aims to direct the interview towards employees’ issues, habits and observations. As the interviews advance, new questions are added to the interview according to employees’ responses. For Figure 12: ODEON 3D perspective of Main office space (Office ENG1) of Promer Engineering Consultancy (Office ENG).
41
example, after first couple of interviews, all employees’ stated that they are wearing earphones. From that point on, questions about earphone usage have become part of the core questions.
Interviews are concluded once the collected data no longer produced significant conceptual variations (Corbin & Strauss, 1998; Dey, 1999). Interview process lasted for 2 work days for both offices while they are fully occupied. Interviews are held at meeting rooms and their duration varied between 6-17 minutes. All interviews are recorded and transcribed. Transcriptions are manually coded to derive themes and categories, which are used to create a conceptual framework that reflects
employees’ perception of the soundscape of their work environment and the factors that are affecting it.
3.2.4. PANAS (Positive and Negative Affect Schedule)
As it was stated previously, PANAS test is used to measure employees’ mood. This test consists of twenty emotions, half of them are associated with positive affect while or half is associated with negative. These emotions are placed in random order to avoid participants from recognising the positive or negative aspect of the emotion. Participants are required to rate each emotion from a 5 point Likert scale, 5 representing very much and 1 representing very slightly (Appendix Figure B 1).
42
After each interview, employees’ are given PANAS form to fill. PANAS questionnaire includes both English and Turkish versions of each emotion.
In order to evaluate the PANAS forms, each set of emotions (Positive and Negative) are calculated separately. Calculation of these two set of emotions provide two scores; the Positive Affect Score and the Negative Affect Score. Both scores are range from 10 - 50. Higher score of positive affect represent higher levels of positive affect, while higher scores of negative affect represent lower levels of negative affect. Responses gathered from the PANAS test are used to explore relations between employees’ mood, satisfaction with the overall sound levels and objective parameters of their office environment.
43
CHAPTER 4
RESULTS
This chapter will present the findings of objective parameters and subjective surveys. From this point on, abbreviations will be used instead of the full names of companies to make it straight forward. As Öncüoğlu + ACP Architects is an
architecture company it will be referred to as Office ARCH. Similarly, as the Promer Engineering Consultancy is concerned with engineering its abbreviation will be Office ENG.
4.1. Objective Results
4.1.1. Equivalently Continuous A-Weighting Sound Levels (LAeq) and Reverberation Time (T 30)
There is a slight difference between offices in terms of Equivalently Continuous A Weighted Sound Levels (LAeq). Measurements showed that Office ARCH has 55,3 dB(A) mean LAeq, while Office ENG has 59,4 dB(A). Difference between the
44
measurements are not surprising, due to the fact, in Office ENG, there are more people working in a smaller office space when compared to Office ARCH.
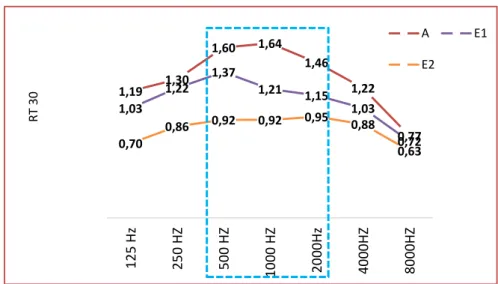
Reverberation time (RT 30) is simulated for all frequencies with the simulation prepared by the ODEON Room Acoustics Software 13.01 Combined (Figure 14). However, the literature, and the subjective survey of this thesis shows that speech is the most common sound in open plan office. Therefore, only the common frequencies of speech are considered to be significant, which are 500Hz, 1000 Hz, and 2000Hz. For the simulation, the background noise is considered to be 55 dD (NC 55).
As it was previously mentioned in the section “Case Study Settings”, open office space of Office ENG is composed of a main office space and a subspace. The model that is prepared for Office ENG simulation is also divided into two separate parts to
1,19 1,30 1,60 1,64 1,46 1,22 0,77 1,03 1,22 1,37 1,21 1,15 1,03 0,72 0,70 0,86 0,92 0,92 0,95 0,88 0,63 12 5 H z 25 0 H Z 50 0 H Z 10 00 H Z 20 00Hz 40 00HZ 80 00HZ R T 30 A E1 E2
Figure 13: Reverberation times for all central frequencies. The dashed rectangle indicates the common speech frequencies.
45
get accurate results from the simulation. In order to make it easier to address these spaces, the main space will be referred to as Office ENG1, and subspace will be referred to as Office ENG2.
It can be seen from the Figure 14, that reverberation time, between the frequencies of 500Hz to 2000Hz, for Office ENG1 varies between 1, 37 to 1,15 and for Office ENG2 it is between 0,92 to 0,95. For Company ARCH, reverberation time between 500HZ to 2000HZ varies between minimum 1.43 and maximum 1.61, which is a more appropriate reverberation time for an auditorium (Figure 2). The more detailed distribution graphs can be seen between Appendix Figure A3 to Appendix Figure A8.
4.1.2. Speech Transmission Index (STI)
Simulation prepared at Odeon Room Acoustics Software provided the distribution of STI values for both offices (Figure 15&16) (Appendix Figure A9 to Appendix Figure A11). According to the distribution graph, mean STI value is around 0.52 which stands for Fair amount of STI (Figure 3). The mean STI value of Office ENG1 is 0.56 which is quite similar with Office ARCH, Office ENG2 has slightly higher mean value of 0.63, which means Good intelligibility of speech (Figure 3).
46
Figure 14: STI Grid response of open plan office of Öncüoğlu + ACP Architects (Office ARCH). Black mark indicates the location of the sound source.
Figure 15: STI grid response of open plan office of Promer Engineering Consultancy (Office ENG). The plan on the right belongs to the main office space (Office ENG1) and the left one belongs to the subspace of office (Office ENG2). Black marks indicate the location of sound sources.
47
These results show that both of the offices have STI ratings, which are slightly higher than those suggested by the literature and ISO standard (ISO, 2012). To avoid a decrease in task performance due to speech, the STI value should have been higher than 0.50 and to provide sufficient amount of speech privacy it should be higher than 0.20. In order to see if the objective parameters of ODEON simulation apply to the actual perception, employees’ responses to the interview will be taken in account in following chapter, “Discussion”.
4.1. Subjective Results
Analysis of the semi-structured interviews began with transcribing all recordings. Once all recordings are transcribed, coding procedure started with open coding. This process can be described as breaking down interview transcriptions into pieces by labelling each significant event (Figure 17). In order to do this properly,
researcher has to be familiar with the data. To ensure this, all interviews, transcriptions and coding is done by the author, and portion of the open coding documents are checked by a professor from faculty.
As it can be seen at Figure 17, employees’ responses are broken down to pieces by labelling each significant event. For the second phase, the axial coding, these labels are searched for relationship patterns, and put together in accordance with their
48
relation. For example, sound of keyboard is labelled as “SS (MECH1)” and the sound of employees engaging in a group conversation is labelled as “SS (HMN)”. After this point, keyboard, becomes a sub category of “SS (MECH1)”, which has now also becomes a main category, and group conversation becomes a sub category of “SS (HMN)”. Now that we have two main categories author looks for relation between them. As both of them are sound sources, together they create a theme, called “Sound Sources”. Using the constant the comparative method, all labels that show any patterns with one another are used to form themes. Labels which do not have any relation with others are eliminated during this process.
Figure 16: A sample taken from the transcriptions, which shows how data is broken down into labels during open coding. Abbreviations: CM= Coping Method, LSL= Low Sound Levels, EWP= Effecting Work Performance, SS(HMN)= Sound Source Human SS(MECH)= Sound Source Mechanical & Electronical
49
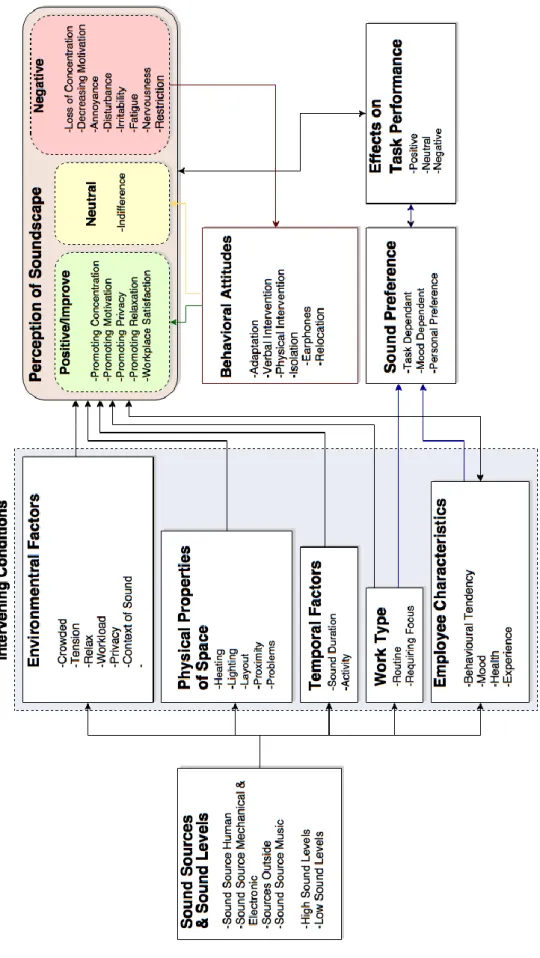
Last phase of coding is Selective Coding. As the axial coding has put the data back together and provided us with themes, the main theme had to be identified and find how other themes relate to one another, and to the main theme. As the main goal of this research is to explore employees’ perception, main theme is selected as Perception of Soundscape, which is also pointed out by the data. Based on these patterns conceptual model is created, which is used to understand employees’ perception of his workspace.
Study aimed to compare two open offices spaces and construct a conceptual model for each one of them as they were expected to be different from each other.
However, analyses of the data showed identical patterns and categories for both of the offices. Therefore one conceptual model is generated for both cases (Figure 18). This analysis of data revealed 10 themes which are divided into 29 categories
(Appendix Table B 2).
Conceptual framework showed some similarities between the one prepared by Mackrill et al. (2013), which is a soundscape research conducted in a hospital ward. Similar to this research, there are some intervening conditions that acts like a filter and directly effects employees’ perception of their work environment. These intervening conditions consist of 5 themes; Environmental Factors, Temporal Factors, Employee Characteristics, Work Type and, Physical Properties of Space. Categories of these can be seen at Figure 18. When the sound source, of a certain
50
Figure 17: Conceptual Framework prepared by the author, which shows the categories, main themes and the patterns between them