EFFECTS OF SPEECH INTELLIGIBILITY ON
COMPUTER-BASED TASK PERFORMANCE IN
OPEN-PLAN OFFICES
A THESIS
SUBMITTED TO THE DEPARTMENT OF
INTERIOR ARCHITECTURE AND
ENVIRONMENTAL DESIGN AND THE INSTITUTE
OF ECONOMICS AND SOCIAL SCIENCES
OF BİLKENT UNIVERSITY
IN PARTIAL FULFILLMENT OF THE
REQUIRMENTS
FOR THE DEGREE OF
MASTER OF FINE ARTS
By
Kıvanç Kitapcı
May, 2008
I certify that I have read this thesis and that in my opinion it is fully adequate, in scope and in quality, as a thesis for the degree of Master of Fine Arts.
______________________________________________ Assist. Prof. Dr. Semiha Yılmazer (Advisor)
I certify that I have read this thesis and that in my opinion it is fully adequate, in scope and in quality, as a thesis for the degree of Master of Fine Arts.
______________________________________________ Prof. Dr. Mehmet Çalışkan
I certify that I have read this thesis and that in my opinion it is fully adequate, in scope and in quality, as a thesis for the degree of Master of Fine Arts.
______________________________________________ Assoc. Prof. Dr. Cengiz Yener
Approved by the Institute of Fine Arts
____________________________________________________________________ Prof. Dr. Bülent Özgüç, Director of the Institute of Fine Arts
ABSTRACT
EFFECTS OF SPEECH INTELLIGIBILITY ON
COMPUTER-BASED TASK PERFORMANCE IN OPEN-PLAN OFFICES
Kıvanç Kitapcı
M.F.A. in Interior Architecture and Environmental Design Supervisor: Assist. Prof. Dr. Semiha Yılmazer
May, 2008
The aim of this thesis is to find out the effects of speech and speech intelligibility on computer-based task performance in open-plan offices. The research was conducted in a real open-plan office environment to include the open-office experience of subjects to the analysis. STM Bilkent Office was selected as the case, and 40 available open-office occupants were participated to the study. The experiment consists of three main phases. In the first phase, real-size measurement of selected open-office area within STM Bilkent was analyzed to understand effects of divider panels on acoustical situation of the room, and to check the reliability of the computer simulation. In the second phase, acoustical simulation of the site was done, to derive distribution graphs for speech related room acoustics parameters. In the last phase, occupants computer-based task performances were tested under three different sound environments, which are continuous noise, speech and masked speech. According to statistical analysis of performance test, and acoustical properties of the case STM, suggestions for renovation were discussed and tested in computer simulation. It was found that, effects of intelligible speech on occupants task performance is only psychological, because it is significant that there is no difference between results of performance test. However, all of the occupants respond to the
questionnaires that speech sound environment was the most distracting one. Proposal for renovation was given to minimize the effects of intelligible speech on occupants for preventing the long-term effects on occupants’ health.
Keywords: Room Acoustics, Open-Plan Office, Task Performance, Speech Intelligibility, Speech Privacy, Acoustical Simulation
ÖZET
KONUŞMA ANLAŞILABİLİRLİĞİNİN AÇIK OFİSLERDE
BİLGİSAYAR TABANLI İŞ VERİMİNE ETKİSİ
Kıvanç Kitapcı
İç Mimarlık ve Çevre Tasarımı Bölümü, Yüksek Lisans Tex Yöneticisi: Yrd. Doç. Dr. Semiha Yılmazer
Mayıs, 2008
Bu çalışmanın amacı, anlaşılabilir konuşmanın açık ofis çalışanlarının bilgisayar tabanlı iş verimi üzerindeki etkilerini incelemektir. Araştırma, çalışanların açık ofise alışkanlık etkisinide göz önüne almak amacı ile gerçek bir ofis ortamında gerçekleştirilmiştir. STM Bilkent ofisinde gerçekleştirilen çalışmaya, bu ofisi kullanan 40 kişilik bir grup
katılmıştır. Araştırma üç ana aşamadan oluşmaktadır. İlk aşamada STM Bilkent binasından seçilen açık ofis alanının yerinde akustik ölçmleri, bölücü panoların ofis alanının akustik özellikleri üzerindeki etkisini anlamak ve akustik benzetimin
güvenilirliğini sağlamak amacıyla gerçekleştirilmiştir. İkinci aşamada, mekanın akustik benzetimi, konuşma ile ilgili oda akustiği değerlerinin dağılım grafiklerini elde etmek için yapılmıştır. Üçüncü aşamada katılımcılara konuşma, maskelenmiş konuşma ve sabit gürültü olmak üzere üç farklı ses ortamı altında bilgisayar tabanlı çalışma verimi testi uygulanmıştır. Test sonuçlarının istatistiksel çözümlemesi ve akustik ölçümlerden alınan sonuçların ışığı altında, STM açık ofis alanı için çözüm önerileri sunulmuştur. Verim testinin sonuçlarına gore, konuşmanın açık ofis çalışanları üzerindeki etkisi sadece psikolojiktir. Fakat, test sonrasında verilen anketlere gore, katılımcılar en çok rahatsız oldukları ses ortamını konuşma olarak belirtmişlerdir. İç mekandaki değişiklik önerileri, stresin çalışanlar üzerinde yaratabileceği uzun vadeli etkileri düşünülerek sunulmuştur.
Anahtar Sözcükler: Oda Akustiği, İş Performansı, Konuşma Anlaşılabilirliği, Konuşma Gizliliği, Akustik Benzetim
ACKNOWLEDGEMENTS
First and foremost, I would like to express deepest gratitude to my supervisor Assist. Prof. Dr. Semiha Yılmazer, for her guidance, encouragement and patience. I also express sincere appreciation to Prof. Dr. Mehmet Çalışkan, for his technical support help and tutorship. I also express appreciation to Assoc. Prof. Dr. Feyzan Erkip and Assoc. Prof. Dr. Halime Demirkan for their helpful suggestions and guidience.
I would also like to thank to Prof. Dr. Fatin Sezgin for his suggestions througout the statistical analysis of the thesis. In addition, I would like to thank Assoc. Prof. Cengiz Yener for his invaluable guidence and encouradgement.
I would like to thank my friends Fatih Karakaya, Elif Helvacıoğlu, Güliz Muğan, İpek Sancaktar and İnci Cantimur for their moral support. I also owe special thanks to my roommate Segah Sak for her help friendship, help and patience.
Lastly, but not least, my greatest indebtedness is to my family to whom I owe what I have –Yavuz Kitapcı, Tülin Kitapcı, Başak Kitapcı Kaman and Cem Kaman- for their trust and support in every aspect of my life.
TABLE OF CONTENTS
ABSTRACT………...…………..iii ÖZET………..……….iv ACKNOWLEDGEMENTS……….v TABLE OF CONTENTS………....vi LIST OF FIGURES………...………..ix LIST OF TABLES………...……...………xi 1. INTRODUCTION 11.1. Aim and Scope……….………....5
1.2. Structure of the Thesis……….………....6
2. SPEECH PRIVACY REQUIREMENTS IN OPEN-PLAN OFFICES 8
2.1. Spatial Requirements……….………..9 2.1.1. Partitions……….10 2.1.2. Materials……….12 2.2. Acoustical Requirements……….. .13 2.2.1. Reverberation Time………14 2.2.2. Clarity (C80)………...16 2.2.3. Definition (D50)………..16
2.2.4. Speech Transmission Index (STI)………...…17
3. EXPERIMENTAL STUDY 20
3.1. Aim of the Study………...……….20
3.1.1. Research Questions………...………..…...20
3.1.2. Hypothesis………...………...21
3.2. Methodology………...21
3.2.1. Real-Size Measurements of the Site………...22
3.2.2. Acoustical Simulation of the Site………...25
3.2.3. Computer-Based Task Performance Test………...29
3.2.3.1. Sound Environments………...……….30 3.2.3.2. Software………..32 3.3. Case Study………...………...33 3.3.1. Site Description………...…………...…….33 3.3.1.1. Layout………..34 3.3.1.2. Sample Group………...…...35
3.3.2. Results of the Real-Size Measurements………...……..…36
3.3.2.1. Reverberation Time (T30)………...36
3.3.2.2. Clarity (C80) and Definition (D50)……….40
3.3.2.3. Speech Transmission Index (STI)………..………..43
3.3.3. Results of the Acoustical Simulation………...………...43
3.3.3.1. Reverberation Time (T30)………...…44
3.3.3.2. Clarity (C80)………...………….47
3.3.3.3. Definition (D50)………...………49
3.3.4. Results of the Computer-Based Task Performance Test…………....53
3.3.4.1. Results of the Objective Evaluation………...…..53
3.3.4.2. Results of the Subjective Evaluation………...……54
3.4. Analysis of the Results………...……….55
4. PROPOSAL FOR RENOVATION 61
4.1. Suggestions………61
4.2. Simulation of the Renovated Office………...………...66
5. CONCLUSION 74
REFERENCES 78
LIST OF TABLES
Table 3.1. Reverberation Times for Measurement Position 1...38
Table 3.2. Reverberation Times for Measurement Position 2...38
Table 3.3. Clarity (C80) and Definition (D50) Values for Measurement Position 1...41
Table 3.4. Clarity (C80) and Definition (D50) Values for Measurement Position 2 ...41
Table 3.5. Comparison of means for the difference between performances...54
Table 3.6. ANOVA for the difference between performances...54
Table 3.7. Comparison of means for the subjective evaluation...55
LIST OF FIGURES
Figure 3.1. Bruel & Kjaer OmniPower Sound Source Type 4292 ...23
Figure 3.2. Bruel & Kjaer 2716 Power Amplifier...23
Figure 3.3. Bruel & Kjaer 2230 sound Level Meter ...24
Figure 3.4. Source and Receiver Positions for Real-Size Measurements ...25
Figure 3.5. 3D Model of the office in AutoCAD 2007...27
Figure 3.6. Absorption coefficients of materials assigned to the computer model in Odeon 8.5...28
Figure 3.7. Screenshot from Audacity 1.2.6 Software ...31
Figure 3.8. Screenshot from Audacity 1.2.6 Software ...32
Figure 3.9. Location of the selected open-plan office at the ground floor ...35
Figure 3.10. T30 Values for Measurement Position 1 ...39
Figure 3.11. T30 Values for Measurement Position 2...39
Figure 3.12. Clarity (C80) Values for Measurement Position 1 ...42
Figure 3.13. Clarity (C80) Values for Measurement Position 2 ...42
Figure 3.14. STI Values ...43
Figure 3.15. Quick Estimate Values for Reverberation Time ...44
Figure 3.16. T30 values at 500 Hz ...45
Figure 3.17. T30 values at 1000 Hz ...45
Figure 3.18. T30 values at 2000 Hz ...46
Figure 3.19. T30 average Values.. ...46
Figure 3.21. C80 values at 1000 Hz...48
Figure 3.22. C80 values at 2000 Hz...48
Figure 3.23. C80 Average Values ...49
Figure 3.24 D50 Values at 500 Hz ...50
Figure 3.25. D50 Values at 1000 Hz ...50
Figure 3.26. D50 Values at 2000 Hz ...51
Figure 3.27. D50 Average Values ...51
Figure 3.28. STI distribution map...52
Figure 4.1. Circulation axis of material change on floor and ceiling...68
Figure 4.2. Renovation of divider panels...69
Figure 4.3. New location of photocopy and fax unit. ...70
Figure 4.4. T30 distribution graph of renovated office at 500 Hz...72
Figure 4.5. T30 distribution graph of renovated office at 1000 Hz...73
Figure 4.6. T30 distribution graph of renovated office at 2000 Hz. ...73
Figure 4.7. C80 distribution graph of renovated office at 500 Hz. ...74
Figure 4.8. C80 distribution graph of renovated office at 1000 Hz...75
Figure 4.9. C80 distribution graph of renovated office at 2000 Hz...75
Figure 4.10. D50 distribution graph of renovated office at 500 Hz...76
Figure 4.11. D50 distribution graph of renovated office at 1000 Hz...77
Figure 4.12. D50 distribution graph of renovated office at 1000 Hz...77
1. INTRODUCTION
Today, open-plan offices are the most popular office type, mostly because of
organizational and economic reasons. An early explanation of open-plan offices was given by Oldham and Brass as, “…it is generally characterized by the absence of interior walls and rooms, which, in conventional ‘multi-cellular’ offices, define private work spaces” (1979, p. 267). Brennan, Chugh and Kline (2002) list different types of office designs, private offices to open offices. They also divide design complexity as the ‘bull pen’ in that the desks are arranged in neat rows to ‘landscaped’ offices, which include systems furniture and dividers. Open-plan offices generally consist of workstations, which can be separated by screens or divider panels. They decrease the required area per occupant, leading to economical savings, and changing the layout of the space is easy to carry out. Organizations cover the economic arguments for choosing an open-plan office by emphasizing the other features of open-plan offices, for instance spaciousness,
refreshing and modern architectural design, improved communication and relationships, better flow of information, greater sense of work involvement, and shorter distances to common spaces (Hongisto, 2005).
There are three key elements that affect occupant satisfaction in office environments: thermal comfort, lighting and acoustics (Wang and Bradley, 2002a). According to Venetjoki, Kaarlela-Tuomaala, Keskinen and Hongisto (2006), work performance can decrease because of office noises. Mostly, environmental effects on work performance
caused by poor acoustical conditions, poor speech privacy and difficulties in
concentration caused by unwanted speech, are not taken seriously because the expected economic and organizational benefits are so evident in open-plan offices (Hongisto, 2005).
Coexistence of activities with various noise emission and need for quietness or privacy in the same area can distract plan office occupants in high levels. Dividers in an open-plan office contribute to a good acoustical comfort and improved speech privacy. Also, by using an absorbent ceiling, the noise between two adjacent working places can considerably be reduced. They contribute to obtain a short reverberation time, too (Desarnaulds, 2007).
To measure speech privacy, The Articulation Index (AI) and its replacement the Speech Intelligibility Index (SII) are frequently used. Very low speech intelligibility (SII<0.20 or AI<0.15) causes acceptable speech privacy in open-plan offices (Bradley and Gover, 2004). Hongisto explains the difference between speech intelligibility index and speech transmission index, stating that the “speech intelligibility is a subjective measure that has been traditionally measured in rooms by listening tests. During the test, an educated person is talking and listeners write down what they hear. Speech intelligibility is the average percent of correct answers. It is typically different for syllables, words or sentences. The direct measurement of speech intelligibility is time consuming and expensive. Physical measurement methods are developed to avoid the need of real audience, e.g. Speech Transmission Index, STI” (2005, p. 459). Salter, Powell, Begault
and Alvarado (2003) investigates designers’ point of view to the subject, which those calculation procedures are not widely used among design community. Underlying
reasons are given like unfamiliar measurement units and concepts, the specialized testing equipment required for prototype and in stu evaluations, etc.
One way of achieving speech privacy in open-plan office environments is explained by Mohammad, Hassanain and Harkness, so that the “Speech privacy may be readily achieved in private offices. Speech privacy in open-planned offices requires the introduction of carefully specified masking noise. For optimum efficiency, suitable masking noise cannot be assumed to be available from a background hubbub of chatter or from music” (2000, p. 52). Salter, Powell, Begault and Alvarado (2003) support this idea by explaining electro-acoustical solutions for sound masking, which is placing
loudspeakers in the ceiling. Masking noise in office environments is called ‘white noise’, because it covers all frequencies in the sound spectrum, which can override disturbing components of office noise. However, conversations become less intelligible; the use of white noise becomes an additional sound stimulus, which increases sound pressure level of the ambient noise (Loewen, 1992).
Hongisto developed a model using the results of the existing literature for predicting the effect of speech on work performance. The model predicts that the complex task
performance can be reduced by 7% when STI is higher than 0.60, but speech does not affect work performance when STI is below 0.2. Three factors should be considered according to Hongisto’s predicting model (2005): high room absorption, high screens,
and appropriate speech masking. Same rules are used for avoiding noisy activities and achieve speech privacy in open-plan offices. Oldham and Brass focuses on other aspects of acoustical treatments, stating that “However, before any design element is introduced, its relationship to important work outcomes should already have been investigated” (1979, p. 283).
Wang and Bradley (2002a, 2002b) do extended researches, for predicting speech
intelligibility in open-plan offices. First study is about single screen dividers and second study is about privacy between two adjacent rectangular workstations. Wang and Bradley (2002a) studied on a mathematical model between two adjacent workstations by using image source technique. Problem is divided into two parts as single screen model and side-back panel model. Those models are investigated in three varying workstation orientation. Results have been tested by an experiment in National Research Council (Canada). This research does not include the effects of furnishing. Second study of Wang and Bradley (2002b) is about predicting the speech intelligibility index behind single screen in an open-plan office. A sound source and a receiver are used for calculating speech intelligibility index (SII). The effect of wall, ceiling and floor reflections on SII is discussed. Again, prepared mathematical model is tested on real situations.
Jones, Miles and Page’s (1990) study finds out that irrelevant speech restricts lower level of analysis performance such as detection of contextual errors in proofreading tasks were not affected by speech; however detecting non-contextual errors are impaired.
problems stated by employees are the lack of privacy and increased noise. Hongisto (2005) listed various tasks of work performance such as proofreading, short-term memory, reading comprehension, etc. In most of those cases, subjects are affected by intelligible speech. Banbury and Berry’s (1998) experiment analyzed memory and arithmetic tasks, which are called ‘office-related’ tasks. Results show that the irrelevant speech reduces memory for prose and mental arithmetic task performance impressively. In the second experiment performance reduced about one-third of the quite environment. Another sequence of five experiments was presented by Salame (1982), which are
dealing with phonological similarity effects of irrelevant speech on short-term memory of visually represented digits. However, there is no evidence of testing various task
performances in real open-plan office environments that all of the participants are experienced and familiar with the environment.
1.1. Aim and Scope
The aim of the study is to understand the effects of speech and speech intelligibility on computer based task performance in open-plan offices. Examining if the performance of open-office workers differ in variable sound environments such as speech, masked speech, and continuous noise to understand ideal acoustical conditions of an open-plan office in terms of speech and speech intelligibility in a real office environment.
Additionally current acoustical situation of the site STM Bilkent Headquarters is
It is expected that there are some significant short and/or long-term effects on occupants of open-plan offices. Also, STM Bilkent Headquarters case allows understanding the direct relation between the experience of working in an open-plan office environment and distraction of speech. The findings of the experiments may show distraction caused by intelligible speech on experienced open-plan office occupants.
Acoustical analysis of the case will provide detailed information on the blocking effectiveness of divider panels, and distribution of direct sound and reflections in a typical open-plan office environment. The difference between derived room acoustics parameters from acoustical simulation of present and renovated open-plan office should give an idea about appropriate open-plan office settings.
1.2. Structure of the Thesis
The thesis is composed of five chapters. First chapter is the introduction, which explains the open-plan office concept, acoustical problems that may occur, ways of occupant satisfaction, and previous studies that are conducted to find the affects on speech on varying task performances. Also, some studies about predicting methods for speech intelligibility were briefly explained.
Second chapter gives the requirements for speech intelligibility in open-plan offices. Firstly, spatial requirements, which are properties of divider panels or screens, ceilings, luminaries, floor materials and layout, are discussed in detail. Reasons of deciding major construction details of main elements are explained by giving the connections with
objective room acoustic properties. Secondly, those objective room acoustic parameters are explained. Definitions of the parameters and requirements for open-plan offices are stated.
In the third chapter, phases of the experiment are explained. Firstly, aim of the
experiment, research questions and hypothesis are given. Secondly, methods used in three phases of the experiment are given in detail. Thirdly, the site of case study and sample group are identified. Evaluations of three phases of the experiment are conducted. Lastly, analysis of the results derived from the experiment is done according to requirements of ideal open-plan office environment. Effects of speech and speech intelligibility on computer based task performance of STM Bilkent occupants are analyzed and acoustical characteristics of the site are discussed.
In the forth chapter, recommendations to improve occupant satisfaction and acoustical conditions in the site are given. Connections between room acoustics parameters and architectural solutions are explained. To be more reliable, results of the acoustical simulation of the renovated site are stated.
In the fifth chapter, the experiment is summarized, and conclusions are given. Also, suggestions on further studies are given.
2. SPEECH PRIVACY REQUIREMENTS IN OPEN-PLAN OFFICES
Speech itself is a part of sound in open-plan office environments with other sounds like footsteps, traffic noise, telephone rings, etc. The difference between other sound sources and speech is the meaning it carries. Distraction of work performance derives from its form of information, which is automatically processed by human cognitive system (Loewen, 1992). The attention of workers on their tasks hardly, if another source of information reach to their cognitive system. According to environmental load approach theory, “… individuals experiencing environmental stimulus bombardment may focus their attention exclusively on one stimulus or task, to the detriment of others” (Loewen, 1992, p. 382).
As Hongisto (2005) stated, both in open-plan offices and in conventional ones designer should aim at lower speech intelligibility for improved work performance. Also, design of the layout gain great importance because of psychological reasons like ‘privacy’. Workers of open-plan office have a potential to make private conversations and chat between workstations. Salter, Powell, Begault and Alvarado (2003) support that issue about cubicle layouts, which streets’ in between these cubicles become a natural conversation area. Therefore, to protect workers of open-plan offices from short-term task performance effects and long-term health issues, both spatial and acoustical
requirements have to be considered in the design process. The spatial requirements also provide room acoustics parameters to match the ideal levels of speech privacy.
2.1 Spatial Requirements
Besides economical reasons, the major aim of using open-plan office design is improved communication and social interaction between office workers. Therefore, design of the layout and partitioning has a great importance to achieve an adequate level of
communication. However, poor acoustical conditions are not taken seriously because of organizational benefits (Hongisto, 2005). Croon, Sluiter, Kuijer and Frings (2005) also point out that not only work performance, but also occupant health is affected by the new open-plan office concept. Open plan offices may increase distraction and irritability, and may affect the health office worker in the longer term. Also, personal one-on-one
conversations may be distracting, where they would be preferred not to be overheard. Therefore, the aim of the design should be increasing speech privacy (Newsham, 2005).
To construct an open-plan office with improved acoustical conditions, a great attention should be given to specific details. Divider panels between workstations, floor and ceiling materials should be selected carefully to fulfill the speech privacy requirements of an open-plan office. Requirements of speech privacy are given by Mohammad, Hassanain and Harkness (2000) as: Protection from both intelligible and non-intelligible speech, protection from other noises such as office equipment, and a level of background noise, which masks private conversations. The suggestions of partitioning properties and material selections of surfaces to achieve ideal acoustical conditions in open-plan office environments will be discussed under this chapter.
2.1.1. Partitions
The main element that defines acoustical satisfaction in an open-plan office area is partitions, which can be either drywalls that separate open-plan office area with other volumes, or divider panels between adjacent workstations. Partitions should provide an appropriate level of visual and acoustical privacy for improved working conditions.
First requirement for partitions is the noise reduction coefficient (NRC). The aim should be blocking direct sound energy of speech and reducing the background noise level generated by outer sound sources. Extraneous sounds can distract a listener. All kinds of natural background masking noise should be controlled in the area. Using
sound-absorbent material as finishing will be more effective for achieving speech privacy (Mohammed, Hassanain and Harkness, 2000). Also, sound blocking performance and NRC of doors is crucial for decreasing natural background noise and to minimize transmission of airborne sound.
Divider panels are mostly used for achieving an ideal level of speech privacy in open-plan offices by blocking the direct path of sound between workstations. They are usually open-weave, fabric-covered panels consisting of sound-absorbing material installed on opposite sides of an airtight hardboard or aluminum foil core. The sound transmission loss of the panel construction normally should not exceed 25 dB because its overall performance is limited by diffraction of sound energy over the top and around the sides. Larger divider panels and close distance between occupants and panels increase the overall sound transmission performance (Egan, 1988).
To block direct sound energy before reaching to the adjacent workspace, divider panels should be higher than heads of seated workers. Panels with enough height will also block visual communication between workstations; therefore will increase visual privacy (Newsham, 2005). Chusid states that partitions lower than 150 cm in height cannot block the sound energy efficiently, because the height is not enough to reach an average
standing adult. However, the height of the divider panels should not exceed the
psychological limit of closeness, especially if the workstations are small. Occupational stress that is caused by working in narrow cells may affect occupants’ health in a long-term.
Last point to consider is the layout of divider panels and location of workstations in the area. The high-traffic areas of circulation may distract occupants’ concentration because of one-on-one conversations and chat on those areas. Also, footsteps are one of the most distracting noise sources in an open-plan office. According to Newsham (2005) to prevent those factors, especially entrances of workstations should be away from circulation areas. Circulation areas between workstations should be as minimum as possible, and the distribution of workstations has to be distributed evenly around those areas. Also, size of every workstation should be as big as possible; therefore distance between adjacent workstations will increase to achieve speech privacy.
2.1.2. Materials
Material selections for floor, wall and divider panels are the key element for most of the room acoustics parameters. To achieve speech privacy all of the surface areas should be treated accordingly. Larger areas like ceilings and floors have a great impact on
reverberation time and direct sound energy, which is closely related with speech intelligibility.
Absorption coefficients of ceiling surfaces should be highest at speech frequencies that are 1000 Hz., 2000 Hz, and 4000 Hz, because, sound energy can be reflected by ceiling surfaces over divider panels toward adjacent workspaces (Egan, 1988). Ceiling surfaces should be absorbent, for instance has an absorption coefficient of 0.9 or higher
(Mohammed et al, 2000). This will have an effect on the level of reflected speech sounds. As a floor material, carpet may be an obvious choice for absorbing sound. Another issue is the impact noise that is generated by circulation traffic, therefore low impact noise floor covering materials should be considered to decrease the noise of footsteps, moving chairs, etc. The percentage of sound reflecting and sound absorbing materials should be decided according to desired level of reverberation time (Newsham, 2005). Lighting fixtures are also closely related with the absorption properties of ceiling surfaces. Ceiling-mounted fixtures with large flat lenses should not be used to prevent bouncing noise from one workstation to another (Chusid, 2001).
Wall surfaces should also be partially sound absorbent to ensure that the only speech sound perceived is direct sound from speaker to listener. Reflections of the speech sound
reinforce the sound energy to move between adjacent workstations. This decision is again depends on desired acoustical condition, for instance, using artificial background noise generators require lower reverberation times, but to achieve speech privacy without using masking noise, reverberation time should be higher.
Partitions that are dividing open-plan office area from outer space should have an
appropriate level of STL. Most applications of multiple layers of plasterboards with steel framing achieve ideal STL characteristics for office environments. Masonry walls may also be used to divide interior volumes, however, detailed attention must be given to floor and ceiling connections. As stated before, internal doors and windows should match the STL values of walls to prevent natural background noise.
Except those suggestions, the major importance should be given to administrative solutions in the organization. The social behavior of occupants directly affects speech privacy in open-plan office environments. Newsham (2005) claims that speech should be carried on at a level that provides just perceivable intelligibility and this is related with the occupant behavior in the office. However, open planning may not be suitable in cultures where visual and speech privacy are at high levels of importance.
2.2. Acoustical Requirements
The requirements of speech intelligibility are based on four room acoustics parameters; reverberation time, clarity, definition and speech transmission index. Those objective requirements define characteristics of speech in the space. Objective measures are the
connection between design and subjective effect. Objective acoustic terms describe created sound field at the listener’s position according to the behavior of sound in rooms. With the help of objective measures, it can be established how design determines the sound field and how ear will then interpret it (Barron, 1993).
Contrary to other halls of music and speech, in open-plan offices, the aim should be low speech intelligibility or in other words, better speech privacy. The measurements of objective criteria could be found by equations, measurements or computer simulations, in order to evaluate acoustical characteristics of the volume.
2.2.1. Reverberation Time
General scientific description of reverberation time is the time is required for sound energy to decay 60 dB after the sound source stopped. Today, reverberation time is the major acoustical parameter that defines acoustical characteristics of a room, and it is usually constant throughout the space (Barron, 1993).
There are three formulas for calculating the reverberation time. Those are Sabine formula, Eyring formula, and Millington-Sette formula. The Sabine formula is mostly used for live fields that have an average sound absorption coefficient of 0.3 or below. If the field is considered dead, which has an average absorption coefficient greater than 0.3, either Eyring, or Millington-Sette formula can be used. Eyring formula should be used if surfaces of the volume have similar sound absorption coefficients. Millington-Sette formula can even be used for fields that have variable surface materials, with different
sound absorption coefficients (Caliskan, 39). Those formulas are; Sabine Formula: RT = (0.163 V) / (αiSi + nAp +4mV) (Caliskan, 39) Millington-Sette Formula: RT = (0.163 V) / ∑-Siln(1 - αi)+nAp+4mV (Caliskan, 39) Where,
• V is volume of the room,
• Si is the surface area,
• -ln (1 - αi) is the sound absorption coefficient of the material i
• n is the number of people in the volume • Ap is the sound absorption of every person
• m is the energy reduction coefficient caused by humidity, temperature and frequency
Reverberation time requirement for offices is generally known as below 0.5 seconds, but in open-plan offices, there need to be a sufficient level of reverberation time to decrease intelligibility of speech. This ideal RT is based on the level of background noise and masking system in the open-plan office area. Offices with natural or electro-acoustical background noise need lower reverberation time in order to achieve speech privacy, however offices with lower background noise levels needs more reverberation time.
2.2.2. Clarity (C80)
Second room acoustics parameter that is connected with speech intelligibility is clarity of the sound in the field. Clarity can be defined as the ratio of early sound energy to late or reverberant sound energy. Early-arriving reflected sound energy is the main parameter that defines clarity of sound. Early sound is usually defined as the direct and reflected sound arriving within 80 ms (Egan, 1988). The objective clarity is defined with the formula as;
(Kuttruff, 2000, p.208)
The early arriving sound energy contributes to clarity and definition, while the late reverberant part provides an acoustic context against which the early sound is heard. For evaluating the clarity of music, the relevant time interval is 80 ms, while it is taken as 50 ms for speech (Makrinenko, 38). To decrease intelligibility of speech, C80 should be as low as possible for achieving a more blurred speech. However, the C80 parameter is mostly used for musical clarity, definition (D50) becomes more crucial for speech.
2.2.3. Definition (D50)
Definition is the ratio of the effective energy to the total energy in an impulse response. The effective energy contains both the direct sound energy and the reflected sound energy with respect to the direct sound by up to 50 ms (Su, 35). The definition formula is given as;
(Kuttruff, 2000, p.208)
To evaluate speech intelligibility by using definition parameter, early arriving sound energy should be high enough to achieve good acoustical conditions for speech. The ideal value of definition at halls for speech is higher than 0.15, however, in open-office
environments the aim should be unintelligible speech. Therefore lower values of
definition is required to create a better speech privacy in open-plan office environments.
2.2.4. Speech Transmission Index (STI)
Developed in the early 1970’s, the Speech Transmission Index (STI) is a machine measure of intelligibility whose value varies from 0 (completely unintelligible) to 1 (perfect intelligibility). The speech transmission index (STI) has been developed for the evaluation of speech intelligibility in both direct communication situations and electro-acoustical situations.
The calculation of STI combines various distortions, for instance echoes, peak clipping, and other nonlinear distortion and interfering noise. The STI parameter has been
improved and it takes into account other effects like non-contiguous frequency transfer and severe band pass limitation. While calculating STI male and female speakers are treated separately and a diffuse sound field is assumed (Larm & Hongisto, 2005). The reverberation time and the background noise have a direct effect on speech transmission index and speech intelligibility. STI also can be calculated by impulse responses of
enclosed spaces (Caliskan, 56). The explanation of STI values can be conducted as, 0.8 – 1.0 = Excellent
0.6 – 0.8 = Good 0.4 – 0.6 = Fair 0.0 – 0.4 = Bad
Overall STI values in an open-office should not exceed to excellent values, however, too low STI is caused by either very high value of reverberation time or background noise levels. Therefore, long-term effects of high background noise on occupant health have to be considered in order to achieve a better work environment, and proper acoustical design. Importance should be given balance the ratio between reverberation time and background noise, especially if the background noise source is natural and uncontrolled.
2.2.5. Background Noise
Background noise levels in the open-plan offices should be high enough to provide satisfactory speech privacy conditions by interfering with speech communication (Egan, 1988). Bradley and Gover state that acoustic comfort in an open-plan office is related to ambient noise and an adequate level of speech privacy. However, high levels of ambient noise will increase speech privacy; too much noise will not lead to optimum acoustic comfort (2004). The acoustical situation should not be described by sound pressure levels in dB which is a logarithmic measure. In the workplace even very low levels of sound may be high enough to interfere with communication and to be stressful. Noise is not only an interruption but also a disruption of thought. Even if the permissible noise level is
70dB (A) for simple office work and as low as only 55dB (A) for mentally challenging work, these thresholds cannot guarantee the safety of employees (Strasser, Gruen and Koch, 2000). The background noise should be under control and homogeneous, and should not exceed the maximum level of 55 dB in order to prevent negative effects on occupants health.
If needed, additional background noise can be provided by an electronic sound masking system. A single random noise generator is connected to an equalizer to create a shaped spectrum tuned to the room’s acoustical environment. A uniform level of background noise should be produced, so no one notices the masking noise. The loudspeakers should be located carefully throughout the space to produce the masking noise. They should be either placed on the ceiling or above the ceiling, so the masking noise can be distributed inside the plenum and produce a more uniform sound field throughout an office (Chusid, 2001).
3. EXPERIMENTAL STUDY
3.1. Aim of the Study
The aim of the study is to understand the effects of speech and speech intelligibility on computer based task performance in open-plan offices and examining if the performance of open-office workers differs in variable sound environments such as speech, masked speech, and continuous noise to understand ideal acoustical conditions of an open-plan office in terms of speech and speech intelligibility. Additionally, current acoustical situation of the site STM Bilkent Headquarters is analyzed and solutions are discussed under the guidance of task performance test results.
3.1.1. Research Questions
1. Is there any significant difference between computer-based task performances of open-plan office workers in variable sound environments?
2. What is the appropriate speech/noise ratio for computer based task performance in open-plan offices.
3. What are the acoustical properties of the case STM Savunma Teknolojileri Mühendislik A.Ş.?
4. Should the acoustical properties of the case STM Savunma Teknolojileri Mühendislik A.Ş. needs to be re-designed under the light of the results?
3.1.2. Hypotheses
There is a significant effect of intelligible speech on computer-based task performance.
3.2. Methodology
The case study consists of three main phases; Real-size measurements of the site,
computer simulation of the site, and the computer-based task performance test. First two phases were done to analyze room acoustics parameters of the selected open-plan office area in terms of reverberation time (T30), clarity (C80), definition (D50) and Speech Transmission Index (STI). Computer simulation of the site mainly done for achieving distribution graphs of room acoustics parameters, and the real-size measurements were done to analyze the effects of divider panels used in the open-plan office area. Again, the comparison between real-size measurements and computer simulation give a wider scope to analyze various parameters.
The computer-based task performance test is evaluating the open-plan office personnel under three different sound environments by using both subjective and objective
methods, to understand the effects of speech and speech intelligibility on computer based task performance. Statistical analysis of gathered data will guide the study to create solutions for a better work environment.
Results of three phases will be used to propose a better acoustical design for the STM Bilkent Office to improve the performance of the workers, and to improve the quality of the work environment.
3.2.1. Real-size Measurements of the Site
Real-size measurements of STM were analyzed by using Dirac 3.0 room acoustics software, which is a product of Bruel & Kjaer. It measures various room acoustics
parameters by using impulse response files such as MLS (Maximum Length Sequence) or Sweep signals. The Dirac delta function is infinitely short and has unit energy. A
system’s response to an impulse contains all the information on the system and is enough for analysis. Dirac uses the same method, measures and saves acoustical impulse
responses to calculate acoustical parameters. It can also calculate the impulse response using other signals to achieve better directivity, frequency spectrum and reproducibility than impulsive sound sources (Bruel & Kjaer, 2007, p.2). Examples of suitable non-impulsive excitation signals are the MLS signal, the sweep or swept sine (sine with frequency increasing linearly or exponentially with time), white noise and pink noise. To achieve more reliable results, an external directional sound source and an omni-directional sound receiver should be used.
For the measurement of STM office, Bruel & Kjaer OmniPower Sound Source Type 4292 (Figure 3.1) was used as an omni-directional sound source. To distribute the sound evenly to all directions, it uses 12 loudspeakers in a dodecahedral configuration. Another important equipment of the setup is the power amplifier that drives the omni-directional
sound source. To acquire maximum compatibility, Bruel & Kjaer 2716 Power Amplifier was used (Figure 3.2). Total output of the amplifier is 300 W, which fully match the requirements of the sound source with a guarantee of safety.
As a sound receiver, Bruel & Kjaer Type 2230 Sound Level Meter (Figure 3.3) was connected to the personal computer (PC) via AC output of the device. Calibration of the device held by an external pure tone calibrator at 94 dB. Also, before on-site
measurements, Dirac room acoustics software performed calibration on the sound device to achieve maximum reliability.
Figure 3.1. Bruel & Kjaer OmniPower Sound Source Type 4292
Figure 3.3. Bruel & Kjaer 2230 Sound Level Meter
For evaluating speech intelligibility criteria, measurements were focused on three basic objective parameters of room acoustics; Reverberation Time (T30), Clarity (C80) and Speech Transmission Index (STI). To obtain responses, internal MLS and internal E-Sweep signals, which are included in Dirac software, were used. For measuring
Reverberation Time and Clarity parameters, internal E-Sweep samples play backed and recorded simultaneously. For speech parameters, internal MLS signal processed by speech filters ‘male’ and ‘female’, which cuts out frequencies below 500 Hz and above 2000 Hz. It is not enough to gather only MLS response file, it has to be mixed with the background noise recordings of the site. To achieve this, another measurement was held by using external impulse selection, which record background noise level of the site.
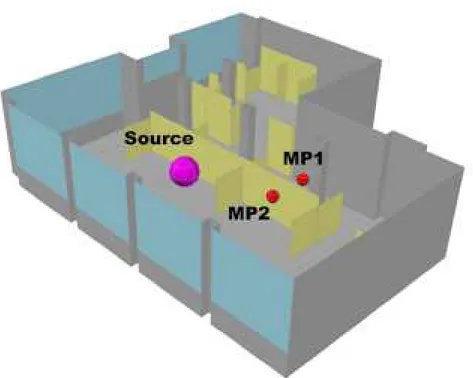
Measurements was performed in one sound source and two sound receiver positions, which are one in front of the divider panel (MP1) and one is at the back of the same panel (MP2), because it is important to observe the effects of divider panels in the open-plan
office area. Those positions are highlighted in the perspective view of the open-plan office (Figure 3.4).
Figure 3.4. Source and Receiver Positions for Real-Size Measurements
3.2.2. Acoustical Simulation of the Site
After deriving results of real-time calculations from Dirac software, it is important to check those results by comparing with a computer based acoustical simulation software, because most effective way of evaluating solution proposals is again modeling and simulating them in the same software. Nowadays, architects prefer evaluating their decisions about the shape of the interior space and the surface materials by using
flexible than a scale model and it is easy to modify the geometry and the surface materials of the computer model (Rindel, 2000).
In this study, Odeon 8.5 Room Acoustics Software was used for the acoustical simulation of the site. To give brief information, it uses prediction algorithms (image-source method combined with ray tracing) to simulate the interior acoustics of buildings. Odeon is both used for analyzing acoustics and for evaluating and recommending solutions of large rooms such as concert halls, opera halls, auditoria, foyers, underground stations, airport terminals, and industrial workrooms (Bruel&Kjaer, 2007).
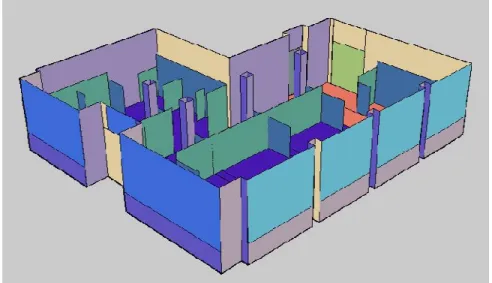
The very first step of the computer simulation is modeling the geometry of the space in AutoCAD 2007 by using face modeling technique (Figure 3.5.). After modeling the space and saving it in exporting format DXF, the model was opened in Odeon 8.5 Room
Acoustics Software. The next step was defining source types and positions. Point sources can be defined by directivity pattern, gain, equalization and delay, allowing the definition of natural sound sources or loudspeaker systems (Bruel&Kjaer, 2007). Also, receiver type and position was defined as a surface receiver, which is divided into grids of 0.50 m. to perceive detailed distribution graphs of variable room acoustics parameters.
Figure 3.5. 3D Model of the office in AutoCAD 2007
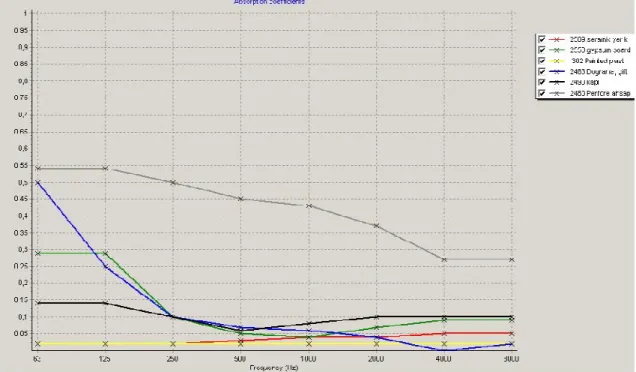
Materials were selected and assigned from Odeon’s own material library. The materials were assigned to surfaces that are already layered accordingly in the AutoCAD software. The sound absorption coefficients used in the model are shown in the Figure 3.6. It can also be defined by manually entering the absorption coefficients of desired materials from 63 to 8000Hz and a scattering coefficient and a transparency coefficient can also be used.
Figure 3.6. Absorption coefficients of materials assigned to the computer model in Odeon 8.5
To be sure that calculation results are reliable, it is important to check the consistency of geometries. Odeon includes a number of tools for geometry verification that check for duplicate, overlapping or warped surfaces. The ray-tracing display was used to verify the room geometry (Bruel&Kjaer, 2007).
Last step was the calculation of the results. Two methods are available in Odeon
software. The Global Estimate based on ray tracing, which is taking room shape, source position, and the position of absorbing materials into account. It uses an infinite number of points to simulate reverberation decay in the model. The other method, Quick Estimate is based on statistical formulae (Bruel&Kjaer, 2007). For evaluation of STM open-plan
office, the results of quick estimation and global estimation are compaired to obtain the results of different acoustical parameters and their distribution throughout the office.
3.2.3. Computer-Based Task Performance Test
The aim of the computer-based task performance test is to analyze the basic information processing abilities of engineers under three different sound environments; ‘speech’, ‘masked speech’ and ‘continuous noise’. The difference between those results will explain if the intelligible speech is affecting the overall performance of workers in open-plan offices or not.
The experiment was composed of two questionnaires and a computer based task performance test. Each subject was given two questionnaires, one before and one after the visual short-term memory test. The test is applied three times to the same subject, each for one sound environment. Before starting the experiment, subjects were given an introduction that clearly explains the procedure and each subject had some time for practicing the test.
First questionnaire is for evaluating subjects’ physical situations by three questions i.e. if they could sleep preceding night; if they have physical problems and if they are hungry. Subjects were asked to mark a number from the five-point scale given. Second
questionnaire is about their subjective self-evaluation about the test, for comparing with objective measured computer based performance test results.
3.2.3.1. Sound Environments
Three sound environments were used for the experiment. Every subject was exposed to three of the environments in the sequence of ‘continuous noise’ environment, ‘masked speech’ environment and ‘speech’ environment. For achieving more realistic results, both real office noise and white noise was mixed with the speech sample. Equivalent sound level is 60 dBA.
The first sound environment is the ‘continuous noise’ environment. This sample is composed by mixing recorded office sounds i.e. computer typing sounds, chair sounds, footsteps, and white noise. Speech cannot be heard at this sound environment because speech to noise ratio is -23dB, which means STI=0.00 (Venetjoki et al, 2006).
The second sound environment is the ‘masked speech’ environment. It is composed by mixing ‘continuous noise’ sound sample and a ten-minute speech sample derived from a Turkish TV program. Speech sample is used at 40 dB, and mixed with ‘continuous noise’ sound sample. Difference between the samples is -8 dBA, which means STI=0.30, simulating adjacent workstations in an open-plan office. However, speech can be heard, meaning of the speech cannot be understood clearly (Venetjoki et al, 2006).
The third and last sound environment is the ‘speech’ sound environment. The same ‘continuous noise’ sample is mixed with same ‘speech’ sample, however, this time difference between those two samples are +13 dBA (STI=0.80), which corresponds to open-plan offices with no acoustic design (Venetjoki et al, 2006).
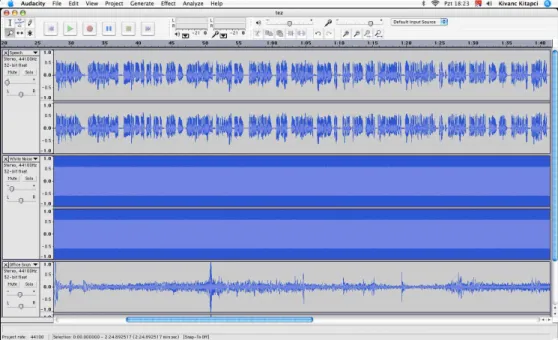
Audacity 1.2.6 free software was used for mixing audio samples (Figure 3.7). Samples used for ‘continues noise’ composition was derived from both live recordings via Shure Beta 58A microphone connected to Apple iMac G5 personal computer by M-Audio Audiophile soundcard, and free sound samples found on internet. Final compositions are ten minutes long, which is enough for even very long test sessions. An average person completes the test between forty seconds and one and a half minute. Normalization process was not applied to final recording, because high and low frequencies may be distracted. Sound sample used for ‘speech’ is from a TV Show and the subject is about health issues. The male sound is calm and stable that there are no distracting changes in the sample. Subjects listened to the final sound environment mixes through headphones in the real open-plan office environment to use other environmental parameters such as thermal conditions and lighting as it is in STM Bilkent Headquarters open-plan office environment.
3.2.3.2. Software
Computer based task performance test was a very simple arithmetic test, which
determines both accuracy and reaction time of the subjects. They were presented with an arithmetic problem in the middle of the screen and a target number in the upper right hand corner of the screen (Figure 3.8). The problem was always be comprised of two single-digit numbers bound by an arithmetic symbol (+ or –). Subjects were asked to;
• Press the right arrow key on their keyboard as quickly as possible, if the answer to the arithmetic problem is greater than the target,
• Press the left arrow key on their keyboard as quickly as possible, if the answer to the arithmetic problem is less than the target,
• Press the left and right arrow keys on their keyboard simultaneously as quickly as possible, if the answer to the arithmetic problem equals the target,
• Press the left arrow key if the answer is greater than the target and press the left arrow key if the answer is less than the target, when the word ‘Reversal’ appears.
To evaluate in the statistical analysis, two parameters were recorded after every test. First parameter is ‘accuracy’, and the second parameter is ‘reaction time’. In second
questionnaire subjects were asked that if they pay more attention to speed, or accuracy, for evaluating objective measurements. After the session was completed, every subject’s gender and age information were noted.
3.3. Case Study 3.3.1. Site Description
The experiment was conducted at STM Software Development Laboratory located within Bilkent University Cyberpark, which is for the software development activities and the promotion of research and development in the field of software tools, methods and practices with the incorporation of new technologies.
3.3.1.1. Layout
STM Bilkent University Cyberpark building consists of three floors; ground floor, first floor and second floor. Entrance and lobby area, security, meeting room, human relations office, dining area and one large open-office area is located on the ground floor, which has a L-Shaped plan. The long arm of the L-Shape leads to technical offices and the dining area. Also an unsecured entrance is located on the ground floor, which is used for service purposes. First and second floors are identical, consisting of three small and one large open-plan office areas and administrative offices. Circulation areas are located
around the atrium defined by the central staircase in a rectangular form, leading to office entrances. First and second floors differ from ground floor by their rectangular floor plan.
The building has a total of nine open-plan offices, which has varying capacities of four to forty office personnel. Software development department use the largest two offices, which are located on the ground floor and first floor. The one on the ground floor level has a capacity of forty-five software developers. It also has a separate closed office that is located at near of the entrance of the open-office area for administrative personnel. The dividers used in the open-plan office area are 167cm in height and allow visual and acoustical contact while standing at any point of the office. Other open-plan office that is located on first floor has a limited capacity compared to the first one that is thirty-two personnel. The space dividers used in that open-plan office has a height of 190cm that does not allow any visual contact while standing in the area.
The open-plan office on the ground floor was selected for the experimental study (Figure 3.9). First reason for selecting this office is the personnel capacity. However the
experiment was not applied to only residents of that office, capacity has a major effect on background noise levels. Second reason is the type of dividers used. Openness is the key element of an open-plan office area, and ground floor open-plan office has a better visual contact compared to first floor open-plan office.
Figure 3.9. Location of the selected open-plan office at the ground floor
3.3.1.2. Sample Group
The sample group consisted of a total of 40 full-time workers of STM Bilkent Cyberpark. The building accommodates administrative, technical and software departments.
However, total number of personnel working in that building is 110, circulation between STM headquarters, SSM (Civil Defense Undersecretaries) and STM Bilkent University Cyberpark decrease the number of available software developer personnel. For the experiment, 40 available software developers participated to the computer-based task performance test. All of the participants work in open-plan offices, so they are all familiar to the work environment selected for the experiment.
3.3.2. Results of the Real-size Measurements
Reverberation time, clarity, definition and speech transmission index values were gathered from real-size measurements of the site. Those results were analysed for three frequencies, 500 Hz, 1000 Hz and 2000 Hz, which are in speech frequency spectrum.
3.3.2.1. Reverberation Time (T30)
The first parameter is Reverberation Time (T30). RT requirements for general-purpose offices are below 0.5 seconds. The average value for the back of the divider panels that is Measurement Point 1 (MP1) is 0.76 seconds at 1000 Hz and 0.67 at 500 Hz. To evaluate according to speech intelligibility, RT values at 2000 Hz should also be considered, which is 0.69 for MP1. Frequencies below 500 Hz and above 2000 Hz are not considered in the evaluation. A measurement result from front of the divider panels, which is
Measurement Position 2 (MP2), is close to the results from MP1. Average T30 values for MP2 is 0.52 s. at 500 Hz, 0.66 s. at 1000 Hz and 0.62 s. at 2000 Hz. It is observed that measurement results at MP1 are slightly higher than the results gained from MP2. The difference between two measurement points derives from ceiling and wall reflections affecting the receiver at the back of divider panels. Because receiver location of MP2 is closer to the sound source, it is not affected from surface reflections as much as receiver of MP1. Both measurement points have a higher reverberation time than it should be. Results show that the office volume has an average reverberation time ranging from 0.52 s. to 0.76 s, however it still cannot be stated that the RT values are not appropriate for the open-office area. The results should be evaluated according to speech intelligibility
requirements, so slightly higher RT values may not distract the office personnel, because it may help to reduce the intelligibility of speech.
By analyzing Early Decay Time (EDT) values from Table 3.1 and Table 3.2, it is found that EDT values are lower than 10% of T30 values in all frequencies. This percentage is lower at MP2 than MP1, however it still means that there are some reflective surfaces directing early reflections to receivers. For good acoustical conditions EDT values should not exceed 10% of RT. For MP1 at high frequencies it is observed that RT and EDT are the same, however at mid frequencies, the difference is again exceeding 10% of RT. This means, there are some surfaces reflecting mid frequencies on to the receiver. At MP2 the problem persists in all frequencies ranging from 250 Hz to 8000 Hz, so surfaces that reflect all frequencies cause early reflections on to the receiver of MP2. The overall range of EDT from 0.30 s. to 0.69 s. at speech frequency range and difference between back and front of divider panels in open-plan office shows that, reflective surfaces such as divider panels cause early reflections on working areas, so distribution of RT become uneven throughout the office volume. Reflective and absorptive surfaces should be designed accordingly to achieve an even distribution of RT throughout both circulation paths and at working areas.
Table 3.1. Reverberation Times for Measurement Position 1
Figure 3.10. T30 Values for Measurement Position 1
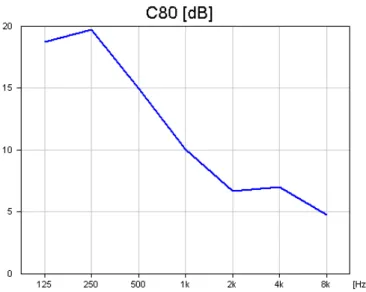
3.3.2.2. Clarity (C80) and Definition (D50)
Relatively small size of the office volume and closeness of the sound source to the receiver cause a high level of early reflections arriving to the receivers. However the C80 values are very high than it should be, the difference between two receiver positions should be considered to evaluate the results. The clarity results for MP1, which is back of the divider panels are 14.96 dB at 500 Hz, 10.05 dB at 1000 Hz and 6.67 dB at 2000 Hz. Low frequencies ranging from 125 Hz to 250 Hz and high frequencies over 2000 Hz again are not considered while evaluating clarity parameters. Result for the MP2, which is in front of the divider panels are 12.41 dB at 500 Hz, 9.46 dB at 1000 Hz and 11.52 dB at 2000 Hz. The main difference between clarity values of MP1 and MP2 is at 1000 Hz and 2000 Hz. However, both measurement points have higher clarity values at low frequencies; early reflections (<80ms) are lower at higher frequencies. Especially clarity values of MP1 at 2000 Hz is lower than MP2, because of higher RT caused by ceiling and wall reflections directed to the MP1 receiver. Further analysis according to optimum C80 standards are done according to distribution graphs derived from Odeon Room Acoustics Software.
Definition (D50) is analyzed by looking at Table 3.3 and Table 3.4. D50 should be higher than 0.15 for speech purposes, however, higher values means better intelligibility of speech is the volume. Results for MP1 are 0.94 at 500 Hz, 0.85 at 1000 Hz, and 0.68 at 2000 Hz. For MP2 results show that D50 is 0.93 at 500 Hz, 0.85 at 1000 Hz and 0.87 at 2000 Hz. While comparing two measurement positions, there exists only slight difference at 2000 Hz values resulting in relatively lower speech intelligibility in MP1, which is at
the back of the divider panels. Divider panels block the sound energy received in first 50 ms at 2000 Hz, so the ratio of early arriving sound energy to total sound energy becomes lower at MP1. MP2 receives more early sound energy because there are no interruptions between the sound source and the sound receiver of MP2. More detailed evaluation of D50 values are discussed by looking at distribution graphs derived from Odeon in Chapter 3.3.3.3.
Table 3.3. Clarity (C80) and Definition (D50) Values for Measurement Position 1
Figure 3.12. Clarity (C80) Values for Measurement Position 1
3.3.2.3. Speech Transmission Index (STI)
To gain the STI, impulse response samples and background noise sample was mixed in Dirac software. Analysis of the STI was made the final mixed sample. According to real-size measurement results, STI is 0.73 for female and 0.79 for male filter, which
corresponds to good – perfect speech intelligibility (Figure 3.14.). RASTI filter did not used on MLS signal, so the RASTI result is not reliable for this measurement. More detailed analysis of speech intelligibility is conducted by looking to the STI distribution graphs of Odeon room acoustics software simulation.
Figure 3.14. STI Values
3.3.3. Results of the Acoustical Simulation
Acoustical simulation of the site was analyzed by investigating distribution graphs of reverberation time (T30), clarity (C80), definition (D50) and speech transmission index (STI). Frequencies in the range of speech spectrum, which are 500 Hz, 1000 Hz, and 2000 Hz were evaluated.
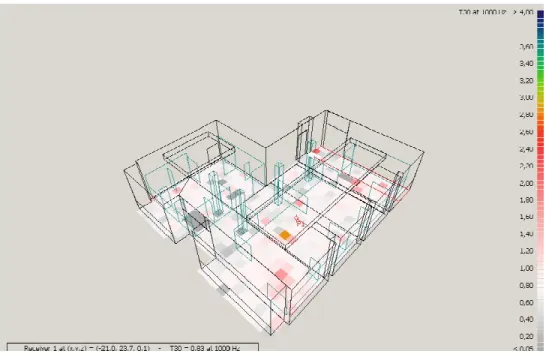
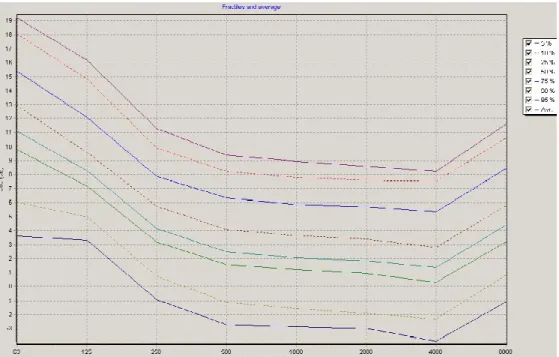
3.3.3.1. Reverberation Time
To figure out RT of the office volume, both quick estimate and global estimate results were analyzed. Differences between these results will show the affects of geometry and volume of the office area. Looking at quick estimate table (Figure 3.15), Eyring results are 0.61 s at 500 Hz, 0.63 s at 1000 Hz and 0.70 s at 2000 Hz, which are very close to real-size measurement results. The global estimate calculations with grid responses are 0.67 s at 500 Hz, 0.83 s at 1000 Hz and 1.03 s at 2000 Hz. When compared with the quick estimate and real-size measurement results, global estimate RT values are slightly higher at 500 Hz and 1000 Hz, and have a great different at 2000 Hz. For achieving good acoustical conditions, both the RT and its distribution through volume is important, which should be equal in general. In this situation, it can be seen from distribution graphs plotted from Odeon (Figure 3.16, Figure 3.17 and Figure 3.18) that especially at the corners of the office there are some focal points of higher reverberation times up to 2.40 s. The focal point, which is at the center of the office area, is the location of sound source, so it is not considered as a problem. Average T30 values are shown at Figure 3.19.
Figure 3.16. T30 values at 500 Hz
Figure 3.18. T30 values at 2000 Hz
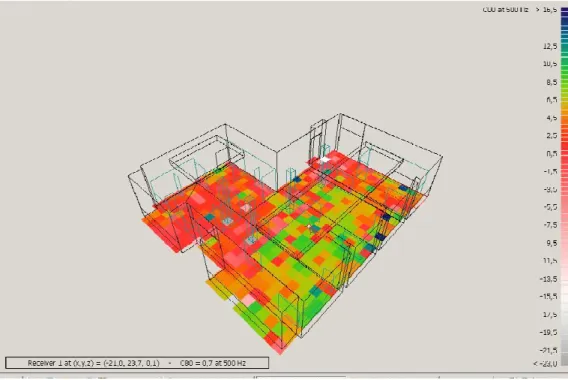
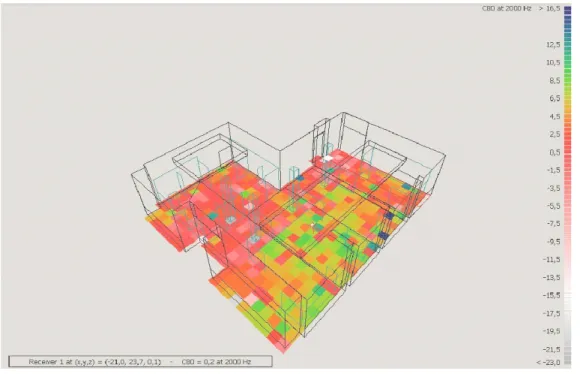
3.3.3.2. Clarity (C80)
Evaluating the clarity distribution maps for low, mid (Figure 3.20, Figure 3.21, Figure 3.22) and high frequencies, it is seen that divider panels decrease the clarity of the sound significantly. The average clarity values are 0.7 dB at 500 Hz, 0.5 dB at 1000 Hz and 0.2 Hz at 2000 Hz. Because the ceiling and wall reflections are higher at 500 Hz and 1000 Hz the ratio between early reflections and late reflections increase at these frequencies. Affects of divider panels are seen clearly by looking at clarity distribution graphs that areas close to the sound source has higher clarity values between 8.5 dB and 12.5 dB, however, back of the divider panels clarity values decrease between -1.5 dB and 2.5 dB. There are three focal points shown on clarity distribution graphs at mid frequencies, which result at 16.5 dB. Average C80 values are displayed at Figure X.X.
Figure 3.21. C80 values at 1000 Hz
Figure 3.23. C80 Average Values
3.3.3.3. Definition (D50)
The definition distribution graphs (Figure 3.24, Figure 3.25, Figure 3.26 and Figure 3.27) show that average D50 values are 0.43 at 500 Hz, 0.40 at 1000 Hz and 0.38 at 2000 Hz. Distribution of the parameter is not homogeneous in the area because of varying sound energy levels across the volume. Areas closer to the sound source has higher D50 levels ranging from 0.75 to 0.80. Back of the divider panels that are away from the sound source has a larger spectrum of D50 ranging from 0.01 to 0.70. Lower D50 levels cause poor speech intelligibility, so the distribution graphs show that divider panels are working effectively at low frequency isolation. At high frequencies like 2000 Hz and 4000 Hz, D50 values also decrease at closer points to the sound source. As it is seen in the definition distribution graphs, far corners of the open-plan office area are lack of total sound energy, and showing very low sound definition properties.
Figure 3.24 D50 Values at 500 Hz
Figure 3.26. D50 Values at 2000 Hz
3.3.3.4. Speech Transmission Index (STI)
Average speech transmission index for the office area is 0.60 (Figure 3.28), which means good in terms of speech intelligibility. Areas closer to the sound source has a higher STI value in between 0.75 to 0.80 meaning excellent speech intelligibility. Even at close distances from the sound source, there are some death spots in terms of speech intelligibility. Those death points are mostly at the back of divider panels used in the open-office area. The lack of energy transmission from one side of the divider panel to the other cause the STI decrease to the levels of 0.55 – 0.60. Again, at the far corners of the office area, there are hot spots of speech transmission index that are caused because of surface reflections.