THE EFFECTS OF THE ASIAN CRISIS TO TURKISH
MANUFACTURING INDUSTRY: THE CASE OF
TEXTILE, FOOD AND CEMENT INDUSTRIES
Alövsat MÜSLÜMOV
Doğuş University, Department o f Management
Abdülmecit KARATAfi
Boğaziçi University, Department o f Management
ABSTRACT: This paper hypothesizes that Asian crisis has severely affected the financial dimensions of the Turkish industries. The analysis of the financial data for 70 companies from textile, food and cement industries provides evidence to partially support this hypothesis. By principal components analysis we identified five statistical factors that is meaningful and economically significant to represent main financial dimensions contained in twenty-one financial variables of the sample firms. The discriminant analyses based on the identification of the discrimination between financial dimensions of the sample firms for pre- and post-crisis years identified that profitability margins of the export-oriented Turkish textile industry significantly decreased in post-crisis years. No statistically significant changes in financial dimensions are detected for food and cement industries in post-crisis years. Key words: Asian crisis, textile industry, principal components analysis,
discriminant analysis
ÖZET: Bu makale Asya krizinin Türk sanayisinin finansal boyutlarını ciddi biçim de etkilediğini öngörmektedir. Tekstil, gıda ve çimento sektörlerinden 70 şirketin fi nansal verleri kullanılarak yapılan analiz bu öngörüyü kısmen desteklemektedir. Te mel komponentler analizini kullanarak yirmi bir finansal oranın içerdiği bilgileri temsil eden, anlamlı ve ekonomik olarak anlamlı beş istatistiksel faktör bulduk. Fi nansal boyutlar arasında kriz öncesi ve sonrası yıllar arasında farklılaşım bulunup- bulunmadığını test eden diskriminant analizi ihracata yönelik Türk tekstil sanayisi nin karlılık marjlarının kriz sonrası yıllarda istatistiksel olarak anlamılı düşüş gös terdiğini tespit etmiştir. Gıda ve çimento sektörleri için kriz sonrası yıllarda finansal faktörler açısından istatistiksel olarak anlamlı bir değişim bulunamamıştır.
Anahtar Kelimeler: Asya krizi, tekstil sanayisi, temel komponentler analizi, disk
A lovsat Muslumov, Abdulm ecit Karata§ 92
I. INTRODUCTION
The economic crisis that hit Asian countries in 1997 is one in the series of major economic shocks that have affected emerging economies over the last years. Many observers have attributed the rapid spread of these crises to contagion, which is the infection through some agents, such as foreign trade channels and vulnerability of the foreign capital. Studies conducted on the contagion effect of the global crisis identified two types of the contagion effect; pure and fundamental. It is usually believed that financial crises may spread among developing countries due to what is called "pure" contagion, a contagion that is not based on the fundamentals of the economy.
Turkey experienced a currency crisis in 1994. While struggling with the negative effects of this crisis, Asian crisis hit Turkey’s economy, which are infected by "pure" contagion through (1) foreign trade channels, (2) real exchange rates, (3) real interest rates, (4) contracting domestic demand.
This paper is examining how the Asian crisis has affected Turkish industries. For this purpose, we study 70 publicly traded firms from textile, food, and cement production industries.
Using principal components analysis, we extracted five representative orthogonal factor variables from twenty-one financial ratios to be used in the subsequent discriminant analyses. These orthogonal factors are 1) Capital turnover and return on investment factor; 2) Profitability margins factor; 3) Short-term liquidity factor; 4) Financial leverage and equity turnover factor; 5) Shareholders’ profitability and debt cost factor. The factors are theoretically based and economically significant. Discriminant analyses based on the factor scores derived in the principal components analysis reveal that pre- and post-crisis years are discriminated only in terms of the profitability margins for textile industry. No discrimination is detected between pre- and post-crisis years for food and cement production industries. This means that the textile industry, which is the most sensitive sector in the Turkey to the changes in the world trade conditions, experienced the effects of the Asian crisis through declining profitability margins. This is most probably due to the loss of competitiveness power in the foreign trade channels due to weak position of the Turkish currency against the devalued Asian currencies. More heterogeneous, domestic-market oriented food sector and homogeneous, domestic-oriented cement industry has not been affected by the crisis. This result implies that the Asian crisis did not result in the contraction of the domestic demand and was felt only through the foreign trade channels. Contrary to the research predictions, the increasing real interest rates due to the scarcity of international funds and continuous finance needs of the government apparently didn’t affect the financial leverage of the firms in textile, food and cement sectors.
The remainder of the paper is organized as follows. Section 2 describes the sample and data. Section 3 discusses and reports the results of the principal components analysis used to calculate variable values. Section 4 reviews research design.
Section 5 presents the empirical results of discriminant analyses. Section 6 concludes the paper.
II. SAMPLE AND DATA
Our sample consists of 70 manufacturing firms whose shares are actively traded in Istanbul Stock Exchange. These companies were selected from textile, food, and cement production (construction) industries and have following distribution to industries.
Textile Industry - 33 companies
Food Industry - 26 companies
Cement Production Industry - 11 companies
Textile industry together with ready-made garment industry has a very important position in Turkish economy. Textile industry accounts for 40 percent of Turkish exports, employs about two millions workers, 21 percent of the industrial labor force. Food industry is another locomotive industry in the Turkish economy, however, more domestic-oriented and heterogeneous than textile industry. Cement production industry is producing homogenous goods and the most domestic-oriented industry. It is added to the analysis for making comparable and valid inferences.
The source of the financial data is Istanbul Stock Exchange’s Online Database.. III. VARIABLES
3.1. Principal Components Analysis
The study of the effects of Asian crisis on the company performance requires the calculation and monitoring of the twenty-one different financial ratios. But the properties of and correlations among the financial ratios allow finding a manageable set of representative variables from a set of ratios suitable for analytic purposes. The reduced set can be used for the use in the subsequent multivariate analyses.
Using a small subset of ratios to represent the whole set requires choosing ratio that satisfies following conditions:
1. Highly correlated with those ratios excluded, and 2. Not correlated with the other ratios in the subset.
Principal components analysis could be used to classify ratios into groups that meet the above-mentioned two conditions. Each of these partitions is assumed to be affected by an underlying factor, the nature of which is not specified by the statistical model.
Several academic studies have attempted to identify ratio subsets that meet these conditions. Pinches et al. (1975) examined 48 different ratios for 1966 through 1969 and found that they could be "explained" by only 7 empirical factors which is stable
A lovsat Müslümov, Abdülm ecit Karata§ 94
over the four-year period. Other studies using different sample firms, periods, and sets of ratios reported alternative factor groupings. Chen and Shimerda (1981) reconciled these studies and showed that the apparent differences were due to nomenclature and were subsumed by the seven factors found by Pinches et al. (1975).
3.2. Research Design and Assumptions
In this principal components analysis, we have designed R type analysis that analyses a set of variables and determines factors.
The principal components analysis is based on the six-month period data from June 1992 to December 1998 consisting of 14 periods for each company. Since financial ratios calculated from yearly and six-month income statement tables are not comparable, we have multiplied the values in the six-month income-statement tables by two. Subtracting the values of first six-month income statement tables from the values of annual income statement tables and then multiplying them by 2 retrieve the corrected values in the annual income statement tables. No transformation has been made on balance-sheet data.
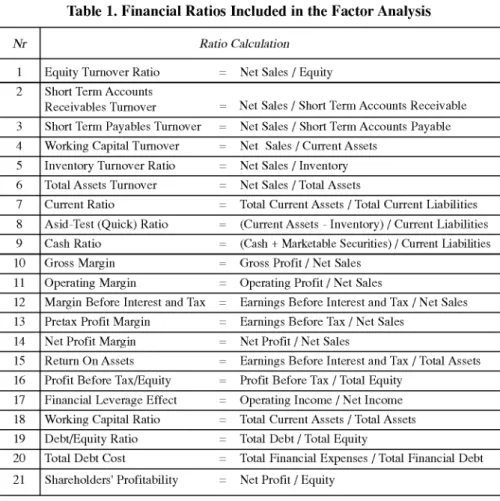
The initial variable space consists of 21 variables whose definitions and calculations of these variables are provided in the Table 1. These variables cover most of the information about financial dimensions of the firms.
The analysis of the sample against the crucial assumptions show that these assumptions are satisfied by the sample, yet there are some problems. The normality study of the twenty-one financial ratios included in the analysis shows that none of the twenty-one financial ratios is normal. Previous studies in the factor analysis also indicated non-normality for all financial ratios and derived factors. Fortunately, from a statistical standpoint, the departures from the normality apply only to the extent that they diminish the observed correlations and only normality is necessary if a statistical test is applied to the significance of factors, but these tests are rarely used (Hair, et al. 1998).
Inspection of the correlation matrix reveals that 61 out of 210 cross correlations is found to be with absolute values higher than 0.30 and are significant. The ratio of significant correlations is % 29.05.This evidence shows that the sample is appropriate for principal components analysis.
The Bartlett Test of Shpericity shows that non-zero correlations exist at the significance level of 1 %. The reduced set of variables meets the necessary threshold with an Kaiser-Meyer-Olkin measure of sampling adequacy value of 0.73. All of these findings is the evidence of the appropriateness of the sample for the principal components analysis.
Each variable’s MSA values except that for debt/equity ratio exceeds 0.50, which is the minimum required MSA value for considering the variables for factor analysis. For the case of debt/equity ratio, we are unwilling to exclude this data from the
analysis, since this variable is highly important leverage indicator that must appear in the analysis. Therefore, we decided to keep this variable in the analysis while carefully considering its possible effects.
The analysis of the significance of correlations in the anti-image correlation matrix show that 150 out of 210 correlations, which constitute % 71.5 of all correlations are significant at % 10 significance level. This result also supports the appropriateness of our data for the principal components analysis.
Table 1. Financial Ratios Included in the Factor Analysis
N r Ratio Calculation
1 Equity Turnover Ratio = Net Sales / Equity 2 Short Term Accounts
Receivables Turnover = Net Sales / Short Term Accounts Receivable 3 Short Term Payables Turnover = Net Sales / Short Term Accounts Payable 4 Working Capital Turnover = Net Sales / Current Assets
5 Inventory Turnover Ratio = Net Sales / Inventory 6 Total Assets Turnover = Net Sales / Total Assets
7 Current Ratio = Total Current Assets / Total Current Liabilities 8 Asid-Test (Quick) Ratio = (Current Assets - Inventory) / Current Liabilities 9 Cash Ratio = (Cash + Marketable Securities) / Current Liabilities 10 Gross Margin = Gross Profit / Net Sales
11 Operating Margin = Operating Profit / Net Sales
12 Margin Before Interest and Tax = Earnings Before Interest and Tax / Net Sales 13 Pretax Profit Margin = Earnings Before Tax / Net Sales
14 Net Profit Margin = Net Profit / Net Sales
15 Return On Assets = Earnings Before Interest and Tax / Total Assets 16 Profit Before Tax/Equity = Profit Before Tax / Total Equity
17 Financial Leverage Effect = Operating Income / Net Income 18 Working Capital Ratio = Total Current Assets / Total Assets 19 Debt/Equity Ratio = Total Debt / Total Equity
20 Total Debt Cost = Total Financial Expenses / Total Financial Debt 21 Shareholders' Profitability = Net Profit / Equity
3.3. Empirical Results
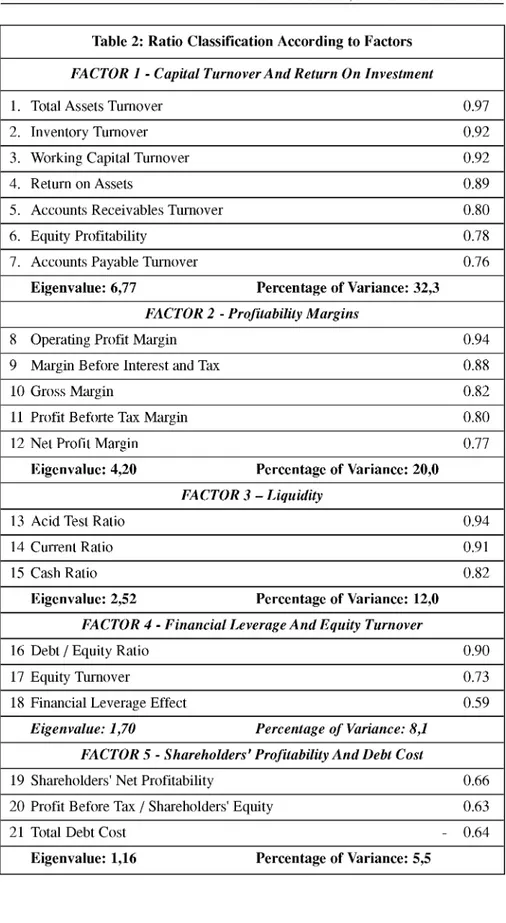
Using Latent Root Criterion Method, five factors are extracted with eigenvalues greater than 1. The explained percentage of the last factor is % 5.5. Total variance explained with five factors is % 77.9 that is very satisfactory. In the reproduced correlation matrix, there are 51 (% 24.0) residuals with absolute values greater that 0.05. This ratio is not seems as to threat the reasonable interpretation of our findings. It also shows the goodness of fit of factors derived.
A lovsat Muslumov, Abdulm ecit Karata§ 96
Since our purpose is to obtain orthogonal factors, Orthogonal Rotation Method is applied. VARIMAX method that centers on simplifying the columns of factor matrix is used to redistribute the variance of variables.
Variable operationalization is given in the table 2. We called the factors as following. 1. Capital Turnover and Return on Investment Factor
2. Profit Margins Factor 3. Short term Liquidity Factor
4. Financial Leverage and Equity Turnover Factor 5. Shareholder’s Profitability and Debt Cost Factor
Summarizing, the results of the principal components analysis suggest that twenty- one financial ratios can be condensed in five orthogonal financial factors resulting in 76 percent reduction in the space. Each factor represents a unique dimension in the description of financial characteristics of a business firm. Moreover, these five factors explain 78 percent of variation in the variables included in the analysis. 3.4. Discussion and Comparison with Previous Researches
The results of the principal components analysis conform to study conducted by Pinches et al. (1975) with few exceptions. In our study, capital turnover ratios, return on assets and equity profitability ratios are combined in the single factor whereas in Pinches’ study they constituted two different factors. Another difference is that there are three different turnover factors in the Pinches study. However, in our study, all of the turnover ratios except equity turnover ratio have formed single turnover factor along with return on investment ratios.
The last and most important difference is derived fifth factor that includes shareholders’ profitability ratios. This ratio is included into profitability factor in Pinches’ study. This exception bears a cue that profitability of total equity and profitability of shareholders’ equity ratios are not very closely related in Turkey. That means that total equity and shareholders’ equity are different, and shareholders’ equity is mainly stable and does not change in accordance with the financing needs of the company. This conclusion also provides support to the pecking order theory which claim that firms prefer internal finance, if external finance is required debt, the possibly hybrid securities such as convertible bonds, then perhaps equity as a last resort is issued.
Table 2: Ratio Classification According to Factors
FACTOR 1 - Capital Turnover A nd Return On Investment
1. Total Assets Turnover 0.97
2. Inventory Turnover 0.92
3. Working Capital Turnover 0.92
4. Return on Assets 0.89
5. Accounts Receivables Turnover 0.80
6. Equity Profitability 0.78
7. Accounts Payable Turnover 0.76
Eigenvalue: 6,77 Percentage of Variance: 32,3
FACTOR 2 - Profitability Margins
8 Operating Profit Margin 0.94
9 Margin Before Interest and Tax 0.88
10 Gross Margin 0.82
11 Profit Beforte Tax Margin 0.80
12 Net Profit Margin 0.77
Eigenvalue: 4,20 Percentage of Variance: 20,0
FACTOR 3 - Liquidity
13 Acid Test Ratio 0.94
14 Current Ratio 0.91
15 Cash Ratio 0.82
Eigenvalue: 2,52 Percentage of Variance: 12,0
FACTOR 4 - Financial Leverage A nd Equity Turnover
16 Debt / Equity Ratio 0.90
17 Equity Turnover 0.73
18 Financial Leverage Effect 0.59
Eigenvalue: 1,70 Percentage o f Variance: 8,1 FACTOR 5 - Shareholders' Profitability A nd Debt Cost
19 Shareholders' Net Profitability 0.66
20 Profit Before Tax / Shareholders' Equity 0.63
21 Total Debt Cost - 0.64
A lovsat Muslumov, Abdulm ecit Karata§ 98
IV. THE RESEARCH DESIGN 4.1. Asian Crisis and Contagion Effect
Globalization of the world economies makes them sensitive to the fluctuations to the other economies. Recent years witnessed a number of economic shocks in the developing economies; one of the major examples that affected the rest of the world, including Turkey is the Asian Crisis occurred in 1997.
There were many internal and external causes of Asian crisis. Internal causes of the Asian crisis were valuation of the real exchange rates, large external deficits, inflated property and stock market values, the prolonged maintenance of fixed real exchange rates, the lack of the solid enforcement and inadequate supervision of financial system, the lack of the transparency in financial markets, the problems of management and political instability in the region, and most important excessive short-term borrowing. Underestimation of the risks by international investors, speculative attacks of foreign individual and institutional investors have also contributed to downward pressure on currencies (Roubini (1998), Corsetti et.al., 1998).
Global crisis has resulted in the huge devaluations in the crisis countries’ currencies that led to the increased competitiveness power of those countries against remaining countries. Since competitiveness is measured by real exchange rates, Turkey’s competitiveness power decreased by % 44.1 against Indonesia, % 67.6 against Thailand, and % 46.4 against South Korea. The decrease in the real exchange rates of Asian countries had down-pulling effect on the prices in the international markets that lead to market losses of countries other than Asian. An important observation is that, during the Asian crisis and as the crises spread over other countries, Turkey did not devalue its currency to preserve its competitive position in its export markets. The purchasing power of TL was kept almost constant against a basket of US dollar and German mark. However, since most of the Eat Asian countries, who are competitors, and Russia, who is the trade partner, devalued their currencies, Turkey’s competitive position may have weakened.
In the other hand, global crisis has resulted in the significant amount of foreign capital outflows in Turkey. Ertuna (1999) shows that when foreign capital leaves the market of government securities, the interest rates increase sharply in Turkey. Since the Turkish government is in the continuous needs of financing, government issues debt to pay its interest expenses, which pull the real interest rates up. These high real interest rates attract domestic producers to investing in high-return government securities instead of real production, which is highly dangerous situation in the economy that leads to the stagflation.
4.2. Testable Predictions
We are interested in the effects of the Asian crisis on the financial dimensions of the companies. Therefore, we should look whether pre- and post-crisis years are discriminated in terms of the financial dimensions and industries.
The period between 1996 and 1998 years were renowned as global crisis period and its reasonable to assume that profitability margin of textile industry companies dropped substantially. Since Turkish textile industry experienced a contracted domestic demand and weakened competitive position in abroad due to substantial devaluations in the Asian currencies, capital turnover variables are supposed to decline significantly in 1998 compared with 1996. Shareholders’ profitability is also supposed to decline significantly as a result of declining profitability. Since production became no longer more profitable than investing in public securities (real interest rates of public securities is around 25 %), an inflation in the short-term liquidity are predicted. Increase in the financial leverage is another predicted effect of the global crisis.
Summarizing, we predict that (1) profitabilitymargins decrease after crisis to reflect decreasing competitiveness power in international markets and decreasing demand in domestic market, (2) turnover declines after crisis to reflect the downtrend caused by deteriorating market conditions, (3) financial leverage increases due to abnormally high real interest returns, (4) liquidity increase due to the investment in public securities.
Textile sector is predicted to be most strongly affected by unfavorable market conditions since they are more sensitive to the fluctuations in the international markets. Since food industry is more heterogeneous and domestic-oriented, mixed results could be observed. No significant negative effects is predicted for cement industry since they mainly serves to the domestic market and unlikely to be affected by the contagion.
4.3. Research Methodology
Since we are interested in the discrimination of the pre- and post-crisis years in terms of the financial dimensions across three different sectors, we use step-wise discriminant analysis to get insight into discrimination among periods across industries.
To test the research predictions, we define 1996 year as pre-crisis and 1998 year as post-crisis years. 1997 year is excluded from the analysis since the variable values for this year is not comparable across industries and the effects of the crisis have not seriously been felt in this year.
Factor scores derived in the principal components analysis are used in the subsequent multivariate analyses.
V. EMPIRICAL RESULTS
5.1. Discriminant Analysis of Pre- and Post-Crisis Years for Textile Industry The sample partially satisfies the assumptions of the discriminant analysis. Since total number of 64 companies in the analysis and there are 5 variables, there is 12.8 to 1 ratio of observations to predictor variables, which fall within acceptable limit of the sample adequacy.
A lövsat Müslümov, Abdülm ecit Karata§ 100
Box’s M Test statistics, which is used for testing the equality of the covariance matrices, is equal to 6.02 and can be approximated to F-statistics value of 5.92, which is statistically significant in the % 5 level. This means that the equality of the covariance matrices assumption is violated. In the other hand, our financial factors fail to satisfy the univariate and multivariate normality assumptions. The violation of this assumption affects the classification and estimation process negatively. Therefore, the findings should be interpreted carefully.
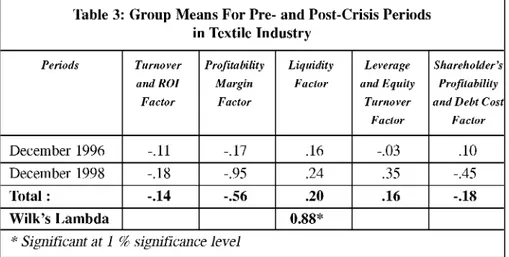
The comparison of the group means in pre- and post-crisis years is reported in Table 3. Turnover and ROI factor, profitability margins factor, and shareholder’s profitability declined in post crisis year, whereas liquidity and financial leverage & equity turnover factors increased in 1998. Another important finding is that all factors experience greater standard deviation in 1998, which may be due to global crisis.
Table 3: Group Means For Pre- and Post-Crisis Periods in Textile Industry Periods Turnover and R O I Factor Profitability Margin Factor Liquidity Factor Leverage and Equity Turnover Factor Shareholder’s Profitability and Debt Cost
Factor
December 1996 -.11 -.17 .16 -.03 .10
December 1998 -.18 -.95 .24 .35 -.45
Total : -.14 -.56 .20 .16 -.18
Wilk’s Lambda 0.88*
* Significant at 1 %> significance level
The stepwise discriminant analysis shows that only profitability margins factor is the discriminating variable between pre- and post-crisis years in the textile industry. Other factors are found to be statistically insignificant discriminating variable between pre- and post-crisis years for textile sector.
The practical significance of the discriminant function is assessed by the variance- explained by the discriminating variable. The correlation coefficient is .54 and CR2 value is % 34.9, that is, about % 34.9 of the variation between two groups is explained by the discriminating variable, which is the profitability margins factor. Table 4 reports the classification results for the cases selected for use in the analysis. Percent of correctly classified cases is % 64.06 that seems to be satisfactory. The analysis of the calculated Z scores for assessing practical significance shows that Z value for pre-crisis year is significant at % 5 significance level. However, Z value for 1998 year is 1.06 and not statistically significant. As predicted in the analysis of the research assumptions, this is largely due to the violation of the equality of the covariance matrices assumption, which negatively affects the classification process.
The Z value for assessing the practical significance of total correctly classified cases is 2.25 and significant at % 5 significance level.
Table 4: Classification Results of Discriminant Function for Textile Industry
Actual Group Number o f Cases Predicted Group Membership 1996 December 1998 December
1996 December 32 22 10
68.8 % 31.3 %
1998 December 32 13 19
40.6 % 59.4 %
Summarizing the results of the discriminant analysis of pre- and post-crisis years for textile industry, the textile companies experienced sharp decline in profitability margins in 1998. No discrimination is detected for other financial dimensions in pre- and post-crisis years.
5.2. Discriminant Analysis of Pre- and Post-crisis Years for Food Industry Food industry is likely affected in the same way as textile industry. However, food industry is more heterogeneous and this heterogeneity may blur the effects of the global crisis on the financial dimensions. In addition, food industry is more domestic-market oriented.
Evaluating assumptions, there is 9 to 1 ratio of observations to predictor variables, which meets the threshold of suggested minimum of is 5 observations to 1 predictor variable ratio. Regarding the adequacy of the sample size, it is 21 and lie within acceptable limits. As in the sample of the textile industry, the assumption of the equality of the covariance matrices and univariate normality assumptions are violated. It may affect the estimation and classification process.
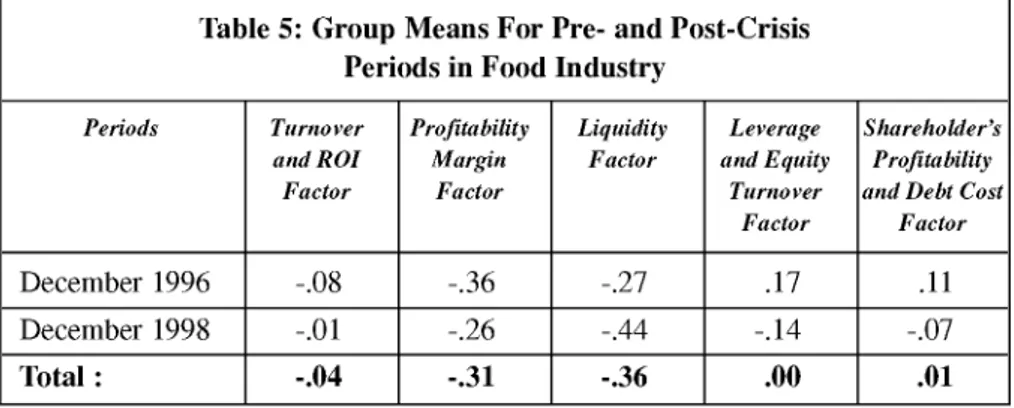
Table 5: Group Means For Pre- and Post-Crisis Periods in Food Industry
Periods Turnover and R O I Factor Profitability M argin Factor Liquidity Factor Leverage and Equity Turnover Factor Shareholder’s Profitability and Debt Cost
Factor
December 1996 -.08 -.36 -.27 .17 .11
December 1998 -.01 -.26 -.44 -.14 -.07
A lövsat Müslümov, Abdülm ecit Karata§ 102
The comparison of group means in Table 5 for pre- and post-crisis years shows that liquidity factor, financial leverage&equity turnover factor, shareholders’ profitability and debt cost factor declined in 1998. However, somewhat surprisingly the capital turnover & return on investment factor, and profitability margin factor increased. Another surprise is that standard deviations of all factors in 1998 have declined, thus, showing less dispersion around the mean.
The stepwise discriminant analysis didn’t retrieve statistically significant discriminant function. This implies that pre- and post-crisis years do not discriminate in terms of five the financial dimensions in the food industry.
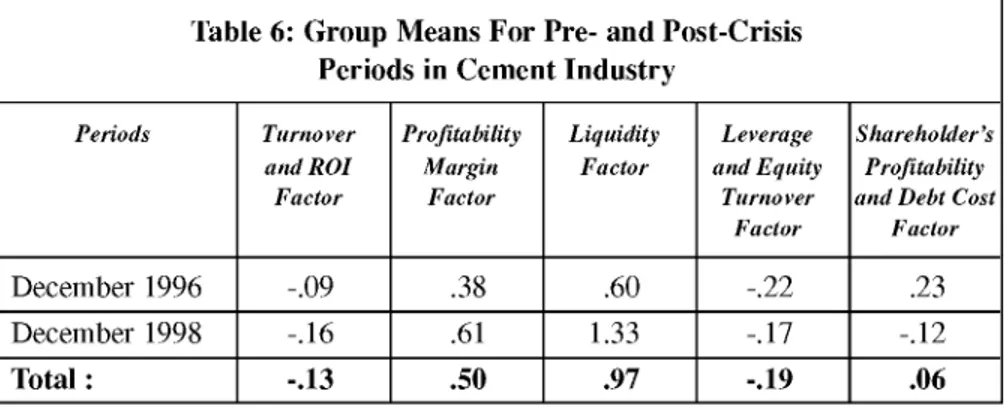
5.3. Discriminant Analysis of Pre- and Post-Crisis Years for Cement Industry Cement industry is the most domestic oriented industry among other two industries and produce homogeneous products. We do not predict any significant differences in terms of financial dimensions in this industry.
Since the sample size is small (11 cases in each period), our sample do not meet the adequacy of the sample size condition. There is 4 to 1 ratio of observations to predictor variables, which doesn’t fall within acceptable limits. Another main assumptions of the discriminant analysis, such as multivariate normality and equality of covariance matrices are violated by our sample. Therefore, we will not run significance tests, since the results of the study will be strongly biased.
Table 6 reports the comparison of the group means for pre- and post-crisis years in cement industry. It is seen liquidity factor, financial leverage & equity turnover factor, and shareholders’ profitability factors declined in post-crisis year. However, like food industry, there was increase in the capital turnover & return on investment, and profitability margin factor.
Table 6: Group Means For Pre- and Post-Crisis Periods in Cement Industry
Periods Turnover and R O I Factor Profitability Margin Factor Liquidity Factor Leverage and Equity Turnover Factor Shareholder’s Profitability and Debt Cost
Factor
December 1996 -.09 .38 .60 -.22 .23
December 1998 -.16 .61 1.33 -.17 -.12
VI. CONCLUSIONS AND DISCUSSION
Our study shows that profitability margin of export-oriented textile industry of Turkey declined in post-crisis years, however, no significant change in more domestic-oriented industries, such as food and cement industry is detected. This result suggests that the effects of the global crisis are rather felt through the weakened competitiveness power in international markets, which had down-pulling effects on prices hence the profitability margins. Since profitability margins and asset turnover decline, it is apparent that textile industry’s cash flows measured by return on assets variable also declined. The effects of the Asian Crisis have not been felt in Turkish manufacturing industries through contracting domestic demand and increasing real interest rates, since liquidity, leverage, equity profitability and turnover dimensions of sample industries haven’t significantly changed in post crisis year.
Further studies should focus on the causes of declining profitability margins of Turkish textile industry and compare the effects of the foreign crisis with the domestic one.
Acknowledgement
The authors thank to Prof. Özer Ertuna, Prof. Muzaffer Bodur of Bogazici University and Prof. Cudi T. Gürsoy of Dogus University for their helpful comments on this paper.
REFERENCES
CORSETTI, G., N. ROUBINI and P. PESENTI (1998). "Paper Tigers? A Model of the Asian Crisis?" Available on http://www.stern.nyu.edu/globalmacro/tiger04.pdf ROUBINI, N. (1998). "An Introduction to Open Economy Macroeconomics, Currency Crises and an Analysis of the Causes the Asian Crises", Available on
http://www.stern.nyu.edu/~nroubini/NOTES/intromacro.html
ROUBINI, N., G. CORSETTI and P. PESENTI (1998). "What Caused the Asian Currency and Financial Crisis?" Available on
http://www.stern.nyu.edu/globalmacro/AsianCrisis.pdfand http://www.stern.nyu.edu/ globalmacrofasiacri2.pdf
A lövsat Müslümov, Abdülm ecit Karataş 104
Appendix 1: Companies Included in the Analysis
Nr. Industry Company Nr. Industry Company
1. Textile Akal Tekstil 36. Food Apeks Dış Tic.
2. Textile Akın tekstil 37. Food Banvit
3. Textile Aksu İplik 38. Food Dardanel
4. Textile Altınyıldız Mensucat 39. Food Ege Biracılık
5. Textile Arat Tekstil 40. Food Erciyas Biracılık
6. Textile Berdan Tekstil 41. Food Frigo Pak Gıda
7. Textile Birlik Tekstil 42. Food Güney Biracılık
8. Textile Bisaş Tekstil 43. Food Kent Gıda
9. Textile Bossa Ticaret 44. Food Kerevitaş Gıda
10. Textile Boyasan Tekstil 45. Food Konfrut Gıda
11. Textile Ceylan Giyim 46. Food Kristal Kola
12. Textile Ceytaş Tekstil 47. Food Maret
13. Textile Derimod Konfeksiyon 48. Food Merko Gıda
14. Textile Edip İplik 49. Food Mudurnu Tavukçuluk
15. Textile Esem Giyim 50. Food Penguen Gıda
16. Textile Gediz İplik 51. Food Pınar Et
17. Textile Gümüşsuyu Halı 52. Food Pınar Su
18. Textile Karsu Tekstil 53. Food Pınar Süt
19. Textile Koniteks Tekstil 54. Food Pınar Un
20. Textile Kordsa Kord Bezi 55. Food Tat Konserve
21. Textile Köytaş Tekstil 56. Food T. Tuborg
22. Textile Lüks Kadife 57. Food Tukaş
23. Textile Mensa Mensucat 58. Food Ünal Tarım
24. Textile Okan Tekstil 59. Food Van Et
25. Textile Park Tekstil 60. Cement Afyon
26. Textile Söksa İplik 61. Cement Adana
27. Textile Sönmez Filament 62. Cement Akçansa
28. Textile Sönmez Pamuklu 63. Cement Aslan
29. Textile Ukim Konfeksiyon 64. Cement Bolu
30. Textile Vakko Giyim 65. Cement Çimsa
31. Textile Yataş 66. Cement Göltaş
32. Textile Yünsa 67. Cement Konya
33. Textile Sifaş 68. Cement Niğde
34. Food Anadolu Biracılık 69. Cement Mardin