Tp-e/QT ratio and QT dispersion with respect to blood
pressure dipping pattern in prehypertension
Asli Tanindi
a, Aslihan Alhan
band Hasan Fehmi Tore
aIntroduction Tp-e/QT, the ratio of the interval between the peak and the end of T wave to the QT interval, is a novel index of arrhythmogenesis. We investigate Tp-e/QT and QT dispersion (QTd) in prehypertensive and normotensive patients with different patterns of nocturnal blood pressure dipping.
Patients and methods Forty-seven prehypertensive and 37 normotensive adult patients were included. Ambulatory blood pressure monitoring recording was performed and patients were considered to be dipper if nocturnal blood pressure fall was at least 10%; nondipper if it was 0–10%; and reverse-dipper if less than 0%. Tp-e, QT intervals were assessed by 12-lead ECG and Tp-e/QT was calculated using these measurements. QTd is defined as the difference between the maximum and the minimum QT interval of the 12 leads.
Results Tp-e/QT was 0.22 ± 0.02 and 0.16 ± 0.01 in prehypertensives and normotensives, respectively (P < 0.001), whereas cQTd was 36.1 ± 6.8 and 27.2 ± 5.2 ms (P < 0.001). Tp-e and Tp-e/QT were the lowest in the dippers and the highest in the reverse-dippers in the prehypertensive group (Tp-e/QT dipper: 0.21 ± 0.01;
nondipper: 0.24 ± 0.02; reverse-dipper: 0.25 ± 0.01; for dipper–nondipper, and dipper–reverse-dipper P < 0.05). However, in the normotensive group, dipping status had no effect on Tp-e/QT. There were no significant differences between dippers, nondippers, and reverse-dippers in terms of cQTd both in prehypertensives and in normotensives. There were no associations between left ventricular mass index and Tp-e, Tp-e/QT, and cQTd in both groups. Conclusion Tp-e, Tp-e/QT, and cQTd are increased in prehypertensives compared with normotensives. Tp-e and Tp-e/QT are associated with the dipping status in
prehypertensives. Blood Press Monit 20:69–73 Copyright © 2015 Wolters Kluwer Health, Inc. All rights reserved.
Blood Pressure Monitoring2015, 20:69–73
Keywords: dipping status, prehypertension, QT dispersion, Tp-e, Tp-e/QT
aDepartment of Cardiology, Ufuk University Faculty of Medicine andbDepartment
of Statistics, Ufuk University Faculty of Arts and Sciences, Ankara, Turkey Correspondence to Aslı Tanındı, MD, Department of Cardiology, Ufuk University Faculty of Medicine, Mevlana, Bulvarı, No: 86-88, 06500 Balgat, Ankara, Turkey Tel: + 90 312 2044082; fax: + 90 312 2044055; e-mail: [email protected] Received15 July 2014 Revised 27 August 2014 Accepted 16 September 2014
Introduction
Prehypertension is defined as systolic blood pressure (BP) of 120–139 mmHg and a diastolic BP of 80–89 mmHg [1]. It is recognized as a risk factor for development of overt hypertension and its consequences [2] as well as being associated with cardiovascular mor-bidity and mortality [3]. The prevalence of pre-hypertension is incontrovertible worldwide; it is reported to be 31% in the USA [4] and 14.5% in our country [5]. Circadian rhythm normally causes a fall in BP in the night time. ‘Dipper’ is the term to define 10% or more noc-turnal BP fall, whereas the reverse is called‘nondipper’. The nondipper BP pattern is known to be associated with worse cardiovascular outcome and end-organ damage [6,7].
Myocardial repolarization has been evaluated in hyper-tensive patients in various studies, which highlighted that hypertension is associated with prolonged QT intervals and QT dispersion (QTd) [8,9]. Although data on myo-cardial repolarization in prehypertension are very limited, QT intervals and dispersion were reported to be pro-longed in a prehypertensive state independent of left ventricular mass (LVM) [10].
Recently, Tp-e/QT, which is the ratio of the interval between the peak and the end of T wave to the QT interval, was introduced as a novel index of arrhythmo-genesis providing an estimate of dispersion of repolar-ization relative to the total duration of repolarrepolar-ization [11]. It eliminates the confounding effects of variability of heart rate and interindividual variation of the QT interval [11].
We aimed to investigate Tp-e/QT in addition to QTd in prehypertensive and normotensive patients with differ-ent patterns of nocturnal BP dipping.
Patients and methods
Prehypertensive or normotensive adult patients who were admitted to the cardiology outpatient clinic for a general cardiovascular check-up were included. Exclusion criteria were typical chest pain, established coronary artery disease, diabetes mellitus or impaired fasting glucose, hypertension defined as BP more than 140/90 in the outpatient physical examination or anti-hypertensive drug use, rhythm other than sinus, U waves or negative T waves on ECG, moderate to severe valv-ular disease, hyper/hypothyroidism, any chronic disease, and refusal to provide written informed consent.
four patients (47 prehypertensive and 37 normotensive) who were eligible according to the above-mentioned inclusion and exclusion criteria were enrolled.
Office BP measurements were performed in the sitting position after 5 min of resting using the nondominant arm. BP was calculated as the average of two consecutive BP measurements taken at least 10 min apart by a physician using a mercury sphygmomanometer. Patients were re-evaluated 2 weeks after the first visit and BP measure-ments were repeated by the same physician at the second visit before enrollment into the study. Data were col-lected between March 2013 and February 2014. This study was carried out according to the recommendations of the Declaration of Helsinki on biomedical research and it was approved by the institutional ethics committee. Ambulatory blood pressure monitoring (ABPM) was per-formed using Cardiospy EC-3H/ABP recorder (Labtech Ltd, Debrecen, Hungary). Each recording began in the morning between 08:00 and 09:00 a.m. Participants were asked to continue their regular activities during the recordings. Day-time was defined as 06:00 a.m.–22:00 p.m. and night time was defined as 22:00 p.m.–06:00 a.m. BP recordings were taken every 15 min throughout the day-time and every 30 min at night. Patients were considered to be dippers if nocturnal BP fall was at least 10%; nondippers if it was 0–10%; and reverse-dippers if less than 0%. The percentage of nocturnal BP variation was calculated using the following formula: 100× [1 − (average night SBP/ average day SBP)]. ABPM recordings excluded‘white-coat hypertension’ in the prehypertensive group.
The 12-lead ECG was recorded (KardioPET 600; PETAS, Ankara, Turkey) at a paper speed of 50 mm/s and amplification of 0.1 mV/mm at rest in the supine position. The QT interval was assessed as the time between the first deflection of the QRS complex and the end of the T wave. The slope intercept technique was used to determine the end of the T wave, which is identified as the intercept of the line tangential to the point of maximum T wave down-slope with the iso-electric line [12]. The QT interval was measured in as many 12 leads as possible. Corrected QT (QTc) values were calculated using Bazett’s formula: QTc: QT/√R − R. The Tp-e interval was measured in the precordial leads [13]. The Tp-e/QT ratio was calculated using these measurements. QTd is defined as the dif-ference between the maximum and the minimum QT interval of the 12 leads. All measurements were per-formed by two separate cardiologists to avoid error. Echocardiographic measurements were performed using a VIVID 7 ultrasound (VIVID 7 Pro; GE, Horten, Norway) with a 2.5–3.5 MHz transducer. Parasternal and apical projections were obtained according to the recommen-dations of the American Society of Echocardiography [14].
Statistical analysis
The SPSS statistical software (SPSS Statistics for Windows, Version 21.0; IBM, Armonk, New York, USA) was used for all statistical calculations. The Kolmogorov–Smirnov test was used to test for a normal distribution. Continuous variables were defined as mean± SD and categorical vari-ables were defined as percentages. Continuous varivari-ables were compared by analysis of variance. The χ2-test was used for the categorical variables between two groups. Pearson’s correlation coefficients were calculated for the correlation between left ventricular mass index (LVMI) and Tp-e, Tp-e/QT, and cQTd. All tests of significance were two-tailed. Statistical significance was defined as P less than 0.05.
Results
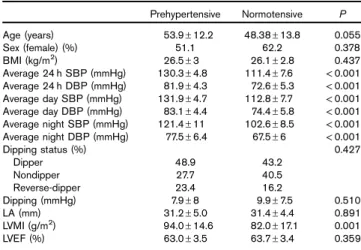
The baseline characteristics of the study population are provided in Table 1. There were no differences with respect to age, sex, or BMI. Percentage of dippers, nondippers, and reverse-dippers or the extent of nocturnal BP fall were also similar. Left atrial diameter or left ventricular ejection frac-tion were similar, but LVMI was higher in prehypertensive patients (mean LVMI 94.0± 14.6 vs. 82.0 ± 17.1 g/m2, P = 0.001). Table 2 shows the ECG measures in pre-hypertensive and normotensive patients. The mean cQTd was significantly higher in the prehypertensive group than the normotensives (36.1± 6.8 vs. 27.2 ± 5.2 ms, P < 0.001). Tp-e was significantly longer and Tp-e/QT was higher in the prehypertensive group (mean Tp-e: 93.1± 7.6 vs. 67.9± 8.1 ms, P < 0.001; mean Tp-e/QT: 0.22 ± 0.02 vs. 0.16± 0.01, P < 0.001) (Table 2).
Prehypertensive and normotensive patients were further analyzed with respect to their dipping status (Table 3). Tp-e and Tp-e/QT were significantly lower in the dip-pers compared with nondipdip-pers and reverse-dipdip-pers in
Table 1 Baseline characteristics of the study population
Prehypertensive Normotensive P Age (years) 53.9± 12.2 48.38± 13.8 0.055 Sex (female) (%) 51.1 62.2 0.378 BMI (kg/m2) 26.5± 3 26.1± 2.8 0.437 Average 24 h SBP (mmHg) 130.3± 4.8 111.4± 7.6 < 0.001 Average 24 h DBP (mmHg) 81.9± 4.3 72.6± 5.3 < 0.001 Average day SBP (mmHg) 131.9± 4.7 112.8± 7.7 < 0.001 Average day DBP (mmHg) 83.1± 4.4 74.4± 5.8 < 0.001 Average night SBP (mmHg) 121.4± 11 102.6± 8.5 < 0.001 Average night DBP (mmHg) 77.5± 6.4 67.5± 6 < 0.001 Dipping status (%) 0.427 Dipper 48.9 43.2 Nondipper 27.7 40.5 Reverse-dipper 23.4 16.2 Dipping (mmHg) 7.9± 8 9.9± 7.5 0.510 LA (mm) 31.2± 5.0 31.4± 4.4 0.891 LVMI (g/m2) 94.0± 14.6 82.0± 17.1 0.001 LVEF (%) 63.0± 3.5 63.7± 3.4 0.359 DBP, diastolic blood pressure; LA, left atrium; LVEF, left ventricular ejection fraction; LVMI, left ventricular mass index; SBP, systolic blood pressure. P< 0.05 is considered significant.
the prehypertensive group (Tp-e: 87.3± 4.1; 95.8 ± 4.7; 102.1± 5.0 ms in dippers, nondippers, and reverse-dippers, respectively, P < 0.001 and Tp-e/QT: 0.21 ± 0.01; 0.24± 0.02; 0.25 ± 0.01 in dippers, nondippers, and reverse-dippers, respectively,P < 0.001). However, there were no significant differences in terms of Tp-e and Tp-e/QT between dippers, nondippers, or reverse-dippers in the normotensive group (Tp-e: 67.5± 7.3; 68.4± 7.7; 67.5 ± 11.9 ms in dippers, nondippers, and reverse-dippers, respectively, P = 0.949 and Tp-e/QT: 0.16± 0.02; 0.16 ± 0.02; 0.16 ± 0.01 in dippers, nondippers, and reverse-dippers, respectively,P = 0.891).
Although the mean cQTd was higher in prehypertensives than normotensives, there were no significant differences between dippers, nondippers, or reverse-dippers both in prehypertensive and in normotensive patients.
It was searched whether there were any associations between LVMI and electrocardiographic indices of myocardial repolarization. Table 4 shows Pearson’s cor-relation coefficients for the associations between LVMI and Tp-e, Tp-e/QT, and cQTd both in prehypertensive and in normotensive groups. It was shown that there were no significant correlations between LVMI and the above-mentioned indices.
Discussion
In this study, it was shown that prehypertensive individuals have longer Tp-e, higher Tp-e/QT, and longer cQTd than normotensives. In addition, in prehypertensives, Tp-e and Tp-e/QT were significantly augmented in nondippers and reverse-dippers than dippers. However, cQTd was similar in prehypertensive dippers, nondippers, and reverse-dippers despite being longer compared with normotensives. Inhomogeneity of ventricular repolarization and aug-mentation of ventricular repolarization dispersion are associated with malignant arrhythmias and has prognostic importance in terms of mortality and sudden cardiac death [15,16].
Although there are studies that highlight increased QTd in hypertension especially in the presence of left ventricular hypertrophy and increased LVM [17], data on arrhythmo-genic potential in prehypertensive patients are limited. Doğru et al. [10] reported that QTd was prolonged in prehypertensives compared with normotensives and these changes were independent of LVM. However, another study on black Nigerian prehypertensive individuals found that prehypertensives had similar QTd compared with
Table 2 ECG parameters in prehypertensive and normotensive patients Prehypertensive Normotensive P HR (bpm) 83.3± 14.3 88.9± 16.2 0.096 cQT max (ms) 434.9± 29.2 429.8± 42.0 0.536 cQT min (ms) 397.9± 28.9 402.6± 40.5 0.532 cQT dispersion (ms) 36.1± 6.8 27.2± 5.2 < 0.001 Tp-e (ms) 93.1± 7.6 67.9± 8.1 < 0.001 Tp-e/QT 0.22± 0.02 0.16± 0.01 < 0.001 HR, heart rate; max, maximum; min, minimum.
P< 0.05 is considered statistically significant.
Table 3 Demographic, hemodynamic, and ECG findings of the prehypertensive and normotensive patients given separately for dippers, nondippers, and reverse-dippers
Prehypertensive Normotensive Dipper (N= 23) Nondipper (N= 13) Reverse-dipper(N= 11) P Dipper (N= 16) Nondipper (N= 15) Reverse-dipper (N= 6) P Age (years) 50± 12.9 55.5± 8.6 60.3± 11.9 0.056 48.2± 12.5 47.9± 14.1 50.2± 18.4 0.943 Sex (female) (%) 52.2 61.5 36.4 0.465 50 80 50 0.182 BMI (kg/m2) 22.6± 2.4 25.8± 3.4 26.5± 2.0 0.882 26.1± 2.4 25.8± 3.4 26.5± 2.0 0.882 Dipping (mmHg) 14.6± 3.9 5.4± 3.4 − 2.7 ± 2.6 < 0.001a 15.9± 4.4 6.1± 2.3 − 2.0 ± 2.0 < 0.001a HR (bpm) 82.3± 16.2 85.3± 11.0 82.9± 14.5 0.835 87.2± 18.4 93.0± 15.7 83.2± 8.8 0.398 cQT max (ms) 436.0± 33.0 433.2± 27.7 434.6± 24.3 0.963 432.6± 42.6 426.7± 40.6 430.2± 50.6 0.929 cQT min (ms) 400.5± 32.5 397.8± 24.6 392.7± 27.3 0.772 405.5± 42.4 399.5± 37.4 402.7± 49.2 0.923 cQT dispersion (ms) 35.5± 8.0 35.4± 6.2 38.2± 4.6 0.518 27.1± 4.6 27.1± 6.4 27.5± 4.1 0.988 Tp-e (ms) 87.3± 4.1 95.8± 4.7 102.1± 5.0 < 0.001a 67.5± 7.3 68.4± 7.7 67.5± 11.9 0.949 Tp-e/QT 0.21± 0.01 0.24± 0.02 0.25± 0.01 < 0.001b 0.16± 0.02 0.16± 0.02 0.16± 0.01 0.891 LVMI (g/m2) 91.4± 14.7 96.4± 13.5 96.5± 16.1 0.510 80.3± 17.6 77.9± 16.6 96.8± 9.8 0.060 HR, heart rate; LVMI, left ventricular mass index; max, maximum; min, minimum.
aSignificant difference between dipper–nondipper, dipper–reverse-dipper, and nondipper–reverse-dipper. bSignificant difference between dipper–nondipper and dipper–reverse-dipper.
P< 0.05 is considered significant.
Table 4 Pearson’s correlation coefficients for the association between LVMI and Tp-e, Tp-e/QT, and cQT dispersion
r P Prehypertensive LVMI Tp-e 0.099 0.509 Tp-e/QT − 0.008 0.960 cQT dispersion 0.378 0.09 Normotensive LVMI Tp-e 0.145 0.392 Tp-e/QT − 0.170 0.315 cQT dispersion − 0.122 0.471 LVMI, left ventricular mass index.
normotensives [18], although their study participants had far higher LVMI than the participants in the study by Doğru et al. [10] and the participants of our study. Tp-e and Tp-e/QT are recently introduced indices of arrhythmogenesis [11]. The Tp-e interval has been shown to be well correlated with transmural repolariza-tion dispersion [19]. As Tp-e/QT is an estimate of dis-persion of repolarization relative to the total duration of repolarization, it places the confounding effect of heart rate aside [11]. Two studies on ST-elevation myocardial infarction (STEMI) patients showed that a higher Tp-e/ QT ratio was associated with death, cardiac death, major adverse cardiac events [20], and malignant ventricular arrhythmias [21]. Erikssenet al. [22] reported that Tp-e was a strong predictor of mortality during the first year after acute myocardial infarction and it was also strongly associated with fatal cardiac arrhythmias. Demiri et al. [23] found that the Tp-e/QT ratio was correlated with increased frequency of arrhythmic events and shock therapy administered to ventricular arrhythmias in heart failure patients who had implantable cardioverter defi-brillators [23].
Although there is no clear-cut normal range for Tp-e/QT, Gupta et al. [11] defined a range of 0.15–0.25 in normal healthy individuals. In patients with LQTS, a ratio of more than 0.28 was associated with a risk of torsades de pointes [24]. Demiriet al. [23] proposed a cut-off value of more than 0.25 in heart failure patients with ICD, and Zhaoet al. [20] proposed more than 0.29 in patients with STEMI undergoing PCI. Taking these ranges or cut-off values into consideration, the values we report in pre-hypertensives remain in the normal range despite being higher compared with normotensives.
Demir and Uyan [25] have recently shown that QTd, Tp-e, and Tp-e/QT are prolonged in nondipper hypertensives compared with dipper hypertensives. Karaagac et al. [26] have reported that Tp-e, Tp-e/QT, and Tp-e/QTc were higher in nondipper hypertensives with metabolic syndrome than dippers. To our knowledge, there is no study on Tp-e/ QT and dipping status in the literature carried out on pre-hypertensive patients. This study shows that inhomogeneity in ventricular repolarization may occur in the pre-hypertensive stage, and in addition, non-dipping (and/or reverse dipping) status in prehypertensive patients is asso-ciated with further prolongation in Tp-e and Tp-e/QT ratio. A nondipper BP pattern is associated with higher cardio-vascular risk as reported elsewhere [6,7]. Left ventricular hypertrophy, left ventricular diastolic dysfunction, autonomic nervous system dysfunction, and increased inflammatory activity play a role in the increase in cardiovascular mortality and morbidity in nondippers [26]. Activation of the sympa-thetic nervous system and the renin–angiotensin–aldosterone system may induce atrial and ventricular fibrosis and cause cellular electrophysiological alterations [27] that may con-tribute toward impaired electrocardiographic indices of
ventricular repolarization in nondipper and reverse-dipper prehypertensives compared with dippers.
Myocardial hypertrophy in hypertension is known to be associated with prolonged QT maximal duration and QTd [28] that may cause malignant arrhythmias. We have not detected prolonged QT duration, although QTd was prolonged. However, in this study, prehypertensive patients had normal LVMI, although higher than nor-motensives. We may tentatively conclude that in pre-hypertension, electrophysiologic alterations precede anatomical changes.
In the literature, there are studies that report normal QT durations and QTd in the presence of myocardial hypertrophy in the athlete’s heart [29,30]. This means that the underlying pathology such as autonomic nervous system dysfunction or renin angiotensin system activa-tion [31] may lead to the prolongaactiva-tion of QT duraactiva-tion rather than increased myocardial mass. These studies are supportive of our thesis that electrophysiologic alterations may be responsible from QT alterations rather than anatomical change in LVM. To further clarify this, we also searched for the associations between LVMI and Tp-e, Tp-e/QT, and QTd, and we found no significant correlation. Of course, it should be kept in mind that although prehypertensive patients had higher mean LVMI compared with normotensives, they were in the normal range or mildly higher than normal in the present study.
One of the limitations of the study was the relatively small number of participants. Another point is the cross-sectional design, which precludes inference of causality. Long-term prospective studies are needed if a prolonged Tp-e interval and a higher Tp-e/QT ratio observed in prehypertensive and especially nondipper and reverse-dipper prehypertensive patients compared with normo-tensives lead to any clinical consequences in terms of arrhythmia.
Conclusion
Novel indices of myocardial repolarization, e and Tp-e/QT ratio, are increased in prehypertensives compared with normotensives. This increase is more evident in nondipper and reverse-dipper prehypertensives than dippers. Prospective studies are needed to clarify whe-ther these findings will be associated with an increased risk of arrhythmia.
Acknowledgements
Conflicts of interest
There are no conflicts of interest.
References
1 Guo X, Zhang X, Zheng L, Guo L, Li Z, Yu S, et al. Prehypertension is not associated with all-cause mortality: a systematic review and meta-analysis of prospective studies. PLoS One 2013; 8:e61796.
2 Egan BM, Lackland DT, Jones DW. Prehypertension: an opportunity for a new public health paradigm. Cardiol Clin 2010; 28:561–569. 3 Vasan RS, Larson MG, Leip EP, Evans JC, O’Donnell CJ, Kannel WB,
Levy D. Impact of high-normal blood pressure on the risk of cardiovascular disease. N Engl J Med 2001; 345:1291–1297.
4 Wang Y, Wang QJ. The prevalence of prehypertension and hypertension among US adults according to the new joint national committee guidelines: new challenges of the old problem. Arch Intern Med 2004; 164:2126–2134. 5 Erem C, Hacihasanoglu A, Kocak M, Deger O, Topbas M. Prevalence of
prehypertension and hypertension and associated risk factors among Turkish adults: Trabzon Hypertension Study. J Public Health (Oxf) 2009; 31:47–58. 6 Ohkubo T, Hozawa A, Yamaguchi J, Kikuya M, Ohmori K, Michimata M, et al.
Prognostic significance of the nocturnal decline in blood pressure in individuals with and without high 24-h blood pressure: the Ohasama study. J Hypertens 2002; 20:2183–2189.
7 Seo HS, Kang TS, Park S, Choi EY, Ko YG, Choi D, et al. Non-dippers are associated with adverse cardiac remodeling and dysfunction (R1). Int J Cardiol 2006; 112:171–177.
8 Barison A, Vergaro G, Pastormerlo LE, Ghiadoni L, Emdin M, Passino C. Markers of arrhythmogenic risk in hypertensive subjects. Curr Pharm Des 2011; 17:3062–3073.
9 Mozos I, Serban C. The relation between QT interval and T-wave variables in hypertensive patients. J Pharm Bioallied Sci 2011; 3:339–344.
10 Doğru MT, Güneri M, Tireli E, Sahin O, Celik T, Iyisoy A. QT interval and dispersion differences between normal and prehypertensive patients: effects of autonomic and left ventricular functional and structural changes. Anadolu Kardiyol Derg 2009; 9:15–22.
11 Gupta P, Patel C, Patel H, Narayanaswamy S, Malhotra B, Green JT, Yan GX. T(p-e)/QT ratio as an index of arrhythmogenesis. J Electrocardiol 2008; 41:567–574.
12 Batchvarov V, Malik M. Measurement and interpretation of QT dispersion. Prog Cardiovasc Dis 2000; 42:325–344.
13 Castro Hevia J, Antzelevitch C, Tornés Bárzaga F, Dorantes Sánchez M, Dorticós Balea F, Zayas Molina R, et al. Tpeak-Tend and Tpeak-Tend dispersion as risk factors for ventricular tachycardia/ventricular fibrillation in patients with the Brugada syndrome. J Am Coll Cardiol 2006;
47:1828–1834.
14 Schiller NB, Shah PM, Crawford M, DeMaria A, Devereux R, Feigenbaum H, et al. Recommendations for quantitation of the left ventricle by two-dimensional echocardiography. American Society of Echocardiography Committee on Standards, Subcommittee on Quantitation of Two-Dimensional Echocardiograms. J Am Soc Echocardiogr 1989; 2:358–367. 15 Dimopoulos S, Nicosia F, Turini D, Zulli R. Prognostic evaluation of
QT-dispersion in elderly hypertensive and normotensive patients. Pacing Clin Electrophysiol 2009; 32:1381–1387.
16 de Bruyne MC, Hoes AW, Kors JA, Hofman A, van Bemmel JH, Grobbee DE. QTc dispersion predicts cardiac mortality in the elderly: the Rotterdam Study. Circulation 1998; 97:467–472.
17 Antonakis V, Tsioufis C, Tsiachris D, Andrikou I, Fantaki M, Dagres N, et al. Associations of hemodynamic load and ventricular repolarization in patients
with newly diagnosed essential hypertension: a long-term follow-up study. J Clin Hypertens (Greenwich) 2014; 16:219–224.
18 Ale OK, Ajuluchukwu JN, Ok DA, Mbakwem AC. Impact of prehypertension on left ventricular mass and QT dispersion in adult black Nigerians. Cardiovasc J Afr 2014; 25:78–82.
19 Yan GX, Martin J. Electrocardiographic T wave: a symbol of transmural dispersion of repolarization in the ventricles. J Cardiovasc Electrophysiol 2003; 14:639–640.
20 Zhao X, Xie Z, Chu Y, Yang L, Xu W, Yang X, et al. Association between Tp-e/QT ratio and prognosis in patients undergoing primary percutaneous coronary intervention for ST-segment elevation myocardial infarction. Clin Cardiol 2012; 35:559–564.
21 Shu J, Li H, Yan G, Cui C. Tp-e/QT ratio as a predictive index of sudden cardiac death in patients with ST-segment elevation myocardial infarction. J Xi’an Jiaotong Univ Med Sci 2010; 31:441–443.
22 Erikssen G, Liestøl K, Gullestad L, Haugaa KH, Bendz B, Amlie JP. The terminal part of the QT interval (T peak to T end): a predictor of mortality after acute myocardial infarction. Ann Noninvasive Electrocardiol 2012; 17:85–94.
23 Demiri E, Karakulak UN, Tahir A, Ulgen A, Kaya EB, Kabakci G, et al. Association between Tp-e/QTc ratio, arrhythmic events and frequency of appropriate shock therapy in heart failure patients who have implantable cardioverter defibrillator. OP-089; 9th International Congess of Update in Cardiology and Cardiovascular Surgery, Oral presentations. Int J Cardiol 2013; 163 (S1):35.
24 Yamaguchi M, Shimizu M, Ino H, Terai H, Uchiyama K, Oe K, et al. T wave peak-to-end interval and QT dispersion in acquired long QT syndrome: a new index for arrhythmogenicity. Clin Sci (Lond) 2003; 105:671–676. 25 Demir M, Uyan U. Evaluation of Tp-e interval and Tp-e/QT ratio in patients
with non-dipper hypertension. Clin Exp Hypertens 2014; 36:285–288. 26 Karaagac K, Tenekecioglu E, Yontar OC, Kuzeytemiz M, Vatansever F,
Tutuncu A, et al. Effect of non-dipper and dipper blood pressure patterns on Tp-Te interval and Tp-Te/QT ratio in patients with metabolic syndrome. Int J Clin Exp Med 2014; 7:1397–1403.
27 Pierdomenico SD, Lapenna D, Cuccurullo F. Risk of atrial fibrillation in dipper and nondipper sustained hypertensive patients. Blood Press Monit 2008; 13:193–197.
28 Kahan T, Bergfeldt L. Left ventricular hypertrophy in hypertension: its arrhythmogenic potential. Heart 2005; 91:250–256.
29 Lonati LM, Magnaghi G, Bizzi C, Leonetti G. Patterns of QT dispersion in athletic and hypertensive left ventricular hypertrophy. Ann Noninvasive Electrocardiol 2004; 9:252–256.
30 Mayet J, Kanagaratnam P, Shahi M, Senior R, Doherty M, Poulter NR, et al. QT dispersion in athletic left ventricular hypertrophy. Am Heart J 1999; 137 (Pt 1):678–681.
31 Miyajima K, Minatoguchi S, Ito Y, Hukunishi M, Matsuno Y, Kakami M, et al. Reduction of QTc dispersion by the angiotensin II receptor blocker valsartan may be related to its anti-oxidative stress effect in patients with essential hypertension. Hypertens res 2007; 30:307–313.