Infrared photoluminescence from TlGaS
2layered single crystals
N. S. Yuksek1, N. M. Gasanly*1, A. Aydinli2, H. Ozkan1, and M. Acikgoz1 1 Physics Department, Middle East Technical University, 06531 Ankara, Turkey 2 Physics Department, Bilkent University, 06533 Ankara, Turkey
Received 22 December 2003, accepted 4 February 2004 Published online 1 August 2004
Key words photoluminescence, semiconductors, layered crystals, defect levels, TlGaS2.
PACS 71.20.-b, 71.20.Nr, 78.20.-e, 78.55.-m
Photolimuniscence (PL) spectra of TlGaS2 layered crystals were studied in the wavelength region 500-1400 nm and in the temperature range 15-115 K. We observed three broad bands centered at 568 nm (A-band), 718 nm (B-band) and 1102 nm (C-band) in the PL spectrum. The observed bands have half-widths of 0.221, 0.258 and 0.067 eV for A-, B-, and C-bands, respectively. The increase of the emission band half-width, the blue shift of the emission band peak energy and the quenching of the PL with increasing temperature are explained using the configuration coordinate model. We have also studied the variations of emission band intensity versus excitation laser intensity in the range from 0.4 to 19.5 W cm-2. The proposed energy-level diagram allows us to interpret the recombination processes in TlGaS2 crystals.
© 2004 WILEY-VCH Verlag GmbH & Co. KGaA, Weinheim
1 Introduction
In recent years, the III-III-VI2 family layer-structured thallium chalcogenides such as TlBX2 , where B = Ga or In and X = S or Se, have been studied extensively [1]. At room temperature, these thallium chalcogenides belong to the monoclinic system, and their space group is C2/c. The lattice of these crystals consists of alternating two-dimensional layers arranged parallel to the (001) plane. Each successive layer is rotated by a 90° angle with respect to the previous layer.
TlGaS2 , a member of this family of crystals, is a semiconductor with indirect band gap of about 2.46 and 2.55 eV at 300 and 10 K, respectively [2]. In view of its possible applications in optoelectronic devices, a great deal attention has been devoted to study the optical and electrical properties of TlGaS2 [2-7]. In this regard, detailed information on the impurity levels is very useful for the fabrication of high-quality devices. Song et al. [6] have investigated the impurity levels of TlGaS2 crystals in the temperature range 90-350 K by thermally stimulated current (TSC) and photo-induced current transient spectroscopy techniques. The activation energies of the observed four peaks were found to be 0.18, 0.23, 0.36 and 0.66 eV. Recently we have studied the shallow levels of TlGaS2 crystal in the low-temperature range of 10-60 K by TSC method and observed three trap levels with activation energies 0.006, 0.012 and 0.026 eV [8]. Long-wave optical phonons in TlGaS2 crystals were investigated by infrared reflection and Raman scattering experiments [7, 9].
In the present paper, we report the results of the PL investigation of TlGaS2 single crystals in the 500-1400 nm wavelength and in the 15-115 K temperature range. The shift of the emission band peak energy as well as the change of the half-width of the emission band with temperature and excitation laser intensity was also studied. The observed results were analyzed using the configurational coordinate (CC) model.
____________________
2 Experimental
TlGaS2 polycrystals were synthesized from high-purity elements (at least 99.999% pure) prepared in stoichiometric proportions. Single crystals of TlGaS2 were grown by the modified Bridgman method. The analysis of X-ray diffraction data showed that, TlGaS2 crystallizes in a monoclinic unit cell with lattice parameters: a = 1.031, b = 1.043 and c = 1.507 nm, and β = 99.60°. The samples were prepared by cleaving an ingot parallel to the crystal layer, which was perpendicular to the c-axis, with typical sample dimensions of 8 × 4 × 2 mm3. The electrical conductivity of the samples was p-type as determined by the hot probe method. A "Spectra-Physics" argon ion laser operating at a wavelength 476.5 nm was used as the excitation source. The PL was observed from the laser illuminated face of the samples, in a direction close to the normal of the (001) plane. A "CTI-Cryogenics M-22" closed-cycle helium cryostat was used to cool the crystals from room temperature down to 15 K. The temperature was controlled within an accuracy of 0.5 K. The PL spectra in the 500-860 nm wavelength range were analyzed using a "U-1000 Jobin-Yvon" double grating spectrometer and a cooled GaAs photomultiplier equipped with the necessary photon counting electronics. The PL spectra in the 600-1400 nm wavelength range were obtained by means of "CVI Digikrom DK-480" monochromator and Hamamatsu TE cooled InGaAs infrared detector. A set of neutral-density filters was used to adjust the excitation laser intensity from 0.4 to 19.5 W cm-2.
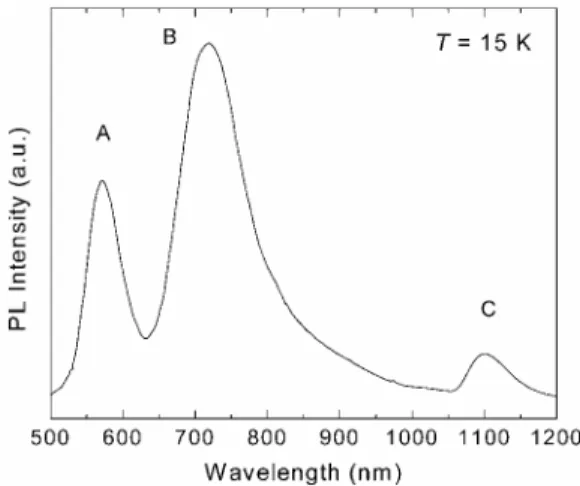
Fig. 1 PL spectrum of TlGaS2 crystal in the 500-1200 nm wavelength range at T = 15 K. Excitation laser intensity L = 19.5 W cm-2.
3 Results and discussion
Figure 1 shows the PL spectrum of the TlGaS2 crystal measured at T = 15 K and excitation laser intensity of 19.5 W cm-2 in the 500-1200 nm wavelength range. We observed three broad bands with an asymmetric Gaussian line shapes centered at 568 nm (2.183 eV, A-band), 718 nm (1.727 eV, B-band) and 1102 nm (1.125 eV, C-band) in the PL spectrum. The observed bands have half-widths of 0.221, 0.258 and 0.067 eV for A- , B- and C-bands, respectively. The emission bands intensity, half-width and peak position changed with temperature. These features are typical of the emission bands due to donor-acceptor pair transitions observed in ternary semiconductors [10].
In our previous paper [11] we presented the results of detailed analysis of the A- and B-bands behavior in the PL spectra of TlGaS2 crystals with respect to the temperature and excitation intensity. It was shown that in the temperature range of 10-90 K, the intensity of the A-band decreases, while the intensity of the B-band increases. For T > 90 K, when the A-band becomes very weak, the intensity of the B-band decreases drastically as the temperature increases. The activation energies ∆EA = 0.005 eV and ∆EB = 0.085 eV for A- and B-bands, respectively, have been obtained from semilog plots of PL intensities as a function of reciprocal temperature. The A- and B-bands were found to be due to the radiative transitions from the deep donor levels at 0.362 eV (d1) and 0.738 eV (d2) below the conduction band to the shallow acceptor levels at 0.005 eV (a1) and 0.085 eV
(a2) above the valence band, respectively. The presence of two acceptor levels allowed to explain the thermal quenching behavior of A- and B-bands in PL spectra of TlGaS2 crystal, where the intensity of the B-band increases in the temperature range (10-90 K) for which the quenching of the A-band is observed. Quenching of the A-band may be associated with the thermal release of holes from the acceptor level a1 to the valence band. The thermally released holes are then captured by the acceptor level a2 . Finally, this results in the increase of the intensity of the B-band in the same temperature range where quenching of the A-band occurs.
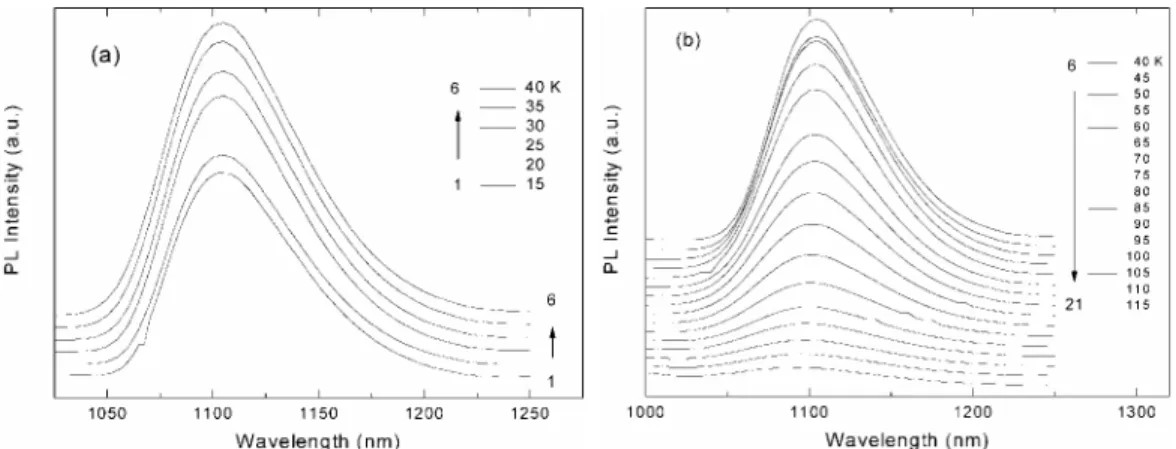
Fig. 2 PL spectra of TlGaS2 crystal in the 15-115 K temperature range and 1000-1250 nm wavelength
region. Excitation laser intensity L = 19.5 W cm-2.
Figure 2 shows the PL spectra of the TlGaS2 crystal (C-band) measured in the 1000-1250 nm near-infrared wavelength range and in the 15-115 K temperature region at a constant excitation laser intensity of 19.5 W cm -2
. From Figure 2 it can be seen that in the temperature range of 15-40 K the intensity of the C-band increases with increasing temperature, while for T > 40 K the intensity of the band decreases. Figure 3 shows the integrated C-band intensity as a function of the reciprocal temperature in the 15-115 K range and temperature dependence of the C-band peak energy. The increase of C-band intensity in the temperature range of 15-40 K may be related to the thermal release of holes from the above-mentioned acceptor level a1 to the valence band. Probably, such released holes are captured not only by the acceptor level a2 but also by the acceptor level a3 , responsible for appearance of C-band in the PL spectra. The decrease of the C-band intensity in the temperature range of 40-115 K is associated with the thermal release of holes from the acceptor level a3 when the contribution of captured holes released from level a1 becomes very small. A rapid thermal quenching of the PL band is observed above T = 60 K. The experimental data for the temperature dependence of the integrated C-band intensity can be fitted by the following expression [12]
0 3/ 2 3/ 2 1 2 ( ) 1 exp( / ) I I T T T E kT = + α + α −∆ (1)
where I0 is a proportionality constant, ∆E the thermal activation energy, k the Boltzmann constant, α1 and α2 are the fitting parameters associated with the temperature dependence of the capture cross sections of the donor and acceptor impurity levels. The best fit in the temperature range 40-115 K using Eqn. (1), demonstrated by the solid curve in Fig. 3, has been achieved with parameters I0 = 2.6 × 10⁵, ∆E = 0.035 eV, α1 = 1.6 × 10⁻⁴ and α2 = 2.9 ×10⁻¹.
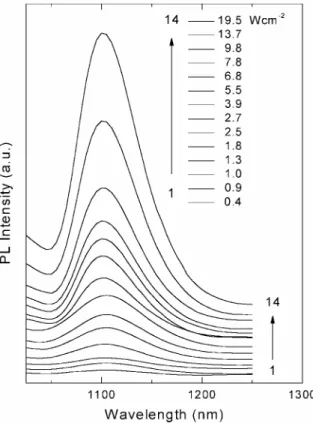
For understanding the nature of luminescence from semiconductors, excitation laser intensity dependence of the PL spectra is an important consideration. In Figure 4, we present the excitation laser intensity dependence of the PL spectra of TlGaS2 crystal. The C-band is visible even at the lowest laser excitation intensity and the intensity of this band rises as the excitation intensity increases. Detailed analysis of the peak position of this band as a function of excitation laser intensity did not yield any variation of the peak energy
values. We, therefore, concentrated on the analysis of PL intensity as a function of excitation laser intensity. The experimental data can be fitted by a simpler power law of the form:
I ∝ L γ (2)
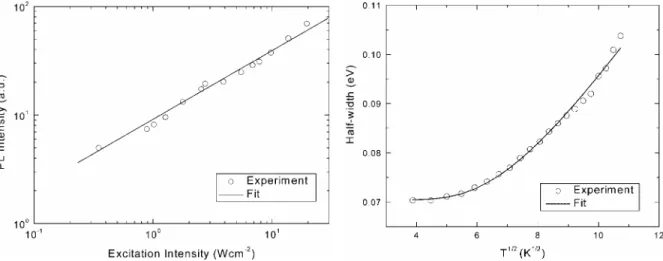
where I is the PL intensity, L is the excitation laser intensity and γ is a dimensionless exponent. It was found that the integrated intensity of the emission band increases sublinearly with respect to the excitation laser intensity (Fig. 5). The value of γ was found to be 0.97. It is well known that for excitation laser photon with an energy exceeding the band gap energy, Eg , the coefficient γ is generally 1 < γ < 2 for the free- and bound-exciton emission , and γ ≤ 1 for free-to-bound and donor-acceptor pair recombination [13]. Thus, the obtained value of γ < 1 further confirms our assertion that C-band in the PL spectra of TlGaS2 is due to donor-acceptor pair recombination.
Fig. 3 Temperature dependence of integrated C-band intensity for TlGaS2 crystal. The arrow at T = 60 K shows
the starting point of the intensive quenching process. (a) the experimental data, (b) the theoretical fit using equation (1), (c) the guide for eye. Inset: Temperature dependence of C-band peak energy for TlGaS2 crystal. The dotted line is only guide for the eye.
Fig. 4 PL spectra of TlGaS2 crystal as a function of
excitation laser intensity at T = 15 K.
Peak energy of C-band does not change with increasing excitation laser intensity (Fig. 4). This result rules out the model of "distant" donor-acceptor pair recombination process where a shift toward higher energies are expected as the excitation laser intensity is increased [14]. It is known that in general, the emission energy from a donor-acceptor pair separated by a distance of r is obtained from[15]
2 ( ) ( ) D A g A D Z Z e E r E E E r = − + + ε , (3)
where, Eg is the band gap energy, EA and ED are the acceptor and donor ionization energies, ε is the dielectric constant, ZD and ZA are the charges of the donor and acceptor states, respectively. From Eq. (3), it is clear that as the excitation laser intensity is increased, the contribution of closer pairs will increase leading to the expected blue shift of the peak energy of the emission. Since this is in contrast with the observed data, we conclude that, only close pairs such as the nearest or next-nearest neighbors are involved in the transitions.
Fig. 5 Dependence of integrated PL band intensity on excitation laser intensity at T = 15 K. The solid curve gives the theoretical fit using equation (2).
Fig. 6 Variation of the half-width with square root of temperature for the emission band in TlGaS2 crystal. The solid curve is a plot of equation (4) with hνe =0.011 eV.
Inset of Figure 3 shows the shift of the emission peak energy as a function of temperature. The emission band peak energy increases with increasing temperature. This is opposite to the behavior of the band gap energy shift, which decreases with increasing temperature [2]. The total range of the peak energy shift is 0.014 eV. Similar behavior for the peak energy shift as well as the above-mentioned half-width increase with temperature has been observed for the emission bands of p-GaAs [16] and layered p-GaSe [17]. The 1.37 eV (GaAs) and 1.20 eV (GaSe) emission bands were associated with a vacancy-acceptor complex center, and the recombination mechanism was interpreted as self-activated luminescence in terms of the CC model [18]. Since the CC model was so successful in explaining the behavior of the luminescence associated with such a localized center in layered p-GaSe, it was also applied here for layered TlGaS2 which belongs to the same III-VI family as GaSe with a layered crystal structure.
Figure 6 presents the temperature dependence of the C-band half-width W, which appears to follow the CC model equation [18]
W = Wo [coth (hνe / 2kT )]1/2, (4)
where Wo is a constant, whose value is equal to W as the temperature approaches 0 K, and hνe is the energy of the vibrational mode of the excited state. The half-width measurements were not performed above 115 K, because of the reduced PL intensity. However, the changes in the half-width between 15 and 115 K are large enough to show the functional dependence of Eq. (4). The solid line in Fig. 6 is a plot of Eq. (4) with parameters Wo = 0.071 eV and hνe = 0.011 eV. The fact that the excited state vibrational energy (hνe) is lower than the longitudinal optical phonon energy of 0.039 eV (315 cm-1) measured by IR reflection [9], shows the localized nature of the centers and the validity of applying the CC model [16].
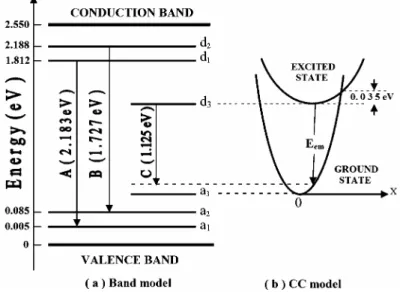
Figure 7 shows the CC model for the TlGaS2 crystal. Following the p-GaAs [16] and p-GaSe [17] works, let us assume that the ground state of the localized center is derived from an acceptor level a3 , the excited state originates from a sulphur vacancy donor level d3 , and the zero point of both states lie within the band gap. Actually, in compound semiconductors a deviation from stoichiometry generates donors for the case of anion
vacancy [19]. The acceptor level a3 above the top of the valence band may be linked, as in GaSe [20], to the defects and stacking faults, which are due to the weak interlayer interactions in the studied crystals. Electron transitions from the excited state of the donor level to the ground state of the acceptor level gives rise to the PL with emitted photon energy Eem . Also, according to the CC model, when the ground-state vibrational energy is larger than the excited-state vibrational energy, the peak shift of the emission band with temperature is opposite to the band gap energy shift [16].
Fig. 7 Band model (a) and configurational coordinate (CC) model (b) of TlGaS2 crystal at T = 15 K.
In terms of the CC model, the observed quenching of the C-band in the PL spectra with increasing temperature (Figs. 2 and 3) is due to an increased electron population of the excited state at higher displacement coordinates. These electrons then return to the ground state through nonradiative recombination. Thus, the activation energy ∆E = 0.035 eV, obtained from the thermal quenching of the PL , is the difference in the energies of the lowest excited state and the intersection point of the excited and the ground state CC curves (Fig. 7).
4 Conclusions
We measured low-temperature PL spectra of layered single crystal TlGaS2 grown by modified Bridgman method. Three PL bands centered at 568 nm (2.183 eV, A-band), 718 nm (1.727 eV, B-band) and 1102 nm (1.125 eV, C-band) have been observed. The analysis of the PL spectra as a function of temperature and excitation laser intensity allows one to obtain a possible model for the donor-acceptor levels located in the forbidden energy gap of the TlGaS2 crystal. In our proposed CC model for C-band, the emission band is associated with a vacancy-acceptor complex center, and the recombination mechanism is interpreted as self-activated luminescence. The excited state originates from a sulphur vacancy donor level d3. The acceptor level a3 above the top of the valence band may be linked to stacking faults in the studied layered crystal. The difference in the energies of the lowest excited state and the intersection point of the excited and the ground state CC curves is equal to the activation energy ∆E = 0.035 eV, which was obtained from the thermal quenching of the PL. Sublinearly increase of PL intensity with respect to the excitation laser intensity confirms our assignment that the observed PL in TlGaS2 crystal is due to donor-acceptor pair recombination.
References
[1] K. A. Yee and A. Albright, J. Am. Chem. Soc. 113, 6474 (1991).
[2] M. P. Hanias, A. N. Anagnostopoulos, K. Kambas, and J. Spyridelis, Mat. Res. Bull. 27, 25 (1992). [3] N. Kalkan, J. A. Kalomiros, M. Hanias, and A. N. Anagnostopoulos, Solid State Commun. 99, 375 (1996).
[4] B. Abay, H. S. Guder, H. Efeoglu, and Y. K. Yogurtcu, Phys. Stat. Sol. (b) 227, 469 (2001).
[5] K. Allakhverdiev, T. G. Mammadov, R. Suleymanov, and N. Gasanov, J. Phys.: Condens. Matter 15, 1291 (2003). [6] H. J. Song, S. H. Yun, and W. T. Kim, Solid State Commun. 94 , 225 (1995).
[7] A. Kato, M. Nishigaki, N. Mammedov, M. Yamazaki, H. Uchiki, and S. Iida, J. Phys. Chem. Solids 64, 1713 (2003).
[8] N. S. Yuksek, N. M. Gasanly, and H. Ozkan, Semicond. Sci. Technol. 18, 834 (2003).
[9] N. M. Gasanly, A. F. Goncharov, N. N. Melnik, A. S. Ragimov, and V. I. Tagirov, Phys. Stat. Sol. (b) 116, 427 (1983).
[10] H. G. Kim, K. H. Park, H. J. Lim, S. K. Min, H. L. Park, and W. T. Kim, Jap. J. Appl. Phys. 32, Suppl. No. 3, 476 (1993).
[11] N. M. Gasanly, A. Aydinli, A. Bek, and I. Yilmaz, Solid State Commun. 105, 21 (1998). [12] J. Krustok, H. Collan, and K. Hjelt, J. Appl. Phys. 81 1442 (1997).
[13] T. Schmidt, K. Lischka, and W. Zulehner, Phys. Rev B 45, 8989 (1992).
[14] P. Y. Yu and M. Cardona, Fundamentals of Semiconductors (Springer, Berlin, 1995), p. 348.
[15] J. Krustok, J. H. Schon, H. Collan, M. Yakushev, J. Mudasson, and E. Bucher, J. Appl. Phys. 86, 364 (1999). [16] C. J. Hwang, Phys. Rev. 180, 827 (1969).
[17] S. Shigetomi, T. Ikari, and H. Nakashima, J. Appl. Phys. 74, 4125 (1993).
[18] R. K. Willardson and A.C. Beer, Semiconductors and Semimetals (Academic Press, New York, vol. 8, 1972), p. 374.
[19] J. I. Pankove, Optical Processes in Semiconductors (Prentice-Hall, Inc., New Jersey, 1975), p.150. [20] V. Capozzi, Phys. Rev. B 28, 46 (1983).