CTuK55 .pdf
© 2002 OSA/CLEO 2002
CTuK55 1:00 pm
Optical Transitions of Tm3• Ions for Amplifiers: How the Local Structure Works In (1- x)Te02 + (x)M (where M
=
UCI, CdCl2 , W03) GlassA. Aydinli, F. Ay, Bilkent University. Physics Department, 06533, Bilkent-Ankara, Turkey, Email:[email protected]
A. Sennaroglu, Koc University, Physics Department, 80860, istinye-istanbul, Turkey S. Cenk, TUBiTAK-Marmara Research Center, 41470 Gebze-Kocaeli, Turkey
G. Ozen, Istanbul Technical University, Physics Department, 80626, istanbul, Turkey
Tm3• doped glass is one of the most studied sys-tems towards the achievement of compact blue upconversion lasers as well as fiber amplifiers in the telecommunication networks both at 1.5 µm and 1.8 µm due to its radiative emissions at 470 nm, 1.45 µm and 1.8 µm.1.2 These emissions cor-responds to the 1G4 ~ 3 H6, 3 F 4 ;:: 3 H4 and, 3 H4 ~ 3
H6 transitions upon excitation into either 3F3 or 3F
4 levels, respectively.
This report reviews some studies on the sp ec-troscopic properties of Tm3• doped several tellu -rite glasses. Effect of temperature on the stimu -lated emission cross-sections are also discussed.
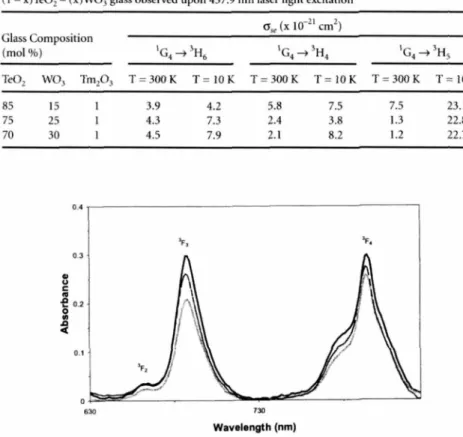
Absorption spectra of the 0.01 mol. Tm3• doped tellurite glasses having 0.3 mol CdCl2, Li Cl or W03 as the network modifier in the 660 nm-800 nm pumping region are presented in Figure I. The ratio of the absorbance at the peak wavelength of 3F3 and
3
F4ban ds are about the
same for the samples having CdC/2 and LiCJ while the ratio of the same bands is measured to be 0.8 for the sample having W03 as the modifier. Judd-Ofelt3'4 theory gives the calculated oscil -lator strength for an electric dipole transition from the ground state to an excited state in terms of then, (t = 2, 4, 6) intensity parameters.
Spontaneous emission probability for an elec -tric dipole emission can then be calculated using these intensity parameters. Our results show that the strongest dependence on the W03 content was observed for the parameter 02• The 02 and
04 parameters are dominant for the 3F4 ~
3 H4, 3H 4 ~ 3H 6 and 1G 4 ~ 3 H6 transitions of Tm3• ion. Line strength of the 3H6 ~
3
F2•3 transition used as the pumping level, is determined by 06
CTuK55 .pdf
© 2002 OSA/CLEO 2002
CTuK55 Table I. Stimulated emission cross-sections,
a
,.
,
for the emissions of Tml+ in (I - x)Te02 - (x)W03 glass observed upon 457.9 nm laser light excitationa
,. (x
10-21 cm2)Glass Composition
(molo/o) 'G4 ~3H6 'G4 ~ iH4 'G4 ~ 3Hs Te02 W03 Tm203 T= 300 K T= IOK T=300K T= !OK T=300K T= IOK
85 15 3.9 4.2 5.8 7.5 7.5 23.l 75 25 4.3 7.3 2.4 3.8 l.3 22.8 70 30 4.5 7.9 2.1 8.2 1.2 22.7 0.4 . . - - - ,
..
u c..
0.3-e
0.2 0..
~
0.1 630 730 Wavelength (nm)CTuK55 Fig. I. Variation of the Tm3+ absorbance with the modifier in the range of pumping wave -length 630 nm-800 nm(- : 0.3 mol. CdC12, ---: 0.3 mol. LiCl and ····: 0.3 mol. W03). 1st~----~---~ ;
!
.
~IN ~.
•
~
st..
0 .r:..
(a) (b) ·o . • • 'c,. 'I\ 550 650 750 850 Wavelength (nm) 'G.CTuK55 Fig. 2. a) Effect of composition on the luminescence bands (excitation was made with a laser tuned at 457.9 nm) D: 0.15 mol., ti.: 0.25 mol. and, 0: 0.30 mol. W03 content. b) Ef-fect of composition on the spectral profiles of the luminescence bands (excitation was into the 1G4 level ofTm3+ ion with a laser tuned at 457.9 nm) D: 0.15 mol., ti.: 0.25 mol. and, 0: 0.30 mol. CdCl2 content in Te02-CdCl2 glass.
1.95 x 10⁻²⁰ cm2 for the dCl2, LiCI and W03 modifiers, respectively.
Effect of the W03 (presented in Fig. 2a) and CdCl2 (presented in Fig. 2b) content on the lumi -nescence band structure and the intensities at room temperature are also very similar .
For both modifiers, integrated intensity of the emissions due to the 1G4 ~ 3H6 transition first shows a decrease and then an increase while the integrated intensity of the emissions due to the
1
G4 ~
3 H4 and
1
G4 ~ 3H5 transitions decrease
with increasing amount of modifier.
Stimulated emission cross-section at the peak wavelength of the emission bands, a() .. P), was d e-termined using the formula given in ref. [ 5 J and,
the results obtained for the Te02-W03 glass are presented in Table I.
From our data, it can be concluded that Tm3+
doped binary tellurite glasses are promising m a-terials for the infra-red amplifiers as well as the blue up-conversion lasers when the wavelength of the pumping light is chosen as 650 nm. References
l. S. Tanabe, "Optical transitions of rare earth ions for amplifiers: how the local structure works in glass", J. Non-Cryst. Solids 259, J-9 (1999).
2. K. Miazato, D.F. de Sousa, A. Delben, J.R. Delben, S.L. de Oliveira, L.A.0. Nunes, "Up -conversion mechanisms in Tml+ doped lead Auoroindogallate glasses':
J
.
Non-cryst. Solids 273, 246--251 (2000).3. B.R. Judd, "Optical Absorption Intensities of Rare-Earth Ions", Phys. Rev. 127, 750-761 (I 962).
4. . . Ofelt, "Intensities of crystal spectra of rare-earth ions'',]. Chem. Phys. 37, 511-520 (l 962).
5. W.F. Krupke, "Induced emission cross-s ec-tions in neodymium doped glasses': IEEE J. Quant. Electron., QR-10, 45~57 (1974).