Full Terms & Conditions of access and use can be found at
http://www.tandfonline.com/action/journalInformation?journalCode=mree20
Download by: [Bilkent University] Date: 04 October 2017, At: 00:36
ISSN: 1540-496X (Print) 1558-0938 (Online) Journal homepage: http://www.tandfonline.com/loi/mree20
Assessing Selectivity and Market Timing
Performance of Mutual Funds for an Emerging
Market: The Case of Turkey
Serkan İmişiker & Ümit Özlale
To cite this article: Serkan İmişiker & Ümit Özlale (2008) Assessing Selectivity and Market Timing Performance of Mutual Funds for an Emerging Market: The Case of Turkey, Emerging Markets Finance and Trade, 44:2, 87-99
To link to this article: http://dx.doi.org/10.2753/REE1540-496X440205
Published online: 07 Dec 2014.
Submit your article to this journal
Article views: 21
View related articles
Emerging Markets Finance & Trade / March–April 2008, Vol. 44, No. 2, pp. 87–99.
Copyright © 2008 M.E. Sharpe, Inc. All rights reserved. 1540-496X/2008 $9.50 + 0.00. DOI 10.2753/REE1540-496X440205
Performance of Mutual Funds for an
Emerging Market
The Case of Turkey
Serkan Ømis*iker and Ümit Özlale
ABSTRACT: This paper derives and analyzes the selectivity and market timing performance
of the mutual funds for the Turkish economy for the financial crisis period by employing high-frequency data. The determinants of these derived abilities are investigated within a regression analysis. The results suggest weak evidence about selection ability and some evidence about superior market timing quality. They also indicate that management fees are negatively correlated with the ability measure, which is quite surprising. Experience emerges as an important factor, especially for market timing ability.
KEY WORDS: emerging markets, mutual funds, selectivity and market timing ability. A significant number of studies (see, e.g., Solnik 1995) show that international diversifica-tion can significantly increase returns and reduce risks. Given that the financial markets in the world are integrating at an increasing pace, a deeper understanding of international diversification through emerging market economies becomes a very important issue.
However, the research that focuses on the identifying characteristics of emerging markets has been made only to a limited extent. This limitation is a problem because the dynamics of emerging market economies can be very different than those of developed economies. With shallow financial markets and excess sensitivity to political dynamics, emerging markets deserve to be analyzed within a broader perspective. In addition, most emerging markets experience frequent economic crises, which may affect detrimentally the functioning of their capital markets both during and after the crisis. Clearly, more research is needed to identify the accounting, regulatory, operational, and other differ-ences between emerging markets and well-developed markets.
This study takes the above discussion as its starting point and aims to shed some light on the performance of mutual fund managers in an emerging market that has experienced a major economic crisis. The Turkish economy, which had the deepest financial crisis of its history on February 2001, stands out as a perfect case. Within a high-frequency analysis framework, we focus on two basic principles—selectivity and market timing abilities—which are proposed to assess the performances of mutual fund managers. Selectivity refers to the managers’ performance in foreseeing the price movements of individual stocks. Market timing indicates their success in foreseeing the price movements
Serkan Ømis*iker ([email protected]) is an expert in the Research Department, Capital Markets Board of Turkey, Ankara, Turkey. Ümit Özlale ([email protected]) is an associate professor in the Department of Economics, Bilkent University, Bilkent, Turkey. All views expressed herein are solely those of the authors and do not necessarily reflect those of the Capital Markets Board of Turkey. The authors thank Abdurrahman Carkacioglu for his technical help and Abdullah Kaya, M. Saygin Aziz, and Murat Parmakci for their valuable comments.
of the market.1 We analyze the managers’ performances by employing A-type mutual funds, as these funds better reflect their performances in taking decisions.
Consistent with Lee and Rahman (1990), our methodology allows us to decompose the selectivity and market timing abilities of mutual fund managers. After decomposing these series, we perform a regression analysis and determine the factors that are closely associated with these abilities. To our knowledge, such an exercise, focusing on emerging markets and determining the factors that affect selectivity and market timing abilities, has not been performed before.
The Turkish Capital Markets
The first part of this section presents the structure of the capital markets and the perfor-mance of the Istanbul Stock Exchange (ISE). The second part discusses the structure and returns of mutual funds.
The Capital Market Structure and the ISE
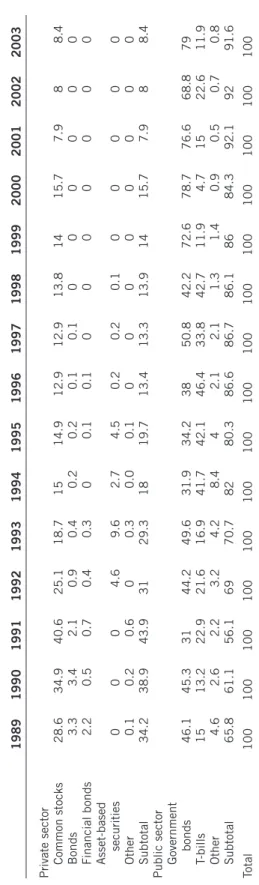
In the 1980s, the attempts to transform the Turkish economy into a more liberalized and market-oriented economy have formed a sound basis for a modern financial system.2 Since the liberalization of foreign capital flows, there has been a sharp increase in both the volume and number of transactions in the ISE.3 However, as Table 1 clearly shows, the private-sector securities’ weight in the financial system has dramatically decreased—from 43.9 percent in 1991 to 8.4 percent in 2003—as a result of the high real interest rates on government bonds due to the debt structure and huge borrowing requirement of the public sector.4 The effects of the two crises on April 1994 and February 2001 further worsened the situation.
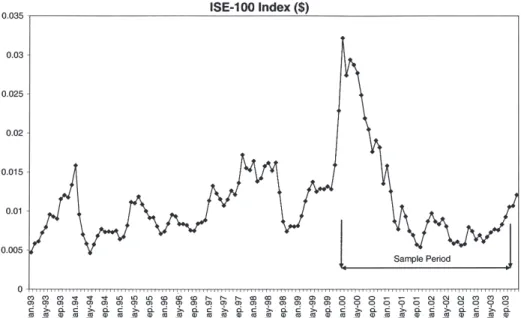
The abovementioned negative characteristics about the financial markets can be evaluated better if the performance of the ISE-100 Index is observed. As Figure 1 shows, the value of the index in U.S. dollars decreases dramatically, especially after the February 2001 crisis.5 Although the capital inflows as a result of the implementation of an exchange rate–based stabilization program in December 1999 increased the index significantly, it experienced its deepest decline after the investors anticipated the failure of the program.
Mutual Funds
The mutual funds in the Turkish economy are classified into two types: Type A and Type B. The former is required to invest at least 25 percent of its assets in equities issued by Turkish companies, but there is no such obligation for the latter. As Figure 2 shows, since 1999, mutual funds have become increasingly popular. There was a jump in the portfolio value of mutual funds at the beginning of 2000, and we observe an incredible growth path with almost a 300 percent increase beginning with 2002. By the end of October 2003, the total value of the mutual funds’ portfolios was approximately $12 billion, around 6.6 percent of GDP in 2002. The basic reason for this increasing popularity is the tax advantage for these funds created by the eighth article of the Corporate Tax Law and ninety-fourth article of the Income Tax Law.
The Institutional Investment Managers’ Association (IIMA) announces an index value for both types of mutual funds on a daily basis.6 Figure 3 compares these values. B-type
Table 1. Outstanding securities in T
urkish capital markets (percent)
1989 1990 1991 1992 1993 1994 1995 1996 1997 1998 1999 2000 2001 2002 2003
Private sector Common stocks
28.6 34.9 40.6 25.1 18.7 15 14.9 12.9 12.9 13.8 14 15.7 7.9 8 8.4 Bonds 3.3 3.4 2.1 0.9 0.4 0.2 0.2 0.1 0.1 0 0 0 0 0 0 Financial bonds 2.2 0.5 0.7 0.4 0.3 0 0.1 0.1 0 0 0 0 0 0 0 Asset-based securities 0 0 0 4.6 9.6 2.7 4.5 0.2 0.2 0.1 0 0 0 0 0 Other 0.1 0.2 0.6 0 0.3 0.0 0.1 0 0 0 0 0 0 0 0 Subtotal 34.2 38.9 43.9 31 29.3 18 19.7 13.4 13.3 13.9 14 15.7 7.9 8 8.4
Public sector Government
bonds 46.1 45.3 31 44.2 49.6 31.9 34.2 38 50.8 42.2 72.6 78.7 76.6 68.8 79 T-bills 15 13.2 22.9 21.6 16.9 41.7 42.1 46.4 33.8 42.7 11.9 4.7 15 22.6 11.9 Other 4.6 2.6 2.2 3.2 4.2 8.4 4 2.1 2.1 1.3 1.4 0.9 0.5 0.7 0.8 Subtotal 65.8 61.1 56.1 69 70.7 82 80.3 86.6 86.7 86.1 86 84.3 92.1 92 91.6 Total 100 100 100 100 100 100 100 100 100 100 100 100 100 100 100
funds obviously perform better than A-type funds, with an approximately 450 percent rise in their own values. As mentioned in Ozatay and Sak (2002), the debt dynamics of the public sector, which resulted in an excessively high real interest rate, is the primary reason for this divergence. Because A-type funds are obliged to keep at least 25 percent of their portfolios in equities issued by Turkish companies, which were negatively
af-Figure 1. Value of the ISE-100 Index: January 1993–December 2003 (U.S. dollars)
Figure 2. Total portfolio value of mutual funds between January 1997 and October 2003 (millions of U.S. dollars)
fected by the financial crisis in 2001, these funds could only outperform their counterparts through managers’ selectivity and market timing.
Our message from this section is clear: the Turkish capital markets and the financial system are highly sensitive to macroeconomic dynamics—the general characteristics of an emerging market. The bad fiscal performance of the economy further worsens the scenario by resulting in high real interest rates, which impede financial stability and growth. However, despite these negative developments, the demand for mutual funds has considerably increased in the last few years. Among such funds, B-types reap the benefit of having invested freely on government bonds and treasury bills, whereas A-types better reflect the performance of the stock exchange market. In this context, focusing on A-type funds allows us to better assess the selectivity and market timing abilities of mutual fund managers.
The Model
This section first introduces the data for the sample period and then discusses the meth-odology from which we derive our selectivity and timing ability measures.
The Data
We employ weekly data from January 14, 2000, to October 24, 2003. The fund values are published by the Custody and Settlement Bank (CMB) of Turkey and obtained from the CMB’s database system. The unit price for a fund is used to obtain the rate of return for this fund and represents the value of portfolios of each fund, net of all fees and expenses.7 Our data consist of forty-nine A-type mutual funds for 193 weeks in the
Figure 3. IIMA’s index values of mutual funds for A and B types
A-type Fund Index B-type Fund Index A-type Fund Index B-type Fund Index
period. As explained in the preceding section, the main reason to analyze A-type funds is that the selectivity and market timing abilities of the mutual funds managers can be better observed.
The ISE-100 index’s performance is used to proxy the market portfolio’s return. The risk-free rate is measured by the rate of return on a ninety-one-day Turkish Treasury bill performance index. The excess return of each asset is calculated by subtracting the risk-free rate from the individual asset’s return. All rates of returns are calculated by the following formula: R P P P t t t t = − − − 1 1 ,
where Pt is the value of the index at time t and Rt is the rate of return at time t. Index
values of the last business day of each week are accepted as weekly observations of each index.8
Because we are also investigating the factors that are closely associated with the ability measures of the funds managers, it is important to discuss two of these factors: management fees and experience.
Funds charge a constant percentage of the total portfolio each day as management fees. The CMB has announced the management fee ratios of each mutual fund for 2001, 2002, and 2003.9 However, when the fee ratios for each year are analyzed, there are only slight changes for a few funds in this period. Thus, the average of the management fee ratios for these three years is used to proxy the entire period without any inconvenience. The maximum of the average ratios is 0.03 percent, the minimum is 0.0023 percent, and the average is 0.0146 percent.10 Because mutual fund values, net of management and all other fees, are used to obtain selectivity and market timing performance measures, we expect to find a positive relation between the two ability measures and the fee ratios to offset management costs.
Another fund-specific factor is experience, measured by the days between the initial public offering of the fund and the first day of the sample period. We assume that each month has 30 days and each year has 360 days. For forty-seven out of forty-nine funds, the experience measures are obtainable from the CMB database. This experience mea-sure differs from the meamea-sures used by Golec (1996), Chevalier and Ellison (1999), and Porter and Trifts (1998), and does not necessarily reflect managers’ personal expertise. This type of experience data can be called the institutional experience of mutual funds. Personal experience data for mutual fund managers were not available, but institutional experience is also an important variable for the management process of mutual funds. Institutional experience reflects internal infrastructure, gain and loss experience, devel-opment of internal ethics, and standards of mutual funds. Thus, institutional experience indicates the development of the environment in which the mutual fund managers operate. The average portfolio value of each fund is calculated by taking the average of the daily values for the entire sample period.
The Methodology
Beginning with Fama (1972), the forecasting abilities of the portfolio managers are considered in two major parts: microforecasting and macroforecasting. Microforecast-ing ability refers to managers’ performance to foresee the price movements of individual
stocks. Fundamental and technical analyses are two widely used methods to outguess stock price movements in the market; these analyses basically depend on the historical behavior of that individual stock and financial statements. The macroforecasting ability of the portfolio managers indicates their success in foreseeing the price movements of the market, which clearly depend on many political and economic events. Microforecasting is known as security analysis or selectivity. Macroforecasting is generally referred to as market timing. The following methodology decomposes these two abilities.
The excess return of a portfolio can be written as
� � �
Rtj jR e
tm tj
=β + , (1)
where R}tj is the excess return of the jth portfolio at time t, R}tm is the excess return of
the market portfolio, βj represents the relation between individual portfolio return and
market return, and e]tj is a random error with zero mean. Informed portfolio managers, as
microforecasters, would try to realize positive e]tj values, which indicate a good selection
of the securities that yield a better return for a given level of risk. In this sense, a superior microforecaster tries to select stocks that are well above the security market line, which means higher returns than similar assets with the same level of risk. Thus, we can relax the assumption that the excess return in Equation (1) passes through the origin and rewrite the equation as follows:
� � �
Rtj j jR u
tm tj
=α +β + . (2)
If a portfolio manager predicts the price movements of the stocks well, then the intercept term of Equation (2), αj, has a positive value; if the manager predicts price
movements poorly, then the intercept term is negative. In addition to selection ability, if portfolio managers perform superior forecasts on the market movements, they can increase their risk level by choosing more market-sensitive stocks for their portfolios when they expect that the market will make positive returns in the next period. Such a strategy and its outcome reveal managers’ market timing ability.
However, the second equation does not reflect the market timing ability of a portfolio manager. For this purpose, we can allow βj to be stochastic. Then, the correlation between
time-varying β}j and R}
tm captures market ability. Following Jensen (1972), the time-
varying βj can be modeled as
� �
βtj =βTj +θπ*t. (3)
In such a formulation, π]t represents R}tm – E(R}tm), where E(R}tm) is the unconditional
expectation of the market return. Then π]t* denotes the expected value of π]
t, conditional
upon the fund manager’s information set. In this sense, π]t* proxies the fund managers’ beliefs about the abnormal return on the market, which can also help to model market timing. That said, βTj is the target beta of the fund, and θ measures the sensitivity of the
mutual fund managers’ responses to the information set they have. Under the assump-tions of joint-normal distribuassump-tions of forecasted and actual returns, we can observe a manager’s forecasting ability by looking at the relation between forecasted and actual rate of return on the market.
Consistent with Bhattacharya and Pfleiderer (1983), at time t, fund managers receive a signal of π]t + ε]t, in which ε]t is independent of π]t and normally distributed with zero mean. Thus, the optimal forecast for π]t* can be written as
� � �
π*t =ψ π ε
(
t+ t)
. (4)The minimization of the forecast-error variance with respect to ψ leads to
ψ σ σ σ π π ε = +
(
)
2 2 2 . (5)In addition to the discussion on π]t*, Equation (3) should be further elaborated. Bhat-tacharya and Pfleiderer (1983) claim that the parameter θ is equivalent to 1/[a var(π]t/φt], where a denotes absolute risk aversion and βTj is θE(R}m). The second equation can thus
be written as � � � � � � � Rtj j E Rm R R R u tm tm t tm tj =α +θ
( )
(
1−ψ)
+ψθ( )
2+ψθε + . (6) This is simply � � � � Rtj R R tm tm t = ′ + ′η0 η1 + ′η2( )
+ ′ω 2 , (7) where plimη0′ =αj (8) plimη1′ =θE R( )
�m(
1−ψ)
(9) plimη2′ =θψ. (10)The value αj exposes information about the existence of the selection ability of fund
managers. However, to obtain market timing measures, one should use the quadratic term’s coefficient and the disturbance term in Equation (6), which is
�′ = � � +�
ωt θψεt tRm utj. (11)
We can then obtain a measure for timing ability from the following regression:
�′ � �
( )
ωt =θ ψ σε( )
Rtm +ζt 2 2 2 2 2 , (12) where � � � � � � � ζt =θ ψ2 2( )
Rtm(
εt −σε)
+( )
utj + θψ εRtm t tuj 2 2 2 2 2 . (13)Using the estimates of θ2ψ2σ
ε2 from (12) and θψ from (7), we can get σε2. The next step to obtain the market timing measure is to estimate σπ2. As Merton (1981) proposed, under the assumption that π]t is a stationary Wiener process, the estimate of σπ2 can be derived as ˆ ln / . σπ2 2 1 1 =
(
+)
=∑
R� n tm t n (14)For our sample, these estimates are found as 0.0048 for σπ2 and 0.0047 for the sample variance of π]2. Finally, using these estimates, the measure for the market timing ability of mutual fund managers can be obtained by the following equation:
ψ ρ σ σ σ π π ε = = + 2 2 2 2, (15)
where ρ measures fund managers’ market timing ability.
However, these results may not be efficient due to the existence of heteroskedastic-ity at the disturbance terms of Equations (7) and (12). To obtain efficient estimates, we adopt the methodology proposed in Lee and Rahman (1990), by which the variances of the disturbance terms of Equations (7) and (12) are derived as follows:
σω2 =θ ψ σ2 2 2ε
( )
R� 2+σ2tm u (16)
and
σζ2=2θ ψ4 4
( )
R� 4σε4+2σ4+4θ ψ σ2 2 2ε( )
R� 2σ2tm u tm u. (17)
In Equation (16), σu2 is estimated from Equation (2), and all of the other variables used in these derivations are already obtained from the previous equations. Then, the variables of Equation (7) are divided by σω2, and the variables of Equation (12) are divided by σ
ζ2.
After this process, we use ordinary least squares (OLS) for the transformed data set to get the efficient results.
Results
The results indicate weak evidence of selectivity and some evidence of market timing ability for mutual fund managers. Only one fund for the homoskedastic model and three funds for the heteroskedastic model have significant selectivity estimates at 0.05 signifi-cance levels. However, for market timing, out of forty-nine mutual funds, twenty funds for the heteroskedastic model and twenty-two funds for the homoskedastic model performed better than their counterparts. Table 2 summarizes these results. Clearly, the estimates for selectivity ability for the model, which does not consider market timing, are lower than the estimates of the model with market timing. This result coincides well with the findings of Chang and Lewellen (1984), Henriksson (1984), and Lee and Rahman (1990). Adjusting for heteroskedasticity increases the number of superior market timing ability, though such a finding contradicts Breen et al. (1986) and Lee and Rahman (1990).
Finally, consistent with the results of Lee and Rahman (1990), the correlation between the selectivity and market timing measures for the efficient model is 0.287. Such a finding implies that a mutual fund manager can have both selectivity and timing abilities. The manager is not necessarily specialized in only one of these abilities.
Determinants of Selectivity and Market Timing
It is also important to figure out the factors that affect these abilities. In this context, management fee ratio, experience, average portfolio value as a proxy for the size of each mutual fund, and several dummy variables have been employed. Formally,
αj = β0 + β1MFj + β2EXj + β3APVj + β4D1 + β5D2 + β6D3 + vj (18)
and
ρj = β0 + β1MFj + β2EXj + β3APVj + β4D1 + β5D2 + β6D3 + uj (19)
analyze the determinants of selectivity and market timing ability measures, respec-tively.
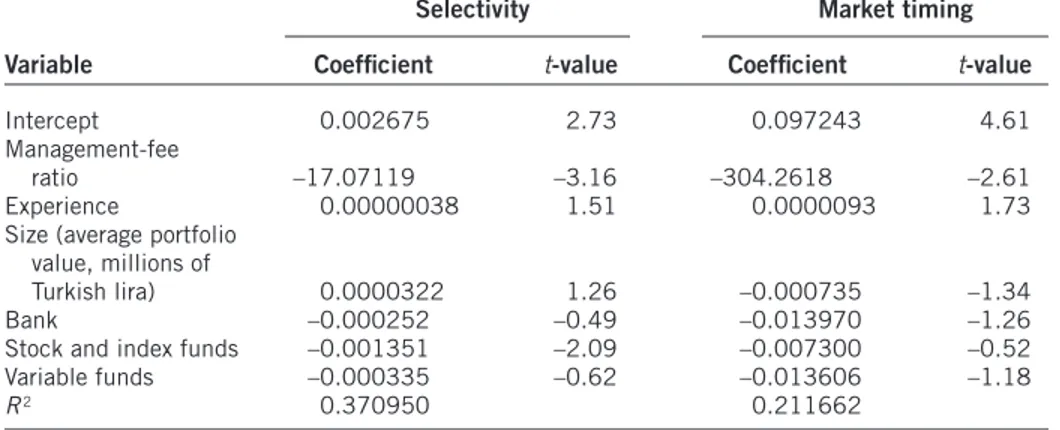
The value MF is the management fee ratio, EX is institutional experience, and APV is the average portfolio value as a proxy for the size of each mutual fund. The value D1 stands for a dummy for the mutual funds owned by the banks. The variables D2 and D3 are the dummy variables for stock index funds and variable funds. Typically, A-type mutual funds are categorized into three groups: stock index, mixed, and variable funds. The stock index funds have strict restrictions for holding risky assets in their portfolios, whereas the variable funds have much more flexibility in changing the asset weights in their portfolios. We use the dummy variables only for the most and the least restricted funds to avoid the dummy trap. Table 3 presents the regression results.
Management fee ratios have a significantly negative effect for both selectivity and market timing, suggesting that mutual fund managers do not receive fees consistent with their performance on these two essential management abilities. The size of the fund has a negative effect on timing, but a positive one on the selectivity measure. However, the coefficient is not significant. Also, stock index funds have worse selectivity performance than their counterparts. Another important result in this model is the role of experience, which seems to have a positive effect on both ability parameters.11
Regarding market timing, the variable funds, which can more freely change the asset weights in their portfolios, have a worse record than the most restricted funds, which are stock index funds.
Previous studies (e.g., Chen et al. 1992) showed that selectivity and market timing abilities are related to each other. In our study, the correlation was found to be 0.287. Due to this fact, Zellner’s (1962) seemingly unrelated regression (SUR) is also employed to appreciate the potential effect of the omitted variables in these models and to get more efficient estimates. As Table 4 shows, the SUR results have higher t-values for all of the Table 2. Summary of results of selectivity and market timing abilities
Selectivity (αj) Timing (ρ)
Positive Negative
(significant (significant Significant
Method Mean at 0.10) at 0.10) Mean at 0.05
Without timing ability –0.000539 1 4 — —
Both timing and selectivity for homoskedastic
model 0.000543 3 — 0.095207 20
Both timing and selectivity for the heteroskedastic
model 0.000347 1 — 0.046668 22
Table 3. Regression results of ability measures on cross-sectional variables
Selectivity Market timing
Variable Coefficient t-value Coefficient t-value
Intercept 0.002675 2.73 0.097243 4.61
Management-fee
ratio –17.07119 –3.16 –304.2618 –2.61
Experience 0.00000038 1.51 0.0000093 1.73
Size (average portfolio value, millions of
Turkish lira) 0.0000322 1.26 –0.000735 –1.34
Bank –0.000252 –0.49 –0.013970 –1.26
Stock and index funds –0.001351 –2.09 –0.007300 –0.52
Variable funds –0.000335 –0.62 –0.013606 –1.18
R2 0.370950 0.211662
coefficients, and therefore give more reliable estimates for the cross-sectional parameters. Experience becomes even more effective for both abilities in a SUR setup.
Conclusion
This study analyzes the selectivity and market timing abilities of mutual fund managers for the Turkish economy in recent years, including the financial crisis period in February 2001. The determinants of these two types of abilities are investigated within a regres-sion analysis.
The results indicate weak evidence of selectivity and some evidence for market tim-ing ability among mutual fund managers. Only one fund in the homoskedastic model and three funds in the heteroskedastic model are found to have significant selectivity estimates. Regarding market timing, out of forty-nine mutual funds, twenty funds for the heteroskedastic model and twenty-two funds for the homoskedastic model have superior quality of market timing.
The results indicate that management-fee ratios have a significantly negative effect on both ability measures, which is quite surprising. Also, the size of the funds has a negative Table 4. Results of the SUR of ability measures to cross-sectional variables
Selectivity Market timing
Variable Coefficient t-value Coefficient t-value
Intercept 0.002675 2.96 0.097243 5.01
Management-fee
ratio –17.07119 –3.43 –304.2618 –2.84
Experience 0.00000037 1.64 0.0000093 1.87
Size (average portfolio value, millions of
Turkish lira) 0.0000322 1.37 –0.000735 –1.46
Bank –0.000252 –0.53 –0.013970 –1.37
Stock and index funds –0.001351 –2.27 –0.0073 –0.57
Variable funds –0.000335 –0.68 –0.013606 –1.28
effect on timing, but a positive one on the selectivity measure, supporting our thought about large mutual funds having less market timing ability than the small ones because of their inflexibility. Experience seems to have a positive effect on both selectivity and market timing, with a slightly higher effect on the latter. The variable funds have a worse record in market timing than do the most restricted funds, implying that the advantage of these funds in flexibility is not used effectively.
Notes
1. Works by Kon (1983) and Lee and Rahman (1990) are only a few of the studies that inves-tigate selectivity and market timing abilities.
2. For the effects of capital account liberalization on the Turkish economy, see Alper and Önis* (2003).
3. For a detailed discussion on the causal relation between stock returns and volume figures for emerging market economies including Turkey, see Gündüz and Hatemi (2005).
4. Baºçı and Ekinci (2005) show that one of the reasons for the high real return on government debt securities is the existence of both inflation risk and default risk.
5. In fact, as Atasoy and Saxena (2006) argue, one reason for the currency crisis in February 2001 was the overvalued domestic currency during the stabilization program between 1999 and 2001. For a detailed analysis of the failure of the program, see Akyürek (2006) and Çapog¬lu (2004).
6. Index values are constructed by taking weighted average of unit price of the largest fifty funds of each type in terms of their market values.
7. For that period of time, there is no regulation about the mutual funds’ distribution of capital gains, dividends, and interest. Thus, mutual funds did not have to distribute any of the capital gains, dividends, or interest to their investors. Consequently, the unit price for a fund represents all the relevant information about the mutual fund’s portfolio performance.
8. For the mutual funds, P indicates the unit price for this fund.
9. There has been no announcement for the year 2000, which is in our sample period. 10. Most of the funds have charged 0.015 percent as their management fees.
11. The effect on market timing is slightly more significant.
References
Akyürek, C. 2006. “The Turkish Crisis of 2001: A Classic?” Emerging Markets Finance and
Trade 42, no. 1 (January–February): 5–32.
Alper, E., and Z. Önis*. 2003. “Financial Globalization, the Democratic Deficit, and Recurrent Crises in Emerging Markets: The Turkish Experience in the Aftermath of Capital Account Liberalization.” Emerging Markets Finance and Trade 39, no. 3 (May–June): 5–26. Atasoy, D., and S.C. Saxena. 2006. “Misaligned? Overvalued? The Untold Story of the Turkish
Lira.” Emerging Markets Finance and Trade 42, no. 3 (May–June): 29–45.
Bas*çı, E., and M.F. Ekinci. 2005. “Bond Premium in Turkey: Inflation Risk or Default Risk?”
Emerging Markets Finance and Trade 41, no. 2 (March–April): 25–40.
Bhattacharya, S., and Pfleiderer, P. 1983. “A Note on Performance Evaluation.” Technical Re-port 714, Graduate School of Business, Stanford University, Stanford, CA.
Breen, W.; R. Jagannathan; and A.R. Ofer. 1986. “Correcting for Heteroskedasticity Tests from Market Timing Ability.” Journal of Business 59, no. 4 (October): 585–598.
Çapog¬lu, G. (2004), “Anatomy of a Failed IMF Program: The 1999 Program in Turkey.”
Emerg-ing Markets Finance and Trade 40, no. 3 (May–June): 84–100.
Chang, E.C., and W.G. Lewellen. 1984. “Market Timing and Mutual Fund Investment Perfor-mance.” Journal of Business 57, no. 1 (January): 57–72.
Chen, C.R.; C.F. Lee; S. Rahman; and A. Chan. 1992. “A Cross-Sectional Analysis of Mutual Funds’ Market Timing and Security Selection Skill.” Journal of Business Finance and
Ac-counting 19, no. 5 (September): 659–675.
Chevalier, J., and G. Ellison. 1999. “Career Concerns of Mutual Fund Managers.” Quarterly
Journal of Economics 114, no. 2 (May): 389–432.
Fama, E.F. 1972. “Components of Investment Performance.” Journal of Finance 27, no. 3 (June): 551–567.
Golec, J.H. 1996. “The Effects of Mutual Fund Managers’ Characteristics on Their Portfolio Performance, Risk, and Fees.” Financial Services Review 5, no. 2: 133–147.
Gündüz, L., and A. Hatemi. 2005. “Stock Price and Volume Relation in Emerging Markets.”
Emerging Markets Finance and Trade 41, no. 1 (January–February): 29–44.
Henriksson, R.D. 1984. “Market Timing and Mutual Fund Performance: An Empirical Investi-gation.” Journal of Business 57, no. 1 (January): 73–96.
Jensen, M.C. 1972. “Optimal Utilization of Market Forecasts and the Evaluation of Investment Performance.” In Mathematical Methods in Investment and Finance, ed. G.P. Szego and K. Shell, pp. 310–335. Amsterdam: Elsevier.
Kon, S.J. 1983. “The Market Timing Performance of Mutual Fund Managers.” Journal of
Busi-ness 56, no. 3 (July): 323–347.
Lee, C.F., and S. Rahman. 1990. “Market Timing, Selectivity, and Mutual Fund Performance: An Empirical Investigation.” Journal of Business 63, no. 2 (April): 261–278.
Merton, R.C. 1981. “On Market Timing and Investment Performance I: An Equilibrium Theory of Value for Market Forecasts.” Journal of Business 54, no. 3 (July): 363–406.
Ozatay, F., and G. Sak. 2002. “Financial Liberalization in Turkey: Why Was the Impact on Growth Limited?” Emerging Markets Finance and Trade 38, no. 5 (September–October): 6–22.
Porter, G.E., and J.W. Trifts. 1998. “Performance Persistence of Experienced Mutual Fund Man-agers.” Financial Services Review 7, no. 1: 57–68.
Solnik, B. 1995. “Why Not Diversify Internationally Rather Than Domestically?” Financial
Analysts Journal 51, no. 1: 89–94.
Zellner, A. 1962. “An Efficient Method of Estimating Seemingly Unrelated Regression and Tests for Aggregation Bias.” Journal of the American Statistical Association 57, no. 298 (June): 348–368.
To order reprints, call 1-800-352-2210; outside the United States, call 717-632-3535.