CHARACTERIZATION AND APPLICATIONS OF
NEGATIVE-INDEX METAMATERIALS
A DISSERTATION
SUBMITTED TO THE DEPARTMENT OF PHYSICS AND THE INSTITUTE OF ENGINEERING AND SCIENCE
OF BILKENT UNIVERSITY
IN PARTIAL FULFILLMENT OF THE REQUIREMENTS FOR THE DEGREE OF
DOCTOR OF PHILOSOPHY
By
Koray Aydın
ii
I certify that I have read this thesis and that in my opinion it is fully adequate, in scope and in quality, as a dissertation for the degree of Doctor of Philosophy.
___________________________________ Prof. Dr. Ekmel Özbay (Supervisor)
I certify that I have read this thesis and that in my opinion it is fully adequate, in scope and in quality, as a dissertation for the degree of Doctor of Philosophy.
___________________________________ Prof. Dr. Bilal Tanatar
I certify that I have read this thesis and that in my opinion it is fully adequate, in scope and in quality, as a dissertation for the degree of Doctor of Philosophy.
___________________________________ Assist. Prof. Dr. M. Özgür Oktel
iii
I certify that I have read this thesis and that in my opinion it is fully adequate, in scope and in quality, as a dissertation for the degree of Doctor of Philosophy.
___________________________________ Assist. Prof. Dr. Vakur B. Ertürk
I certify that I have read this thesis and that in my opinion it is fully adequate, in scope and in quality, as a dissertation for the degree of Doctor of Philosophy.
___________________________________ Prof. Dr. Süleyman Özçelik
Approved for the Institute of Engineering and Science:
___________________________________ Prof. Dr. Mehmet Baray,
iv
ABSTRACT
CHARACTERIZATION AND APPLICATIONS OF
NEGATIVE-INDEX METAMATERIALS
Koray Aydın
PhD in Physics
Supervisor: Prof. Dr. Ekmel Özbay June, 2008
Metamaterials offer novel electromagnetic properties and promising applications including negative refraction, flat-lenses, superlenses, cloaking devices. In this thesis, we characterized the negative-index metamaterials that is composed of periodic arrangements of split-ring resonators (providing negative permeability) and thin wire (providing negative permittivity) arrays. The resonances of split-ring resonators (SRR) are investigated experimentally and theoretically. By combining SRR and wire arrays together, we observed a transmission band where both permittivity and permeability are simultaneously negative, indicating a left-handed behavior. Reflection measurements reveal that the impedance is matched to the free space at a certain frequency range. The left-handed metamaterial is also shown to exhibit negative refractive index by using three different experimental methods namely, refraction from a wedge-shaped negative-index metamaterial (NIM), beam-shift from a slab-shaped NIM and phase shift from NIMs with different lengths. Flat-lens behavior is observed from a slab-shaped negative-index metamaterial based microwave lenses. Furthermore, we demonstrated subwavelength imaging and subwavelength resolution by using thin superlenses constructed from SRR-wire arrays with an effective negative index. We have been able to image a point source with a record-level, λ/8 resolution. SRR
v
and wire arrays exhibit negative index provided that the wave propagates parallel to the plane of SRR structure which makes it hard to fabricate at higher frequencies. An alternative structure called fishnet metamaterial however could yield negative index with wave propagation normal to the structure. We observed left-handed transmission and negative phase velocity in fishnet type metamaterials. Finally, we studied enhanced transmission from a single subwavelength aperture by coupling incident electromagnetic wave to a single SRR placed at the near-field of the aperture.
Keywords: Metamaterial, Left-Handed Material, Split Ring Resonator, Negative
Permittivity, Negative Permeability, Negative Refraction, Negative-Phase
Velocity, Flat-lens, Superlens, Subwavelength Imaging, Subwavelength
vi
ÖZET
NEGATİF İNDİSLİ METAMALZEMELERİN
KARAKTERİZASYONU VE UYGULAMALARI
Koray Aydın
Fizik, DoktoraTez Yöneticisi: Prof. Dr. Ekmel Özbay Haziran 2008
Negatif kırılma, düz lens, süper lens ve görünmezlik pelerini gibi uygumaları bulunan metamalzemeler oldukça farklı elektromanyetik özelliklere sahiptirler. Bu tezde, negatif kırılma indisine sahip metamalzemelerin karakterizasyonu gerçekleştirilmiş ve mikrodalga uygulamalarından birkaçı gösterilmiştir. Bu metamalzemeler negatif permeabiliteye sahip yarıklı halka rezonatörleri ile negatif permitiviteye sahip ince tel yapıları bir araya getirilerek oluşturulmuştur. Yarıklı halka rezonatörlerinin rezonans karakteristikleri deneysel ve teorik olarak incelenmiştir. Yarıklı halka rezonatörleri ile tel yapılarının bir araya getirilmesi sonucu permitivite ve permeabilite değerlerinin eksi olduğu frekanslarda bir geçirgenlik bandı gözlemlenmiş ve bu bant boyunca metamalzemenin dalga vektörü, elektrik alan ve manyetik alanları için sol-el kuralına uyduğu belirlenmiştir. Bu metamalzemenin negatif kırılma indisine sahip olduğu üç farklı ve birbirinden bağımsız deneysel yöntem kullanılarak gösterilmiştir. Bu deneysel yöntemler; prizma şeklindeki metamalzemeden kırılma deneyi, düz metamalzeme levhadan dalganın yer değişiminin gözlemlenmesi ve farklı uzunluklardaki metamalzemelerden faz farkının ölçülmesidir. Mikrodalga boyutlarında çalışan ve düzgün yüzeye sahip lens başarıyla gösterildi. Ayrıca, negatif indise sahip
vii
metamalzeme bazlı süperlenslerin dalgaboyu altı görüntüleme ve çözünürlük için kullanılabileceği deenysel olarak ispatlanmıştır. Rekor seviyede dalgaboyunun sekizde biri çözünürlük elde edilmiştir. Ağ şeklindeki alternatif metamalzemelerin de negatif indis ve negatif faz hızına sahip olduğu başarıyla gösterilmiştir. Son olarak tek bir dalgaboyu altı delikten yarıklı halka rezonatörü kullanarak arttırılmış iletim (transmiyon) çalışılmıştır.
Keywords: Metamalzeme, Solak malzeme, Yarıklı halka rezonatörü, Negatif
Permeabilite, Negatif Permitivite, Negatif Kırılma, Negatif Faz Hızı, Düz Lens, Süperlens, Dalgaboyu-altı Görüntüleme, Dalgaboyu-altı Çözünürlük, Arttırlmış İletim.
viii
Acknowledgements
It is my pleasure to express my deepest gratitude and respect to Prof. Dr. Ekmel Özbay for his invaluable guidance, helpful suggestions and endless support. His personal and academic virtue shaped my academic personality and changed my approach to scientific study. I am very lucky to have the opportunity to study under his tutelage.
I would like to thank to the members of my thesis committee, Prof. Dr. Bilal Tanatar, Assist. Prof. Dr. Mehmet Özgür Oktel, Assist. Prof. Dr. Vakur B. Ertürk, and Prof. Dr. Süleyman Özçelik for reading the manuscript and commenting on the thesis.
I am very fortunate to have been a member of the Özbay group, where I had a chance to work together and benefit from brilliant, intelligent and excited people. I am indebted to Dr. Mehmet Bayındır for teaching how to use microwave experiment setup and guiding me at the very beginning of my academic study. Special thanks to Ertuğrul Çubukçu for his help, understanding and friendship. I appreciate Dr. Kaan Güven, İrfan Bulu and Dr. Zhaofeng Li for their continuous support during my research. This thesis would never been succesful with the endless help of the Özbay group members. I also had a chance to collaborate with Hümeyra Çağlayan, Levent Şahin, Şerafettin Bilge and Atilla Özgür Cakmak. Thank you all. I appreciate the efforts of Serkan Bütün, Murat Güre and Erkin Ülker for teaching me optical lithography and Bayram Bütün for his help during hybrid inorganic-organic light emitting sources project. Indeed, all of the people with whom I’ve overlapped in the Özbay group have contributed to my academic
ix
and social life; for this I thank Necmi Bıyıklı, İbrahim Kimukin, M. Deniz Çalışkan, Turgut Tut, Süheyla Sena Akarca-Bıyıklı, Özgür Kelekçi, Evrim Çolak, Tolga Yelboğa, Evren Öztekin, Muhammed Acar, Mustafa Öztürk.
I would like to thank the members of Nanotechnology Research Center and Advanced Research Laboratory for making my life easier. I am also thankful to my professors and friends in the Department of Physics. Special thanks to Aşkın Kocabaş, Muhammed Yönaç, Levent Subaşı, Dündar Yılmaz, Engin Durgun, Sefa Dağ, M. Emre Taşgın, and R. Volga Ovalı, with whom I had a great time during my life in Bilkent.
There is a long list of my close friends, whether old or new, far away of nearby; to feel their existence is my life source. Thank you all.
I would like to express my endless thanks to my mother, father and sister for their love, encouragement and care. I would also thank to my new family, who doubled the support and encouragement I have.
Finally, special thanks go to my wife, Elif, for her boundless love, endless trust and to my son, Said Enes, for shining a different color onto my life. I cannot imagine finishing all my achievements without their endless moral support. I dedicate this labor to my wife and my son.
x
Contents
Abstract……….. iv Özet ……… vi Acknowledgements………...viii Contents………xList of Figures ... xiii
1 Introduction ... 1
1.1. Motivation ... 3
1.2. Outline of this thesis ... 5
2 Magnetism from split-ring resonators ... 8
2.1. Introduction ... 8
2.2. Resonances of a single split-ring resonator... 9
2.3. Negative permeability media: Periodic arrays of split ring resonators .... 15
2.4. Effect of SRR parameters on magnetic resonance frequency ... 17
2.4.1. Effect of split width ... 18
2.4.2. Effect of gap distance ... 19
2.4.3. Effect of metal width ... 20
2.5. Capacitor-loaded split-ring resonators as tunable metamaterial components ... 21
xi
3 Negative Index Metamaterials ... 25
3.1. Introduction ... 25
3.2. Left-handed metamaterials: Transmission properties ... 26
3.2.1. Negative permittivity ... 27
3.2.2. Left-handed metamaterial ... 29
3.3. Reflection properties of left-handed metamaterials ... 31
3.4. Retrieved effective parameters... 34
3.5. Negative refractive index ... 40
3.5.1. Refraction through wedge-shaped left-handed materials ... 41
3.5.2. Refraction through slab-shaped left-handed materials ... 45
3.6. Negative phase velocity ... 47
4 Flat-lens focusing ... 50
4.1. Introduction ... 50
4.2. Point focusing by a NIM flat lens ... 51
4.3. Electromagnetic wave focusing from sources inside a NIM flat lens... 55
4.3.1. Flat lens behavior ... 56
4.3.2. Superlens behavior ... 58
5 Subwavelength resolution with a superlens ... 63
5.1. Introduction ... 63
5.2. Effective parameters of a 2D NIM ... 65
5.3. Imaging beyond the diffraction-limit ... 68
xii
5.5. Effect of superlens thickness ... 72
6 Fishnet-type planar metamaterials ... 75
6.1. Introduction ... 75
6.2. Transmission through a fishnet type metamaterial ... 76
6.3. Retrieved effective parameters... 80
6.4. Negative phase advance and backward wave propagation ... 84
7 SRR-coupled enhanced transmission ... 88
7.1. Introduction ... 88
7.2. Enhanced transmission by coupling to the electric resonance of SRR .... 89
7.3. Enhanced transmission by coupling to the magnetic resonance of SRR . 94 7.4. Strong localization of electric field and coupling mechanism ... 97
8 Conclusion ... 100
Bibliography ………... 103
xiii
List of Figures
Figure 1.1: The number of articles published in SCI journals on the topics of metamaterials and negative refraction. (after [4]) ... 3 Figure 1.2: Some applications of metamaterials. (a) Superlens (after [28]), (b)
magnifying hyperlens (after [30]), (c) cloaking device (after [32]). ... 4 Figure 2.1: Schematic drawings of (a) Single unit cell of SRR, (b) Single unit
cell of CRR. ... 9 Figure 2.2: Experimental setup for measuring transmission through a single
unit cell of SRR structure. The structure is placed between two monopole antennas. ... 10 Figure 2.3: Measured and simulated frequency responses of single SRR and
CRR structures. ... 11 Figure 2.4: Simulated electric field intensity profile at the magnetic resonance
frequency of the split ring resonator. ... 13 Figure 2.5: Simulated magnetic field magnitudes of a single SRR at (a) 3.82
GHz, and (b) 11.92 GHz. ... 14 Figure 2.6: Experimental setup for transmission measurements. ... 15 Figure 2.7: Measured and simulated transmission spectra of SRR and CRR
arrays. ... 16 Figure 2.8: Transmission spectra of individual SRRs with different split widths
obtained via (a) experiment, and (b) simulation. ... 18 Figure 2.9: Transmission spectra of individual SRRs with different gap
distances obtained via (a) experiment, and (b) simulation. ... 19 Figure 2.10: Transmission spectra of individual SRRs with different metal
xiv
Figure 2.11: SRR with capacitor loaded (a) in the gap region between concentric rings, (b) in the outer split region, and (c) in the inner split region ... 21 Figure 2.12: Magnetic resonance frequency of a split ring resonator as a
function of loaded-capacitances at different capacitive regions. Solid lines are the results obtained from the numerical models. ... 22 Figure 3.1: (a) A layer of 1D LHM composed of SRR and wire arrays, and (b)
composite metamaterial (CMM) composed of CRR and wire arrays. ... 26 Figure 3.2: Measured transmission spectra of periodic wire (blue line), and
CMM (red line) arrays. ... 28 Figure 3.3: Transmission spectra of periodic SRR (blue line), LHM (red line)
and CMM (black line) arrays obtained from (a) measurements and (b) numerical simulations. ... 30 Figure 3.4: Measured transmission (black line) and reflection (red line) spectra
of (a) 5 layer and (b) 10 layer 1D LHM. ... 32 Figure 3.5: Measured reflection spectra of (a) 5 and 10 layers 1D LHM, (b)
reflection spectra of 5 layers LHM and CMM structures. ... 33 Figure 3.6: Simulated S-parameters for 1D LHM. ... 35 Figure 3.7: Simulated real and imaginary parts of effective (a) refractive index,
and (b) impedance for 1D LHM. ... 36 Figure 3.8: Simulated real and imaginary parts of effective (a) dielectric
permittivity and (b) magnetic permeability. ... 37 Figure 3.9: Simulated real parts of effective permittivity, permeability,
refractive index and impedance. Dashed gray line corresponds to the frequency region where ε = μ, therefore the impedance is Z=1. ... 38 Figure 3.10: (a) Photograph of wedge-shaped NIM and (b) scheme of
experimental setup for verifying negative refraction by wedge shaped NIM. ... 42
xv
Figure 3.11: Measured beam profiles of the EM waves refracted from a 2D prism shaped LHM as a function of frequency and angle of refraction between 3.73 - 4.05 GHz. ... 43 Figure 3.12: Measured beam profiles from the waves refracted from a
wedge-shaped 2D left-handed material at 3.77 GHz (blue line) and 3.86 GHz (red line). ... 44 Figure 3.13: (a) Photograph of 10-layer NIM slab (b) Scheme of experimental
setup for verifying negative refraction by using beam-shift method. . 45 Figure 3.14: (a) Spatial intensity distribution of outgoing EM wave at 3.86
GHz along x-z plane. (b) Intensity profile of EM wave at the LHM-air interface (z = 0). ... 46 Figure 3.15: The measured transmission phase spectra of LHMs with 5, 6, 7
and 8 number of layers along the propagation direction. ... 48 Figure 3.16: Measured effective refractive indices as a function of frequency
obtained from the phase shift experiments (blue line) and prism experiments (■). ... 49 Figure 4.1: Schematic drawing of the top view of experimental setup for
verifying flat lens focusing. ... 51 Figure 4.2: Measured transmission spectra along the x-z plane for a point
source located at (a) ds = 0.5λ, and (b) ds = λ away from the LHM lens. The x direction is parallel to the LHM lens where x = 0 is the optical axis of the flat lens, whereas the z direction is perpendicular to the LHM lens where z = 0 is the LHM-air interface. ... 52 Figure 4.3: Intensity profile of the focused EM waves at x = 0 point along
longitudinal direction ... 53 Figure 4.4: Intensity profile of the focused EM waves at the focal points of
each source along the lateral direction. The graphs are for the point source located at λ/2 (black) and λ (red) away from the air-LHM interface. ... 54
xvi
Figure 4.5: LHM slab lens with 10 unit cells along the propagation direction (z-axis). ... 56 Figure 4.6: The spatial intensity distribution of the outgoing EM waves from
the sources located inside the (a) fifth layer, and (b) seventh layer of the LHM slab lens at 3.89 GHz. ... 57 Figure 4.7: The spatial intensity distribution of the outgoing EM waves from
the sources located inside the (a) fourth layer and (b) fifth layer of the LHM slab lens at 3.77 GHz. ... 58 Figure 4.8: The spatial intensity distribution of the outgoing EM waves in free
space from the source located at 50 mm away from the z = 0 point at 3.77 GHz. ... 59 Figure 4.9: The focused beam profile near the LHM-air interface for the
sources located inside the fourth layer (black) and fifth layer (red) of the LHM slab at 3.77 GHz. The blue dashed line represents the beam profile when the LHM lens is removed and EM waves propagate in air. ... 60 Figure 4.10: The intensity profiles of EM waves near the LHM lens as a
function of frequency. The reflection spectrum of the LHM lens is shown in the figure with a white line. ... 61 Figure 5.1: The photograph of negative-index metamaterial slab with three unit
cells along z-direction. (b) Scheme of experimental setup for imaging measurements. ... 64 Figure 5.2: Measured transmission (blue) and reflection (red) spectra for an
NIM slab. ... 65 Figure 5.3: Real parts of retrieved effective permittivity (blue) and
permeability (red). Reflection spectrum is also plotted within the figure with black line. ... 66 Figure 5.4: Real parts of retrieved refractive index (blue), impedance (red) and
xvii
Figure 5.5: The power distribution at the image plane with (blue) and without (dashed red line) NIM superlens. ... 69 Figure 5.6: The field profiles from single sources placed at three different
locations along x-direction, that are x = 0.0 mm (black line), x = 0.5 cm (red line) and x = -1.3 cm (blue line). ... 70 Figure 5.7: The measured power distributions for two point sources separated
with distances of λ/8 (black line), λ/5 (red line) and λ/3 (blue line). ... 71 Figure 5.8: The measured field profiles obtained from NIM superlenses with
thicknesses w=2.56 cm (blue line) and w=4.44 cm (red line). The NIM superlens is excited with a single source in (a), and with two point sources separated with λ/5 in (b). ... 73 Figure 6.1: Schematic drawings of (a) a fishnet unit cell, and (b) a multi-layer
fishnet metamaterial structure. ... 77 Figure 6.2: Measured (blue line) and simulated (red line) transmission spectra
of a single layer fishnet metamaterial. The photograph of the real structure is shown in the inset. ... 78 Figure 6.3: Measured (blue line) and simulated (red line) transmission spectra
of (a) two-layer and (b) five-layer fishnet metamaterial. ... 79 Figure 6.4: Retrieved effective parameters of a (left) single-layer and a (right)
two-layer fishnet metamaterials. The real (blue line) and imaginary (red dashed line) parts of effective permittivity (top), permeability (middle), and refractive index (bottom) are shown. ... 81 Figure 6.5: Real part of retrieved refractive index and (b) figure of merit for a
single-layer (blue line) and two-layer metamaterial (red line). ... 83 Figure 6.6: Transmitted phase of metamaterial structure for two (blue line),
three (red line), four (green line), and five (purple line) NIM layers between (a) 14.2 and 14.8 GHz (left-handed transmission regime) and (b) 18.9 and 19.4 GHz (right-handed transmission regime). ... 85
xviii
Figure 6.7: (a) Schematic drawing of a simulated NIM structure with an alternative unit cell. Simulated E-field profile evaluated at (b) 14.42 GHz and (c) 17.00 GHz. ... 86 Figure 7.1: Schematic drawings of a subwavelength aperture in a metallic plate
and SRR plane (a) parallel, and (b) perpendicular to the aperture plane. ... 90 Figure 7.2: Measured transmission spectra from a single SRR with four
different orientations. ... 91 Figure 7.3: Measured intensity of transmitted EM wave from only aperture,
and aperture covered with CRR, SRR (A) and SRR (B). ... 92 Figure 7.4: Simulated intensity of transmitted EM wave from only aperture,
and aperture covered with CRR, SRR (A) and SRR (B). ... 94 Figure 7.5: Measured and simulated intensity of transmitted EM waves from a
single aperture covered with (a) SRR (D) and (b) SRR (C). ... 95 Figure 7.6: Enhancement factors obtained from the measurements and
simulations for configurations (C) and (D). ... 96 Figure 7.7: Simulated Ey magnitude for an aperture and (a) SRR (A), (b) SRR
Chapter 1
1
Introduction
Electromagnetic waves play key role in our daily life, since they are essential for many applications including communication, imaging, sensing and devices like antennas, light sources, optical fibers, lenses, etc. Spanning from extremely low frequencies up to Gamma rays, the electromagnetic wave phenomena always received great interest and scientists widely studied the interaction of waves with the matter. Propagation of electromagnetic waves in free space is less interesting. It is the interaction between waves and materials that led to the many applications and devices listed above. Transmission, reflection, refraction, diffraction are among the many affects resulting from the interaction between waves and materials. Materials response to an incident electromagnetic wave is determined by their macroscopic electromagnetic parameters, namely the dielectric permittivity (ε) and the magnetic permeability (µ). Ordinary materials usually have positive values of ε and µ. The response from the ordinary materials is only a small fraction that one can access theoretically. Material responses could be extended to the values that are not readily available by designing artificial structures, so called metamaterials. The phrase “Meta” is borrowed from Greek meaning “beyond”. Materials are composed of atoms that are much smaller than the wavelength of light. To describe the interaction of light with a material, one can take an average
CHAPTER 1. INTRODUCTION 2
over the atomic scale, so that the atomic details are not important. It is then considered as a homogeneous medium and one can define the electromagnetic parameters; the permittivity and the permeability to describe the electromagnetic response. An analogy could easily be established with the metamaterials, where their building blocks, the meta-atoms, are much smaller than the wavelength of the electromagnetic wave and thus one can assign effective permittivity and permeability. What makes metamaterials so interesting is that one can tailor the electromagnetic parameters to have any desired value within theoretical limits, including negative ones.
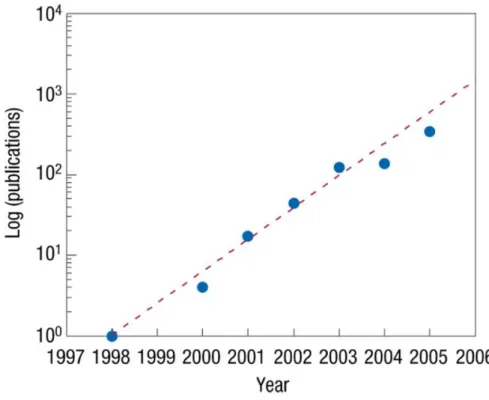
The interest in metamaterial research started at the beginning of 21th century, after the successful demonstration of a metamaterial with simultaneously negative values of dielectric permittivity and magnetic permeability [1]. However, it was forty years ago, at 1968, when a Russian physicist dreamed about a conceptual material in which ε and µ are both negative [2]. His dream had to wait for forty years, since negative value of permeability was a hidden treasure that is later discovered by Sir John B. Pendry in 1999 [3]. The term left-handed material is coined by Veselago for such structures having simultaneously negative values of ε and µ. Refractive index then possesses negative values that are not achievable with known materials. A negative index reverses many of known optical affects and changes the way we treat optics and electromagnetism. After 2000, there has been a growing interest in metamaterials where the number of papers in metamaterials, negative refraction and related studies doubled every ten months (Fig. 1.1), following an effective Moore’s Law [4]. Although it has been eight years since the beginning of the metamaterial field, we witnessed publication of five books on this specific topic, indicating the interest of scientific community to metamaterials [5-9]. Even a journal named “Metamaterials” has been launched by Wiley.
CHAPTER 1. INTRODUCTION 3
Figure 1.1: The number of articles published in SCI journals on the topics of metamaterials and negative refraction. (after [4])
1.1. Motivation
Metamaterials offer a wide range of exciting physical phenomena that are not attainable with ubiquitous materials. Artificial magnetism is among one of the exotic electromagnetic property of metamaterials. Magnetic response could be attained from non-magnetic materials by designing structures into capacitive and inductive elements. An example of such structures is a split-ring resonator. One can tailor the magnetic permeability to any desired value including negative values. This in turn brings the possibility of engineering metamaterials with a negative-index provided that effective permeability and permittivity of the resulting structure are simultaneously negative within a frequency range [10]. Metamaterials are not the only route to achieve negative refraction. Photonic
CHAPTER 1. INTRODUCTION 4
crystals are proposed for refracting electromagnetic waves negatively, where the permittivity and permeability are both positive [11-15]. Plasmonic effects could also be used at optical frequencies to yield negative refraction [16]. Negative refraction is also demonstrated by using semiconductor metamaterials [17].
Figure 1.2: Some applications of metamaterials. (a) Superlens (after [28]), (b) magnifying hyperlens (after [30]), (c) cloaking device (after [32]).
CHAPTER 1. INTRODUCTION 5
One of the most exciting applications of negative-index metamaterials (NIM) is a perfect lens. Stimulated by J. B. Pendry’s seminal work [18], superlenses that are capable of imaging subwavelength size objects (Fig. 1.2(a)) attracted great deal of interest [19-28]. Hyperlenses composed of anisotropic metamaterials with hyperbolic dispersion are alternative imaging systems (Fig. 1.2(b)) providing magnification of small objects [29-31].
Although the scientists focused their efforts specifically to negative permeability and negative index metamaterials at the beginning, later it was found out that there are many interesting regions at the electromagnetic parameter space that can be accessed by metamaterials. It is possible to construct a cloaking device (Fig. 1.3(c) that could be used to “hide” an object inside it provided that either 0 < ε < 1, or 0 < µ < 1 [32-34]. Another interesting application is supercoupling, tunneling and electromagnetic energy squeezing through very narrow channels by utilizing metamaterials with near-zero parameters, i.e. ε ~ 0 or µ ~ 0 [35-37].
Metamaterials are geometrically scalable, thus offering a wide range of operation frequencies including radio [38, 39], microwave [40-52], millimeter-wave [53], far infrared (IR) [54], mid-IR [55, 56], near-IR frequencies [57-60] and even visible wavelengths [61, 62].
1.2. Outline of this thesis
In this thesis, we investigate the properties of metamaterials at microwave frequencies. Although the core of this thesis is based on the experimental measurements, numerical simulations are also utilized to understand the physical mechanisms and verify the measured results.
In Chapter 2, the building block of a left-handed metamaterial (LHM), split-ring resonators (SRR) are studied in detail. Starting from a single SRR unit cell and verifying the origin of resonances, we have been successfully demonstrated
CHAPTER 1. INTRODUCTION 6
the magnetic resonance behavior. Periodic arrays are then formed to obtain an effective medium giving negative values of permeability. Detailed experimental and numerical studies are performed to understand the dependence of SRR’s parameters on the magnetic resonance frequency. This section is concluded with a capacitor-loaded split-ring resonator structure that is utilized to tune the magnetic resonance frequency of SRR.
Chapter 3 is devoted to the characterization of negative-index metamaterials that is obtained by combining SRR-arrays together with a thin-wire media. The section starts with a small discussion about negative permittivity structures at microwave frequencies where the experimental results are presented. Transmission and reflection characteristics of one-dimensional left-handed metamaterials are provided. Effective parameters of the corresponding LHM structure are retrieved from the calculated transmission and reflection amplitudes and phases. Negative refraction is then demonstrated by using two different experimental methods, namely refraction from a wedge-shaped LHM and from a slab-shaped LHM. Finally, phase shift between the consecutive number of layers of LHM structure is measured to be negative at frequencies where both permittivity and permeability were negative, indicating a negative phase velocity.
Verifying the negative-index for the metamaterial structures, we took an additional step to demonstrate the proposed flat-lens focusing behavior in Chapter 4. A slab-shaped LHM lens is used to focus a point source that is not achievable with a lens made of positive-index material. The chapter discusses the image formation for the sources located outside the lens, as well as the case when the sources are embedded within the flat-lens.
Chapter 5 describes the experimental demonstration of a negative-index metamaterial (NIM) based superlens that is capable of imaging subwavelength objects with a resolution of λ/8. The superlens was operated at an impedance-matched frequency to assure that the losses due to the reflection are kept at the minimum level. Moreover, subwavelength resolution is achieved with two point
CHAPTER 1. INTRODUCTION 7
sources separated by a distance eight times smaller than the wavelength. The effect of thickness of the superlens on the resolving power is experimentally studied, in which a thicker superlens resulted in a lower resolving power due to increased losses.
A planar metamaterial composed of metallic slab and wire pairs is shown to be a promising alternative to the SRR-wire type metamaterials in chapter 6. These metamaterials are also named as fishnet type NIMs is characterized at microwave frequencies and retrieved effective parameters verified a negative-index frequency band. Phase measurements are performed to demonstrate the negative phase advance in these structures. Further numerical simulations showed that the backward-wave propagation within NIM structure, supporting the negative-phase velocity behavior.
In chapter 7, we proposed and demonstrated enhanced transmission from a single subwavelength aperture by placing a single split-ring resonator at the near-field of the aperture. The aperture radius is λ/20, the smallest aperture known for achieving enhanced transmission. One can employ electric and/or magnetic resonance of SRR structure to yield extraordinary transmission properties.
Chapter 2
2
Magnetism from split-ring
resonators
2.1. Introduction
The response of materials to the incident magnetic field is determined by magnetic permeability. Magnetic permeability is positive in usual materials. The absence of the negative values of magnetic permeability provided little motivation for studying negative-index materials. Because of the lack of magnetic charge analogous to an electric charge, it is more difficult to obtain a material with negative magnetic permeability. To obtain negative permeability, one has to extend the magnetic properties of the materials. In 1999, Pendry et al. introduced several configurations of conducting scattering elements displaying a magnetic response to an applied electromagnetic field when grouped into an interacting periodic array [3]. The resonant behavior of SRRs is due to the capacitive elements (gaps and splits), which in turn results in rather high positive and negative values of permeability near the magnetic resonance frequency (ωm).
CHAPTER 2. MAGNETISM FROM SPLIT-RING RESONATORS 9
Figure 2.1: Schematic drawings of (a) Single unit cell of SRR, (b) Single unit cell of CRR.
Figure 2.1(a) shows the design of Pendry, described as a split ring resonator (SRR). In a split ring resonator there are two rings both having a split. By having splits in the rings, the SRR unit can be made resonant at wavelengths much larger than the diameter of the rings. The purpose of the second split ring, inside and whose split is oriented oppositely to the outside split, is to generate a large capacitance in the small gap region. The gap between the rings prevents current from flowing around any one ring. However, there is a considerable capacitance between the two rings, which enables current to flow.
2.2. Resonances of a single split-ring resonator
In this section, we studied transmission through a single unit cell of SRR in order to gain an understanding of the resonant behavior of SRR. Split-ring resonators under investigation are built from concentric metal rings on a dielectric printed
CHAPTER 2. MAGNETISM FROM SPLIT-RING RESONATORS 10
circuit board with a thickness of 1.6 mm and ε = 3.85 [46]. A schematic drawing of split ring resonator can be seen in Fig. 2.1(a). The width of the splits and the gap between the inner and outer rings are 0.2 mm, the metal width is 0.9 mm, and the outer radius is 3.6 mm. The deposited metal is copper with a thickness of 30 μm. We also fabricated a ring resonator structure in which the splits are removed [46]. The resulting structure is named conventionally as a closed ring resonator (CRR) and shown schematically in Fig. 2.1(b).
Figure 2.2: Experimental setup for measuring transmission through a single unit cell of SRR structure. The structure is placed between two monopole antennas.
The resonance behavior could be observed from the frequency response of single SRR[47, 63-65]. Two monopole antennas are used to transmit and detect the EM waves through the single SRR unit cell. The monopole antenna was constructed by removing the shield around one end of a microwave coaxial cable. The exposed center conductor which also acted as the transmitter and receiver was
CHAPTER 2. MAGNETISM FROM SPLIT-RING RESONATORS 11
on the order of λ/2, arranged to work at the frequency range covering the magnetic resonance frequency (ωm) of the SRR structures. A single SRR is placed between the monopole antennas as shown in Fig. 2.2. The distance between the monopole and SRR unit cell is 6 mm. Monopole antennas are then connected to the HP-8510C network analyzer to measure the transmission coefficients. First we measured the transmission spectra in free space (i.e. without SRR unit cell) which is used as the calibration data for the network analyzer. Then, SRR unit cell was inserted between the monopole antennas, and we performed the transmission measurements by maintaining distance between the transmitter and receiver monopole antennas fixed.
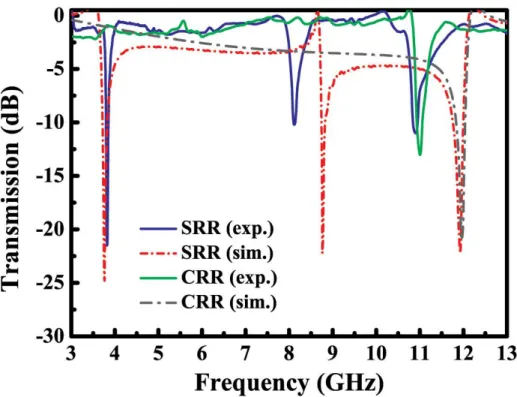
Figure 2.3: Measured and simulated frequency responses of single SRR and CRR structures.
CHAPTER 2. MAGNETISM FROM SPLIT-RING RESONATORS 12
We first measured the frequency response of the single split ring resonator and closed ring resonator unit cells. The measured frequency response of single SRR (blue line) and single CRR (green line) is provided in Fig. 2.3. As seen in the figure, three transmission dips were observed at the frequencies 3.82, 8.12, and 10.90 GHz throughout the transmission spectrum of single SRR [65, 66]. On the other hand, a single dip was observed at 10.92 GHz for a single CRR.
We also performed simulations to check the experimental results. Simulations are performed by using commercial software, CST Microwave Studio which is a 3D full-wave solver, employing the finite integration technique (FIT). In order to determine the resonance frequencies of the structures under consideration, we have included one layer of the SRR structures along the propagation direction. In the simulation setup, the structures are subjected to an incident plane wave. Open boundary conditions are employed along the propagation direction. Periodic boundary conditions are used along the directions other than the propagation direction. Hence, the structure is assumed to be periodic and infinite along the directions that are perpendicular to the propagation direction. The transmission amplitudes are obtained by measuring the fields at a distant point from the structures. This point was chosen such that beyond this point the transmission coefficients do not change with the increasing distance. Such a choice was made to exclude the near-field effects due to the highly resonant nature of the structures under consideration. The simulated frequency responses of SRR (red dashed-dotted line) and CRR (grey dashed-dashed-dotted line) are given in Fig. 2.3. The simulations agree well with the experiments.
The splits in the split ring resonators structure play a key role in obtaining magnetic resonance. Removing the splits prevents the current from flowing between the inner and outer rings, and therefore, the magnetic resonance is no longer present. Based on this principle, we observed two magnetic resonances for split ring resonator structure at ωm1= 3.82 GHz and ωm2= 8.12 GHz. Notice that the wavelength is 7.86 cm, whereas the diameter of the SRR structure is 7.2 mm.
CHAPTER 2. MAGNETISM FROM SPLIT-RING RESONATORS 13
Therefore, by employing the aforementioned SRR structure with sizes corresponding to the 1/11th of free space wavelength, magnetic resonance can be obtained. The wavelength in the material (4.0 cm) is even approximately 1/6th of structure size. The reason why SRR received a great amount of interest is not only because of being a source for negative permeability, but also for achieving resonance with subwavelength features. Therefore, an effective medium theory becomes applicable for SRR media, and LHMs.
Split ring resonator not only exhibits magnetic resonance induced by the splits at the rings, but electric resonance is also present via the dipole-like charge distribution along the incident electric field [46, 49]. Such an electric resonance behavior is observed at ωe=10.90 GHz for the split ring resonator and closed ring resonator unit cells.
Figure 2.4: Simulated electric field intensity profile at the magnetic resonance frequency of the split ring resonator.
CHAPTER 2. MAGNETISM FROM SPLIT-RING RESONATORS 14
We have simulated the electric field intensity at the magnetic resonance frequency of SRR, 3.82 GHz. Electric field monitor is placed at the resonance frequency and the resulting intensity profile is plotted in Fig. 2.4. The intensities are normalized with respect to the maximum intensity value. It is clear that the electric field is concentrated at the splits and the gaps between the concentric rings. The strongest localization occurred at the outer ring’s split region. The E-field is also localized at the inner split region and gap region but localization is not as strong as the case in the outer split region [67].
Figure 2.5: Simulated magnetic field magnitudes of a single SRR at (a) 3.82 GHz, and (b) 11.92 GHz.
We also performed simulations in order to monitor the magnitude of the magnetic field at the SRR structure. The simulations were performed at 3.82 GHz and 11.92 GHz, which correspond to the transmission dip in the simulated transmission spectrum of SRR (former is the magnetic, latter is the electrical resonance) [65]. The magnitude of the magnetic fields is shown in Fig. 2.5. As clearly seen in Fig. 2.5(a), a circular current is present at the SRR. Such a circular current excites the magnetic resonance, and therefore, a transmission dip was observed at 3.82 GHz in simulations. However, the behavior of the magnetic field
CHAPTER 2. MAGNETISM FROM SPLIT-RING RESONATORS 15
changes at 11.92 GHz (see Fig. 2.5(b)). The direction of the current flow is not circular, but rather an up-down direction. Since the current is not circular the magnetic resonance cannot be excited. The transmission dip at this frequency can only be due to the electrical resonance of the ring resonator structure.
2.3. Negative permeability media: Periodic arrays
of split ring resonators
In the previous section we studied frequency response of single SRR and CRR unit cells. If these structures are combined together, the coupling between the resonators results in band gaps around the resonance frequencies. By combining the SRRs into a periodic medium, such that there is strong magnetic coupling between the resonators, unique properties emerge from the composite and isotropy can be achieved. One of the unique properties is the availability of negative values of permeability.
CHAPTER 2. MAGNETISM FROM SPLIT-RING RESONATORS 16
To obtain negative permeability, we periodically arranged SRR structures. The number of unit cells along the x, y, and z directions are Nx = 10, Ny = 15, and Nz = 25, with lattice spacings ax = ay = 8.8 mm and az = 6.5 mm. The directions can be seen in Fig. 2.2. The wavevector is along the x direction, while E-field is along the y direction, and H-field is along the z direction. Experimental setup for measuring the transmission-amplitude and transmission-phase spectra consists of a HP 8510C network analyzer, and standard high gain microwave horn antennas as shown in Fig. 2.6.
Figure 2.7 shows the measured and simulated transmission spectra of periodic SRRs and CRRs. The first band gap between 3.55-4.05 GHz is observed at the transmission spectrum of SRR array but not in CRR array. However, the second band gap between 8.15-11.95 GHz is observed for both cases. As clearly seen in the figure, the agreement between the measured and simulated data is good.
CHAPTER 2. MAGNETISM FROM SPLIT-RING RESONATORS 17
Based on the measurements and simulations, we can safely claim that the stop bands of split ring resonator media cannot be assumed as a result of “negative μ” behavior. Some of the observed gaps (such as the second band gap in this measurement) in the transmission spectra could also originate from the electrical response of the split ring resonators or from Bragg gaps due to periodicity [46]. The band gap between 3.55-4.05 GHz is due to the magnetic response of split ring resonators. However, the stop band 8.15-11.95 GHz appeared due to the electrical response of the concentric rings.
2.4. Effect of SRR parameters on magnetic
resonance frequency
The SRR structure has capacitive elements that increase the response of the material to the incident EM radiation. Capacitance due to the splits prevents current to flow around the rings but the mutual capacitance between the two rings enables the flow of the current through the structure. Since SRRs play an important role for the construction of LHMs with negative index, considerable amount of effort has been given to understand the underlying physics of these negative permeabiltiy materials [68-79]. There are several analytical models in the literature studying the magnetic and electrical resonances of SRRs. It is possible to model an individual SRR as an L-C circuit system Total capacitance of the SRR system has mainly two contributions, one arising from the splits and the other from the gap between the concentric rings. Inductances arise from the conducting rings and gap between inner and outer rings. In this section we will investigate certain geometrical parameters like split width, gap between the rings, metal width and additional capacitors and their effect on ωm [63].
CHAPTER 2. MAGNETISM FROM SPLIT-RING RESONATORS 18
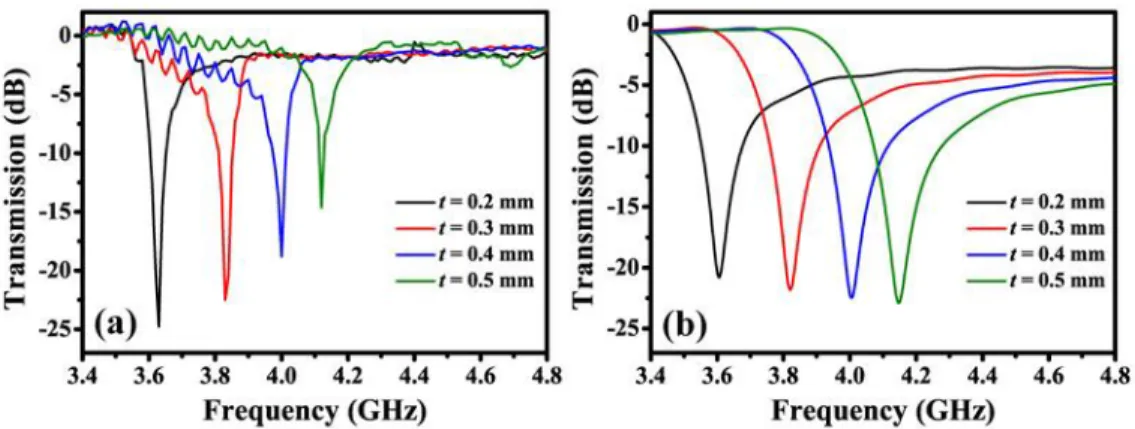
2.4.1. Effect of split width
Schematic drawing of an individual SRR is given in Fig. 2.1(a), with parameters split width (d), gap distance (t), metal width (w) and radius of the outer ring (r). Initially the parameters are taken to be d = t = 0.2 mm, w = 0.9 mm and r = 3.6 mm. By keeping other parameters constant, we only changed the split width (d) of SRRs.
Figure 2.8: Transmission spectra of individual SRRs with different split widths obtained via (a) experiment, and (b) simulation.
Figure 2.8(a) displays the measured transmission spectra of 4 SRR structures with different split widths (d = 0.2, 0.3, 0.4 and 0.5 mm). A dip in the transmission spectra was observed for all SRR structures. Figure 2.8(b) shows the simulated transmission spectra and there is a good agreement between experimental results and numerical simulations.
The splits behave like a parallel plate capacitor. We can think of two metal plates of thicknesses 30 μm and widths 0.9 mm are placed with a distance d away from each other. Since we increase the split width, the capacitance due to splits will decrease, which in turn will decrease the total capacitance of the system.
CHAPTER 2. MAGNETISM FROM SPLIT-RING RESONATORS 19
Previously developed analytical models of SRRs [75, 76] predict the same behavior: Decreasing the capacitance of the system will increase the resonance frequency. Therefore experimental results and simulations provided in this section agree well with the analytical models in the literature [75, 76].
2.4.2. Effect of gap distance
In this section we studied the effect of gap between inner and outer rings on ωm of SRR structures. The other parameters are kept constant (d = 0.2 mm, w = 0.9 mm and r = 3.6 mm), and only gap distance (t) is varied from 0.2 to 0.5 with 0.1 mm steps. Since we fixed the radius of the outer ring, increasing the gap distance will also decrease the size of the inner ring.
Figure 2.9: Transmission spectra of individual SRRs with different gap distances obtained via (a) experiment, and (b) simulation.
Figure 2.9(a) and (b) display the measured and simulated transmission spectra of SRRs with different gap distances. Resonant behavior is observed both experimentally and numerically at similar frequencies. Increasing the distance between inner and outer rings, results in an increase of the magnetic resonance frequency of SRR structure.
CHAPTER 2. MAGNETISM FROM SPLIT-RING RESONATORS 20
Changing the distance between the inner and outer rings will change the mutual capacitance and mutual inductance between the rings. Analytical model by Sauivac et al. proposes that increasing the gap distance, decreases both mutual capacitance and mutual inductance of the equivalent LC circuit of SRR system [75]. By following the formulation of the model given in [75], ωm is found to increase with increasing gap distances, that agrees with the results of experiments and simulations.
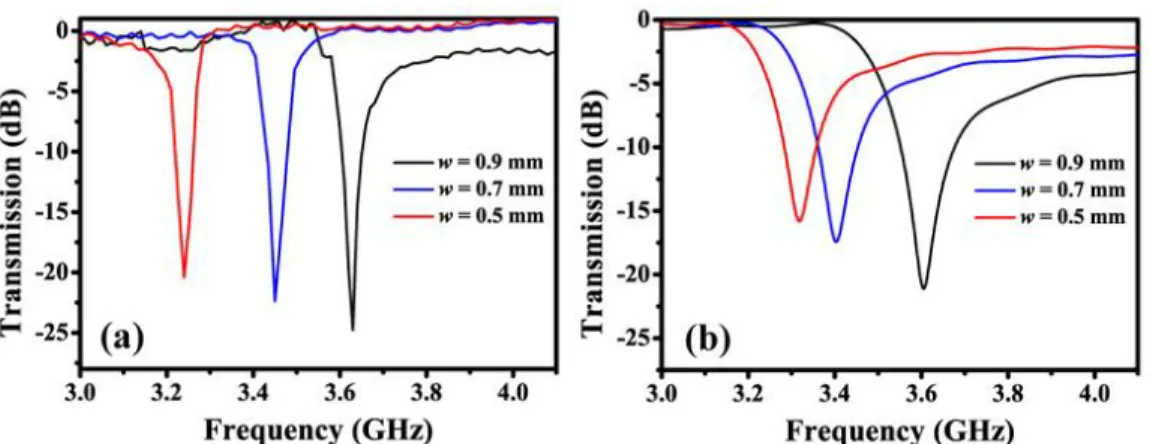
2.4.3. Effect of metal width
In this section we changed the metal width of both inner and outer rings. The other parameters are kept constant (d = t = 0.2 mm, and r = 3.6 mm). Keep in mind that by fixing the radius of the outer ring, the size of the inner ring is larger for narrower ring configurations.
Figure 2.10: Transmission spectra of individual SRRs with different metal widths obtained via (a) experiment, and (b) simulation.
Figure 2.10(a) and (b) display the measured and simulated transmission spectra of SRR structures with different metal widths (w = 0.5, 0.7, and 0.9 mm). Both experiments and simulations predict that ωm increases with increasing metal width.
CHAPTER 2. MAGNETISM FROM SPLIT-RING RESONATORS 21
Metal width affects all capacitances and inductances due to analytical model of Sauivac et al. [75]. Increasing the metal width will decrease the mutual inductance and mutual capacitance. Therefore SRRs made of thinner rings will have smaller resonant frequencies. This result agrees with both experiment and simulations reported in this section.
2.5. Capacitor-loaded split-ring resonators as
tunable metamaterial components
Total capacitance of the SRR system has mainly two contributions. The first one is the capacitance at the split regions and the second contribution is from the gap between the concentric rings. These capacitances together with the inductances from the rings, determine the m of the resonator structure. Changing the capacitance and inductance values results in a change in m of SRRs, as expected from an L-C circuit. Surface mount capacitors with various capacitance values are placed at three different capacitive regions of SRRs. Namely, (i) the gap region between inner and outer rings, (ii) outer ring’s split region and (iii) inner ring’s split region [67]. The photographs of the SRRs loaded with capacitors are given in the insets of Fig. 2.11 (a), (b) and (c), respectively.
Figure 2.11: SRR with capacitor loaded (a) in the gap region between concentric rings, (b) in the outer split region, and (c) in the inner split region
CHAPTER 2. MAGNETISM FROM SPLIT-RING RESONATORS 22
The magnetic resonance frequencies of SRRs as a function of capacitances loaded at different capacitive regions are shown in Fig. 2.12 with corresponding data points. Magnetic resonance frequency of SRR without any additional capacitance is measured at 3.82 GHz. It is clear from figure that the highest amount of tuning can be achieved by loading capacitances at the outer split region.
Figure 2.12: Magnetic resonance frequency of a split ring resonator as a function of loaded-capacitances at different capacitive regions. Solid lines are the results obtained from the numerical models.
In general the split capacitances are relatively small and can be ignored. However, if a capacitor is loaded in the split region, the split capacitance becomes important and affects resonance frequency as observed in our study. In ref. [76] and [74], the capacitances due to the splits were taken into account; therefore we will use this model to compare our experimental results. The approximate formula for the lowest magnetic resonance frequency is given in [74] as:
CHAPTER 2. MAGNETISM FROM SPLIT-RING RESONATORS 23
1 2 1 2 / ( 2 av g s s m L C C C , (2.1)where Lav is the average inductance of the two rings, Cg is the capacitance due to the gap, Cs1 and Cs2 are capacitances due to the outer and the inner splits, respectively. By using the formula provided in [75], we calculated the gap capacitance as Cg=0.14 pF. The capacitances due to the splits are calculated to be Cs1=Cs2 =1.2 fF. Since the magnetic resonance frequency of our SRR structure is at m=3.82 GHz, putting the known parameters in (2.1) average inductance is found to be Lav=76.7 nH. The capacitors inserted at the split region is connected in parallel to the split capacitance, therefore we can insert Cs1=C in (2.1) and plot the corresponding curve for the outer split. Note that C is the capacitance value of the surface mount capacitor. The results obtained from the model are plotted with blue line in Fig. 2.12 and the results extremely agree well with experimental data. It is clear from the experimental observations that the effect of the capacitance in the inner split region is less than the outer split region. Therefore we can introduce a phenomenological factor in the model to obtain the best fit with the experimental data. In (1) if we put 0.4×Cs2 instead of Cs2, the red line in Fig. 2.12 is obtained. As clearly seen, the match between the model and the experimental results are quite good.
As a comparison, m shifted down to 2.86 GHz with a 3.3 pF capacitor loaded at the gap region. But same amount of tuning has been achieved with a 0.1 pF capacitor at the split region of the outer ring. To reduce m down to 2.86 GHz, a capacitor with capacitance value between 0.2-0.4 pF is required to be loaded at the inner ring’s split region. Instead of mounting varactors at the gap region, putting them at the split regions should result in higher tunability ranges for SRR structures. The highest tunability range is achieved with capacitors at the outer ring’s split region.
CHAPTER 2. MAGNETISM FROM SPLIT-RING RESONATORS 24
It is worth mentioning at this point that by loading capacitor at the split region of the outer ring with a value of C = 2.2 pF, we managed to obtain m at 0.99 GHz. To our knowledge, this is the highest reduction of resonance frequency of SRR. The diameter of the SRR structure is 7.2 mm and the free-space wavelength at 0.99 GHz is 303 mm. Therefore magnetic resonance is achieved by using a subwavelength structure with a size of /42.
Chapter 3
3
Negative Index Metamaterials
3.1. Introduction
Metamaterials have become a remarkable research area in recent years and received burgeoning interest due to their unprecedented properties unattainable from ordinary materials. Generally speaking, the dielectric permittivity (ε) and the magnetic permeability (μ) are both positive for natural materials. In fact, it is possible to obtain negative values for ε and μ by utilizing proper designs of metamaterials. To be specific, negative permittivity values at microwave frequencies are accessed by making use of thin metallic wire meshes [80-82]. It is rather difficult to obtain negative permeability due to the absence of magnetic charges. Pendry et al. came up with a brilliant solution and employed an array of split ring resonators exhibiting negative effective permeability (μeff) values for frequencies close to the magnetic resonance frequency (ωm) of the split ring resonators [3]. The first steps to realize these novel type of materials were taken by Smith et al., where they were able to observe a left-handed propagation band at frequencies where both dielectric permittivity and magnetic permeability of the composite metamaterial are negative [1, 40]. Soon after, left-handed metamaterials
CHAPTER 3. NEGATIVE INDEX METAMATERIALS 26
with an effective negative index of refraction are successfully demonstrated by various groups [10, 43, 45, 50].
In this chapter, we investigate the transmission, reflection and refraction properties of such metamaterials comprised of split-ring resonator and wire arrays yielding left-handed electromagnetism.
3.2. Left-handed metamaterials: Transmission
properties
In this section we study the transmission properties of left-handed metamaterials composed of periodic SRR and wire arrays as shown in Fig. 3.1(a).
Figure 3.1 (a) A layer of 1D LHM composed of SRR and wire arrays, and (b) composite metamaterial (CMM) composed of CRR and wire arrays.
CHAPTER 3. NEGATIVE INDEX METAMATERIALS 27
3.2.1. Negative permittivity
The electromagnetic response is dominated by negative permittivity concept in the visible and UV frequency regions. However, at lower frequencies starting from the near infrared and downwards, dissipation asserts itself, therefore dielectric function becomes imaginary. To achieve negative permittivity values at microwave range, the thin metallic wire concept is proposed [80-82].
By assembling thin metallic wire structures into a periodic medium with appropriate parameters, negative permittivity can easily be achieved at microwave frequencies. Plasma frequency of the thin metallic wires is given after detailed calculations as [80]
)
/
ln(
2
2 2 0 0 2 2r
a
a
c
m
ne
eff p
(3.1)where c0 is the speed of light in free space, a is the lattice parameter and r is the radius of the wires.
The metallic wires were structured on a scale much less than the wavelength of radiation. When the wavelength of the incident radiation is much larger than the size and spacing of a collection of scatterers, the response of the scatterers to the incident fields can be treated by way of the effective medium theory. 1 0
2
c
a
(3.2)In the thin wire case, the effective medium theory holds since corresponding λ for ωp is much larger than the radius of the wires. Therefore, an effective dielectric permittivity, εeff can be used to define the permittivity of the medium. As far as external electromagnetic radiation is concerned, a thin wire structure appears as an
CHAPTER 3. NEGATIVE INDEX METAMATERIALS 28
effectively homogeneous dielectric medium whose internal structure is only apparent as it dictates εeff.
To demonstrate the negative permittivity concept we constructed a periodic array of thin wire structures. The length and width of the continuous thin wire structures are l = 19 cm, and w = 0.9 mm. The array is formed with Nx = 5, Ny = 15, and Nz = 32 unit cells, with lattice spacings ax = ay = 8.8 mm and az = 6.5 mm [46]. Red line in Fig. 3.2 displays the transmission spectra of a thin-wire media. The plasma frequency is located at 8.0 GHz, below which the EM waves are not transmitted since the permittivity is negative.
Figure 3.2: Measured transmission spectra of periodic wire (blue line), and CMM (red line) arrays.
SRRs, in addition to their resonant magnetic response at m, exhibit a resonant electric response at 0. This behavior is similar to the electric response of a system of cut-wires (wires of finite length) which exhibits a stop band with a well-defined
CHAPTER 3. NEGATIVE INDEX METAMATERIALS 29
lower edge due to the discontinuous nature of the wires. The SRR structures contribute to the effective permittivity of the CMM, causing a downward shift on the plasma frequency determined solely from wire structures. To demonstrate this effect, a CMM consisting of periodic alternating layers of CRRs and wires is used (Fig. 3.1(b). Thickness, length and the width of the wires are 30 m, 19 cm and 0.9 mm respectively. While the plasma frequency of the wire-only structure is around 8 GHz, the plasma frequency is reduced down to 5.3 GHz for the CMM structure since both CRRs and wires respond together to electric field. As one can see from Fig. 3.2, the plasma frequency of the CMM is much lower than that of the wires alone. Therefore it is important to determine whether the shift in plasma cut-off frequency covers the magnetic resonance gap, which would render the CMM as a right-handed medium. This effect must be taken into account in left-handed metamaterial designs.
3.2.2. Left-handed metamaterial
Left-handed metamaterials are composite structures in which the electromagnetic response is determined by effective electromagnetic parameters. Left-handed behavior is achievable with the combination of structures that give rise to negative permittivity and negative permeability separately. In this work, we combined thin wire media providing negative permittivity and SRR array providing negative permeability to obtain a metamaterial with left-handed electromagnetism. A schematic drawing of a left-handed metamaterial sample is provided in Fig. 3.1(a). The length and width of the continuous thin wire structures are l = 19 cm, and w = 0.9 mm. The left-handed material is composed of Nx = 5, Ny = 15, and Nz = 32 unit cells, with lattice spacings ax = ay = 8.8 mm and az = 6.5 mm. Note that the lattice spacings are kept same with the lattice spacing of only split ring resonator medium studied in the previous section.
CHAPTER 3. NEGATIVE INDEX METAMATERIALS 30
Figure 3.3: Transmission spectra of periodic SRR (blue line), LHM (red line) and CMM (black line) arrays obtained from (a) measurements and (b) numerical simulations.
Figure 3.3(a) depicts the measured transmission spectra of SRR (blue line), LHM (red line) and a composite metamaterial (CMM) composed of CRR and wire arrays (black line) with 5 unit cells along the propagation direction. The band gap in the transmission spectrum of SRR between 3.55-4.05 GHz is shown to be due to magnetic resonance in the previous section, therefore effective magnetic
CHAPTER 3. NEGATIVE INDEX METAMATERIALS 31
permeability is negative within this frequency range. The plasma frequency of the CRR and wire array that is used to construct the left-handed material is shown to be at 8.0 GHz in the previous section. Therefore below 8.0 GHz, the effective permittivity of wire array is negative. The condition for the formation of left-handed transmission band is that the effective and μ should be simultaneously negative at a particular frequency range. As seen in Fig. 3.3(a), a transmission band (shaded region in the figure) is observed between 3.55 and 4.05 GHz. The transmission peak is measured to be -0.8 dB at 3.86 GHz. This is the highest transmission peak measured for a LHM structure.
For the composite metamaterial of CRR and wire arrays, the transmission band disappeared. We indicated that the wire media has plasma frequency around 8 GHz. SRR and CRR structures have also electric responses and therefore contribute to the total electric responses of the composite systems (LHM and CMM). Resulting LHM has a plasma frequency around 5.3 GHz, therefore the plasma frequency is reduced down. We performed numerical simulations to check the validity of the experimental results. Numerical simulation results are provided in Fig. 3.3(b) and predict the lefthanded transmission band with peak value of -2.7 dB between 3.60 - 4.10 GHz.
3.3. Reflection properties of left-handed
metamaterials
In this section we present the reflection measurements of a 1D LHM structure. In the measurements transmitter and receiver horn antennas were placed close to each other by keeping the angle between the antennas very small. The transmitter horn antenna sends the EM wave to the first surface of the structures and the receiver antenna measures the amplitude of the reflected EM waves. We used two different LHM structures with 5 and 10 layers along the propagation direction.
CHAPTER 3. NEGATIVE INDEX METAMATERIALS 32
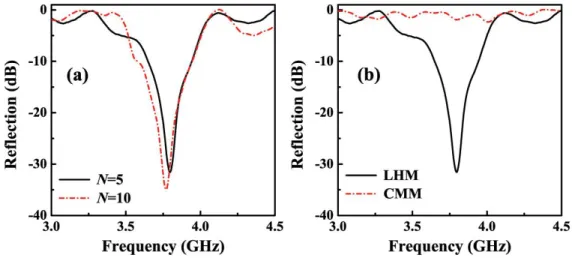
Figure 3.4: Measured transmission (black line) and reflection (red line) spectra of (a) 5 layer and (b) 10 layer 1D LHM.
Figure 3.4(a) plots the measured transmission and reflection spectra of a 5-layer LHM [66, 83, 84]. In the reflection spectrum, we observed a sharp dip at 3.79 GHz with a minimum value of -31.2. Figure 3.4(b) shows the measured transmission (black line) and reflection (red line) spectra for 10-layer 1D LHM. The transmission peak is measured to be -9.2 dB at 3.76 GHz. Expectedly, as the number of layers along the propagation direction increases, the transmission within
CHAPTER 3. NEGATIVE INDEX METAMATERIALS 33
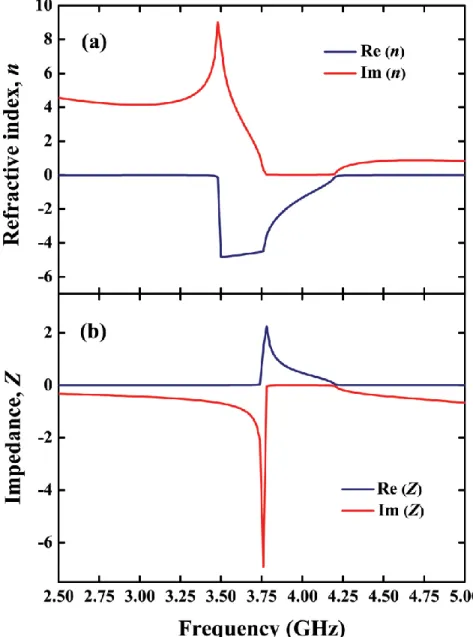
the left-handed transmission band decreases due to the losses. The minimum reflection is measured to be -35.0 dB at 3.77 GHz. The incident EM waves with frequencies around 3.77 GHz are almost transmitted through the left-handed material without being reflected at the left-handed material-air interface. The low reflection from the surface can be attributed to either matched impedance at the interface or to the thickness resonance of the slab. In the next section, we will show by extracting the effective parameters using retrieval procedure, that the impedance is matched to the free space. Impedance matching is desired for NIM structures, since it is required to achieve a perfect lens.
To provide a comparison, reflection spectra of two different numbers of layers are plotted in Fig. 3.5(a). The solid line is the reflection spectrum of 5 layers, whereas the dashed-dotted line corresponds to that of a 10-layer LHM structure. The dip at the reflection spectrum of LHM with 5 layers is measured to be at 3.79 GHZ with a dip value of -31.2 dB. The frequency where the reflection dip is observed nearly did not change although the structure’s thickness is reduced by half. Therefore, the impedance matching cannot be due to the thickness resonance.
Figure 3.5: Measured reflection spectra of (a) 5 and 10 layers 1D LHM, (b) reflection spectra of 5 layers LHM and CMM structures.