GENETICALLY PROGRAMMED ENGINEERED CELLS FOR BIOMATERIALS SYNTHESIS
A THESIS SUBMITTED TO
THE GRADUATE SCHOOL OF ENGINEERING AND SCIENCE OF BILKENT UNIVERSITY
IN PARTIAL FULFILLMENT OF THE REQUIREMENTS FOR THE DEGREE OF
MASTER OF SCIENCE IN
MATERIALS SCIENCE AND NANOTECHNOLOGY
By
BÜŞRA MERVE KIRPAT JANUARY 2021
GENETICALLY PROGRAMMED ENGINEERED CELLS FOR BIOMATERIAL SYNTHESIS
By Büşra Merve Kırpat January 2021
We certify that we have read this thesis and that in our opinion it is fully adequate, in scope and in quality, as a thesis of the degree of Master of Science.
Urartu Özgür Şafak Şeker (Advisor)
Bilge Baytekin
Emel Uzunoğlu Özyürek
Approved for the Graduate School of Engineering and Science:
Ezhan Karaşan
i ABSTRACT
GENETICALLY PROGRAMMED ENGINEERED CELLS FOR BIOMATERIALS SYNTHESIS
Büşra Merve Kırpat
M.S in Materials Science and Nanotechnology Advisor: Urartu Özgür Şafak Şeker
January 2021
Several organisms can process nanomaterials and producing in various sizes and morphologies in mild conditions by utilizing specific proteins. In sea sponges, silicatein proteins play a key role in synthesizing silica nanoparticles the precursor silicic acid. Silaffin proteins in diatoms can also biomineralize silica. One subunit of silaffin called R5 peptide has a key role for nucleation and initiation of the nanoparticle formation and it has been shown that bacteria synthesized R5 peptide has ability to precipitate silica structures. These silica nanostructures can be utilized in many areas. Silica-based cements take attentions to make them useful in restorative dentistry and endodontics. In this work, a synthetic cell system has reprogrammed autotransporter (Ag43) system to display R5 peptide fused with fluorescent proteins. After displaying the fused proteins on the surface of bacteria or secreting them into environment, whole cell or the proteins are used to precipitate silica in the presence of precursor such as tetramethyl orthosilicate (TMOS). These silica structures are used to evaluate their in vitro effects on the proliferation of dental pulp stem cells (DPSCs) and their osteogenesis.
ii ÖZET
BİYOMATERYAL SENTEZİ İÇİN GENETiĞi DEĞİŞTİRİLEREK PROGRAMLANAN HÜCRELER
Büşra Merve Kırpat
Malzeme Bilimi ve Nanoteknoloji, Yüksek Lisans Danışman: Urartu Özgür Şafak Şeker
January 2021
Çeşitli organizmalar, belirli proteinleri kullanarak nanomalzemeleri işleyebilir ve hafif koşullarda çeşitli boyutlarda ve morfolojilerde üretebilir. Deniz süngerlerinde, silikatin proteinleri, öncü silisik asit olan silika nanopartiküllerin sentezlenmesinde anahtar rol oynar. Diatomlardaki silaffin proteinleri ayrıca silikayı biyomineralize edebilir. R5 peptidi olarak adlandırılan bir silaffin alt birimi, nanopartikül oluşumunun nükleasyonu ve başlaması için anahtar bir role sahiptir ve sentezlenen bakterilerin R5 peptidinin silika yapılarını çökeltme kabiliyetine sahip olduğu gösterilmiştir. Bu silika nano yapılar birçok alanda kullanılabilir. Silika bazlı dolgu malzemeleri, restoratif diş hekimliği ve endodontide faydalı olmaları açısından dikkat çekerler. Bu çalışmada, sentetik bir hücre sistemi, floresan proteinlerle birleştirilmiş R5 peptidini görüntülemek için ototransporter (Ag43) sistemini yeniden programladı. Kaynaşmış proteinleri bakteri yüzeyinde gösterdikten veya çevreye salgıladıktan sonra, tetrametil ortosilikat (TMOS) gibi öncül varlığında silikayı çökeltmek için tam hücre veya proteinler kullanılır. Bu silika yapılar, dental pulpa kök hücrelerinin (DPKH'ler) ve bunların osteogenezinin çoğalması üzerindeki in vitro etkilerini değerlendirmek için kullanılır.
iii ACKNOWLEDGEMENTS
Firstly, I would like to thank my advisor Dr. Urartu Özgür Şafak Şeker. My adventure started with being a member of the iGEM team founded by Dr. Seker at Bilkent University as an undergraduate student and I was fascinated about the idea of engineering and reprograming living machines. This was the milestone of my career and I wanted to pursue my master’s program in Seker Lab the only lab that I wanted to be a member of this lab. I spent almost 5 years in this lab and the experiences It had made uncountable and unbelievably valuable attributions to my personality, my knowledge, my scientific character. I am awfully glad and proude to be a part of this lab. Also, I thank Bilge Baytekin and Emel Uzunoğlu Özyürek for being jury members of my thesis defense. Additionally, I thank Dr. Özyürek for helpful discussions and advices for providing the cell line and the process of cell culture experiments.
I would like to thank some special people, Julian Ostaku, Sıla Köse, Özge Beğli, Merve Yavuz and Cemile Elif Özçelik, they were always there for me and they made things bearable. I also thank Recep Erdem Ahan for scientific discussions. I would like to thank SBL members, Dr Ebru Aras, Ebru Şahin Kehribar, Merve Erden, Murat Alp Güngen, Nedim Hacıosmanoğlu, İlkay Çisil Köksaldı, Ahmet Hınçer, Gökçe Özkul, Anooshay Khan, Eray Ulaş Bozkurt, Yeldem Gizem Makas and former SBL members, Dr. Esra Yüca, Dr. Ebuzer Kalyoncu, Dr. Tolga Tarkan Ölmez, Dr. Elif Duman, Dr. Behide Saltepe, Musa Efe Işılak.
Also, I feel incredibly lucky to have precious friends, Oktay Yumşak, Mehmet Akif Demirer, Cansu Demir, Muammer Akay, Deniz Öztürk and İrem Şen from my high school and undergraduate education.
iv
Finally, I thank my family, my mom Sumru Kırpat, my dad Murat Kırpat, my brother Mustafa Murat Kırpat, my sister Melike Gülmine Kırpat and my grandmother Emine Kocakaya for their unrequited and unconditionally love and support. I also thank to the love of my life Lutfullah Muhammed Emre Konak for his patience, making me motivated and I am extremely excited to share the rest of my life. To sum up, without them I would not manage this process and I would not be here. This work was made possible by the funding from TÜBİTAK project number, 115M108.
v TABLE OF CONTENTS
CHAPTER 1 ... 1
INTRODUCTION ... 1
CHAPTER 2 ... 10
MATERIALS AND METHODS ... 10
2.1. Strains, Cell Maintenance, Growth Conditions, Mediums ... 10
2.2. Polymerase Chain Reaction (PCR) ... 11
2.3. Agarose Gel Electrophoresis ... 11
2.4. Digestion of DNA Fragments with Restriction Enzyme ... 12
2.5. DNA Isolation from Gel ... 12
2.6. Assembling DNA Parts Using Gibson Assembly Method ... 12
2.7. Joining DNA Parts with Ligation Enzyme ... 13
2.8. Plasmid DNA Isolation ... 13
2.9 Genomic DNA Isolation ... 14
2.10 Designing and verifying vectors ... 14
2.11. Cloning the vectors ... 15
2.11.1. Cloning pET22b(+) T7 LacO YadF 6xHis Tag Vector ... 15
2.11.2. Cloning pET22b(+) T7 LacO CAH_METTE 6xHis Tag and pET22b(+) T7 LacO SIA_SUBDO 6xHis Tag vectors ... 15
vi
2.11.4. Cloning pET22b(+) T7 LacO pelB 6xHis mCherry R5 Ag43 and
pET22b(+) T7 LacO pelB 6xHis YFP R5 Ag43 ... 16
2.12. Protein expression and characterization ... 17
2.12.1. Growth Conditions for inducing protein expression ... 17
2.12.2. SDS-PAGE, Commassie Blue Staining and Western Blot ... 17
12.13. Statistical Analysis ... 18
12.14. Cell Culture Experiments ... 18
CHAPTER 3 ... 20
RESULTS AND DISCUSSION ... 20
3.1. Characterization of Enzymes Considered as Having Silicase Activity 20 3.1.1. Cloning and Characterization of YadF Coding Gene into pET22b Vector ... 20
3.1.2. Investigation of Carbonic Anhydrase and Silicase Activity of YadF ... 23
3.1.2. Cloning and Characterization of Suberites domuncula Silicate (SIA_SUBDO) and Methanosarcina thermophila Carbonic Anhydrase (CAH_METTE) ... 25
3.2. Display of R5 Peptide Together with sfGFP on the Cell Surface ... 30
CHAPTER 4 ... 77
CONCLUSIONS ... 77
vii APPENDIX A ... 87 Sequences of DNAs ... 87 APPENDIX B ... 96 Primers List ... 96 APPENDIX C ... 100
Alignments of vectors with sanger sequencing results ... 100
APPENDIX D ... 102
Maps of Vectors ... 102
APPENDIX E ... 108
viii
List of Figures
Figure 1. Cloning of pET22b(+) T7 pLacO YadF vector. A) Amplification of YadF gene by PCR. (expected band length: 720 bp). B) Digestion of pET22b (+) T7 LacO vector with XhoI- KpnI (expected band size: 5285 bp) ... 21 Figure 2. Analysis of YadF expression with western blotting A) total cell extract from uninduced cell (lane 1) and from induced cell (lane 2) at 37 0C for 4 hours B) total cell extract from induced cell at 37 0C for 4 hours, 30 0C for 8 hours, 18 0C for overnight (lane 1, lane 2 and lane 3, respectively) and from uninduced cell (lane 4) ... 22 Figure 3. SDS-PAGE analysis of YadF purification and buffer exchange A) purification of YadF with resin (lane 1: elution 3, lane 2: elution 2, lane 3: elution 1, lane 4: wash, lane 5: unbound) B) after buffer exchange (lane 2: precipitated proteins and proteins in supernatant, lane 3: collected proteins, lane 4: precipitated proteins) (expected molecular weight: 25 kDa) ... 23 Figure 4. Investigation of carbonic anhydrase activity of YadF by ester hydrolysis. (the results obtained were analyzed by bidirectional analysis of variance (ANOVA) (GraphPad Prism v6), no marking was made in the groups that did not show significant difference. ... 24 Figure 5. Investigation of YadF's silicase activity with blue silicamolybdic analysis. A) Optical densities of standards at 810 nm depending on the silicic acid concentration. B) The results obtained were analyzed by two-way analysis of variance (ANOVA) (GraphPad Prism v6), and no marking was made in the groups that did not show significant differences. ... 25
ix
Figure 6. Digested pET22b(+) T7 LacO YadF vector with KpnI-XhoI to get backbone (expected band size: 5285 bp). ... 26 Figure 7. SDS-PAGE analysis of induced cell lysates of silicases A) extracts of cells induced at 180C for 16 hours (L: Ladder, cells containing 1: YadF, 2: SIA_SUBDO and 3: CAH_METTE vector, 4: BL21(DE3) cells) B) extracts of cells induced at 370C for 4 hours (cells containing 1: CAH_METTE, 2: SIA_SUBDO, 3: YadF vector, L: Ladder) (expected molecular weights: 28, 32 and 25, respectively) ... 27 Figure 8. Western Blot analysis of silicases A) induced and uninduced cells at different temperatures without glucose L: ladder 1: BL21(DE3), 2,6: uninduced cells containing SIA_SUBDO vector, 3,7: induced cells containing SIA_SUBDO vector, 4,8: uninduced cells containing CAH_METTE vector, 5,9: induced cells containing CAH_METTE vector. 2,3,4,5 cells were grown at 37 0C for 4 hours. 6,7,8,9 cells grown at 300C for 8 hours B) induced and uninduced cells at different temperatures with glucose 1,2: induced and uninduced cells containing CAH_METTE vector, respectively 3,4: induced and uninduced cells containing SIA_SUBDO vector, respectively 5,6: induced and uninduced cells containing YadF vector, respectively. Cells were grown at 370C for 4 hours. ... 28 Figure 9. Western Blot analysis of silicases A) induced cells at different temperatures L: ladder 1: BL21(DE3), 2,3: cells containing SIA_SUBDO vector induced either with glucose without glucose, respectively 4,5: cells containing CAH_METTE vector induced either with glucose without glucose, respectively 6,7: cells containing YadF vector induced either with glucose without glucose, respectively. Cells were grown at 300C for 6 hours. 8,9: cells containing YadF
x
vector induced with glucose at 180C for 8 hours and 16 hours, respectively. B) induced cells at 180C with different incubation times 1,2: cells containing CAH_METTE vector induced either without glucose or with glucose, respectively for 8 hours 3,4: cells containing CAH_METTE vector induced either without glucose or with glucose, respectively for 16 hours 5,6: cells containing SIA_SUBDO vector induced either without glucose or with glucose, respectively for 8 hours 7,8: cells containing SIA_SUBDO vector induced either without glucose or with glucose, respectively for 16 hours, 9: BL21(DE3), L: Ladder (expected molecular weights: 32, 25, 28 kDa, respectively) ... 29 Figure 10. SDS-PAGE analysis of purification silicases after autoinduction A) 1,2,3: cell extracts containing YadF, SIA_SUBDO, CAH_METTE vector, respectively.4,5,6: purified proteins and 7,8,9: concentrated proteins, respectively. B) 1,2,3: purified proteins: CAH_METTE, SIA_SUBDO, YadF, respectively. 4,5,6: concentrated proteins in the same order (expected molecular weights: 32, 25, 28 kDa, respectively) ... 30 Figure 11. Cloning of pET22b (+) T7 pLacO pelB R5-sfGFP Ag43 160N vector. A) Amplification of part of the R5-sfGFP gene by PCR. (expected band length: 839 bp). B) PZR amplification of the region encoding Ag43 160N from left to right, amplification of the entire part of the R5-sfGFP gene by PCR, cut of the pET22b (+) T7 pLacO vector by XhoI-NcoI (expected bands, respectively: 2544 bp, 892 bp, 5431 bp) ... 31 Figure 12. Fluorescence changes in cell supernatants by heat incubation for analysis of the expression of R5-sfGFP protein on the cell surface. The obtained results were analyzed by two-way analysis of variance (ANOVA) (GraphPad
xi
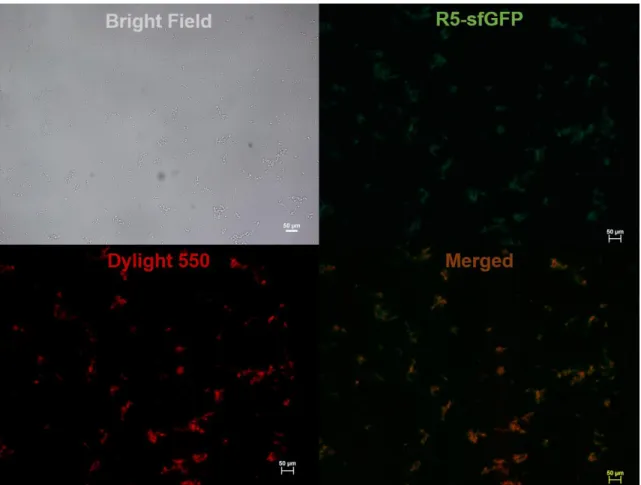
Prism v6), the differences between the groups were marked with "*" (p ≤ 0.05, p ≤ 0.01, p ≤ 0.001 and p ≤ 0.0001 respectively "*", "**” Is represented by “***” and “****”). No marking was made in the groups that did not show significant differences. ... 33 Figure 13. SDS-PAGE analysis of expression of R5-sfGFP with heat release experiment A) pellets and supernatants of cells whether they were heat-treated L: Ladder, 1,2: supernatant of BL21(DE3) heat-treated/untreated cells, respectively, 3: pellet of treated uninduced cells, 4,5: supernatant of treated/untreated uninduced cells, respectively, 6,8: pellet of untreated/treated induced cells, respectively. 7,9: supernatant of heat-untreated/treated induced cells, respectively. B) supernatants of cells L: Ladder 1,2: heat-untreated/treated uninduced cells, respectively 3,4: heat-untreated/treated induced cells, respectively (expected molecular weight: 68 kDa) ... 34 Figure 14. Western Blot analysis of expression of R5-sfGFP with heat release experiment L: Ladder, 1,2: supernatant of heat-treated/untreated of induced cells, 3,4: supernatant of heat-treated/untreated of uninduced cells, 5,6: supernatant of heat-treated/untreated of BL21(DE3) cells (expected molecular weight: 68 kDa) ... 35 Figure 15. ICC experiment for displayed R5-sfGFP protein with antihis antibody conjugated with Dylight550 (white bars: 50 µm) ... 36 Figure 16. ESEM images after silica precipitation reaction using supernatant of BL21(DE3) cells ... 37
xii
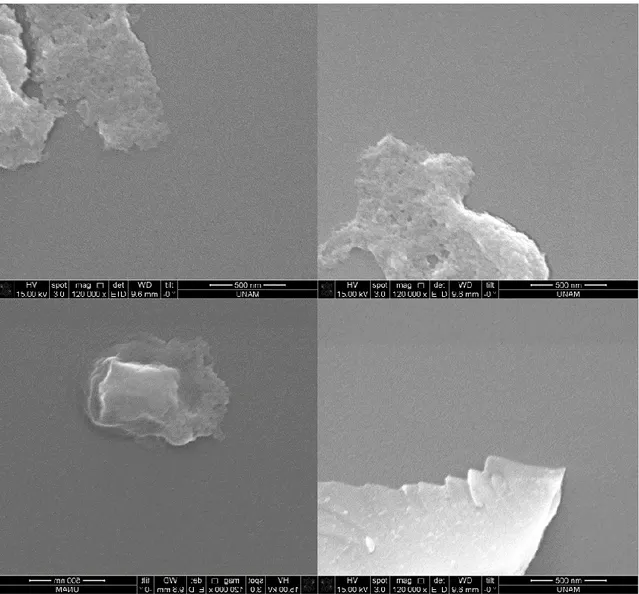
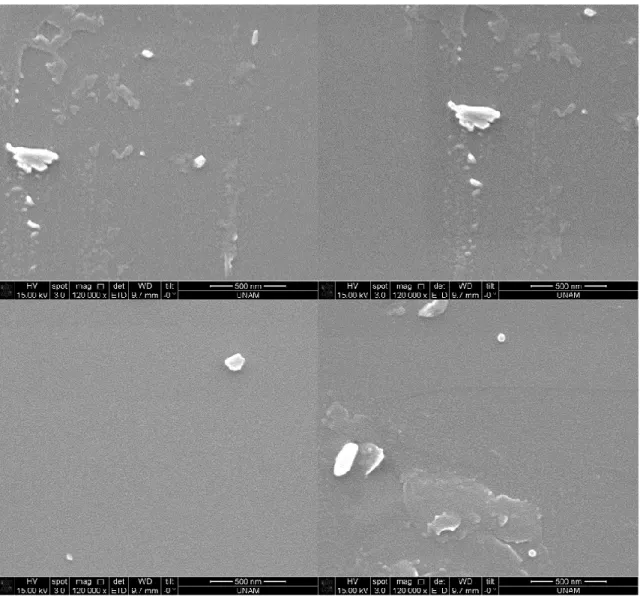
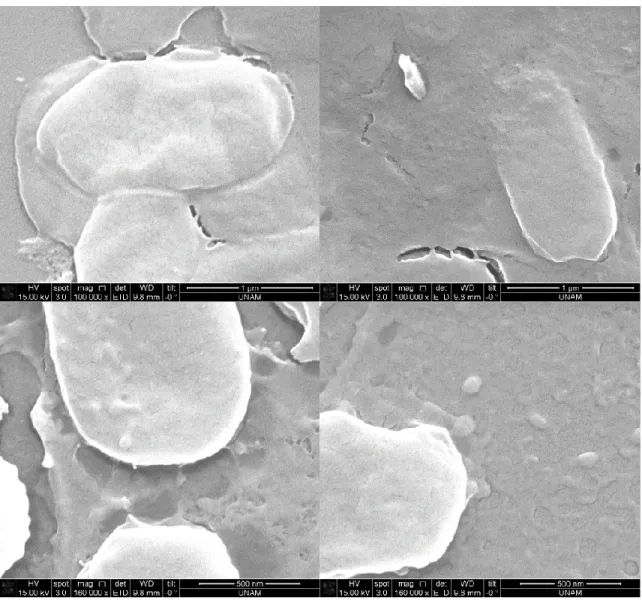
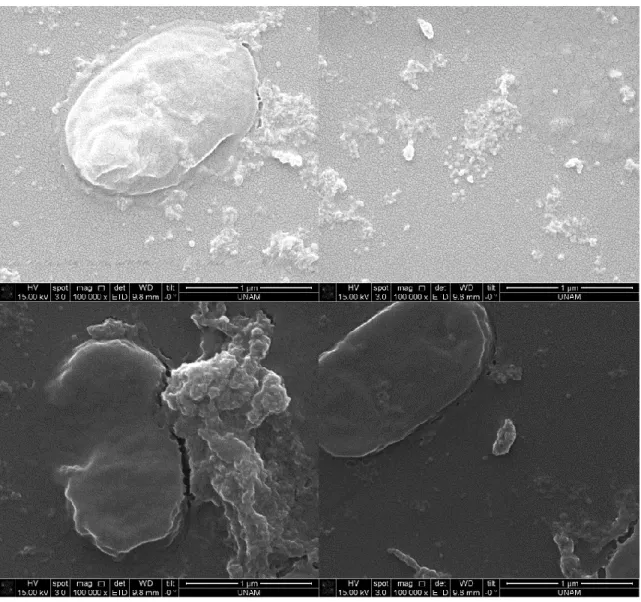
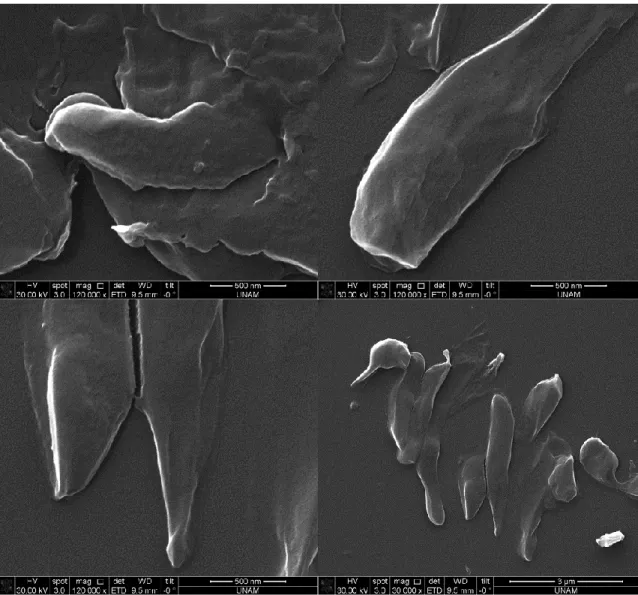
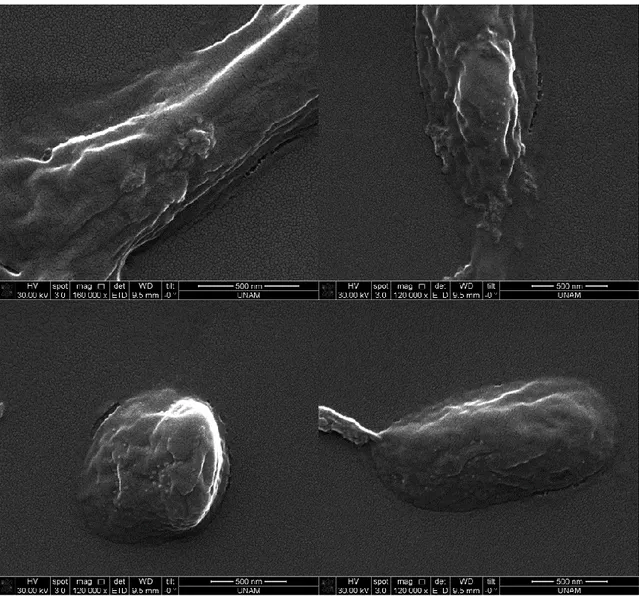
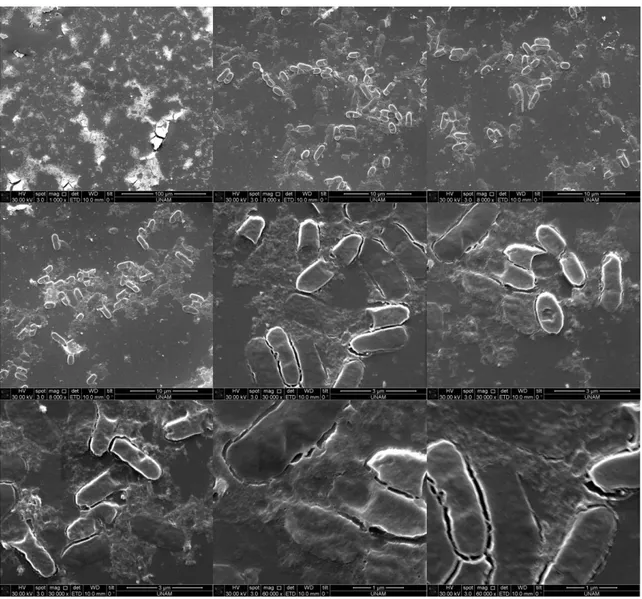
Figure 17. SEM images after silica precipitation reaction using supernatant of induced cells containing R5-sfGFP vector ... 38 Figure 18. SEM images after silica precipitation reaction using 10%PEI ... 39 Figure 19. SEM images after silica precipitation reaction using uninduced cells containing R5-sfGFP vector ... 40 Figure 20. SEM images after silica precipitation reaction using induced cells containing R5-sfGFP vector ... 41 Figure 21. SEM images after silica precipitation reaction using uninduced cells containing R5-sfGFP vector ... 42 Figure 22. SEM images after silica precipitation reaction using induced cells containing R5-sfGFP vector ... 43 Figure 23. TEM images after silica precipitation reaction using supernatant of induced cells containing R5-sfGFP vector ... 44 Figure 24. TEM images after silica precipitation reaction using pellet of induced cells containing R5-sfGFP vector ... 45 Figure 25. TEM images after silica precipitation reaction using 10%PEI ... 46 Figure 26. TEM image and EDS analysis after silica precipitation reaction using 10% PEI ... 47 Figure 27. TEM images after silica precipitation reaction using supernatant of induced cells containing R5-sfGFP vector ... 47 Figure 28. TEM images after silica precipitation reaction using supernatant of induced cells containing R5-sfGFP vector ... 48 Figure 29. TEM image and EDS analysis after silica precipitation reaction using supernatant of induced cells containing R5-sfGFP vector ... 49
xiii
Figure 30. TEM image and EDS analysis after silica precipitation reaction using supernatant of induced cells containing R5-sfGFP vector ... 49 Figure 31. TEM image and EDS analysis after silica precipitation reaction using supernatant of induced cells containing R5-sfGFP vector ... 50 Figure 32. Energy-filtered TEM (EFTEM) maps after silica precipitation reaction using supernatant of induced cells containing R5-sfGFP vector. C, P, O, and Si were selected for imaging ... 50 Figure 33. SDS-PAGE analysis of expression of R5-FPs with heat release experiment L: Ladder, 1,2: supernatant of heat-treated uninduced and induced cells containing R5-sfGFP vector, respectively 3,4: supernatant of heat-treated uninduced and induced cells containing YFP-R5 vector, respectively 5,6: supernatant of heat-treated uninduced and induced cells containing mCherry-R5 vector, respectively (expected molecular weight: 68 kDa) ... 51 Figure 34. Western Blot analysis of expression of R5-FPs with heat release experiment L: Ladder, 1,2: supernatant of heat-treated induced and uninduced cells containing mCherry-R5 vector, respectively, 3,4: supernatant of heat-treated induced and uninduced cells containing YFP-R5 vector, respectively 5,6: supernatant of heat-treated induced and uninduced cells containing R5-sfGFP vector, respectively 7,8: supernatant of heat-treated induced and uninduced BL21(DE3) cells, respectively (expected molecular weight: 68 kDa) ... 51 Figure 35. SEM images after silica precipitation reaction using induced cells containing R5-sfGFP vector ... 53 Figure 36. SEM images after silica precipitation reaction using induced cells containing mCherry-R5 vector ... 54
xiv
Figure 37. SEM images after silica precipitation reaction using induced cells containing YFP-R5 vector ... 55 Figure 38. SEM images after silica precipitation reaction using BL21(DE3) cells ... 56 Figure 39. SEM images after silica precipitation reaction using uninduced cells containing R5-sfGFP vector ... 57 Figure 40. SEM images after silica precipitation reaction using induced cells containing R5-sfGFP vector ... 58 Figure 41. SEM images after silica precipitation reaction using uninduced cells containing YFP-R5 vector ... 59 Figure 42. SEM images after silica precipitation reaction using induced cells containing YFP-R5 vector ... 60 Figure 43. SEM images after silica precipitation reaction using uninduced cells containing mCherry-R5 vector ... 61 Figure 44. SEM images after silica precipitation reaction using uninduced cells containing mCherry-R5 vector ... 62 Figure 45. SEM image and energy-dispersive X-ray spectroscopy (EDS) after silica precipitation reaction using uninduced cells containing R5-sfGFP vector 63 Figure 46. SEM image and energy-dispersive X-ray spectroscopy (EDS) after silica precipitation reaction using induced cells containing R5-sfGFP vector .... 64 Figure 47. SEM image and energy-dispersive X-ray spectroscopy (EDS) after silica precipitation reaction using uninduced cells containing YFP-R5 vector ... 65 Figure 48. SEM image and energy-dispersive X-ray spectroscopy (EDS) after silica precipitation reaction using induced cells containing YFP-R5 vector ... 66
xv
Figure 49. SEM image and energy-dispersive X-ray spectroscopy (EDS) after silica precipitation reaction using induced cells containing YFP-R5 vector ... 67 Figure 50. SEM image and energy-dispersive X-ray spectroscopy (EDS) after silica precipitation reaction using uninduced cells containing mCherry-R5 vector ... 68 Figure 51. SEM image and energy-dispersive X-ray spectroscopy (EDS) after silica precipitation reaction using induced cells containing mCherry-R5 vector 69 Figure 52. SEM image and energy-dispersive X-ray spectroscopy (EDS) after silica precipitation reaction using induced cells containing mCherry-R5 vector 70 Figure 53. Confocal Microscope images after silica precipitation reaction using A) cells containing R5-sfGFP vector, B) cells containing YFP-R5 vector C) cells containing mCherry-R5 vector. (white bars: 20 µm) ... 71 Figure 54. Analysis of in vitro effects of silica with different concentrations on proliferation of DPSCs ... 72 Figure 55. Observation of cells proliferation after adding silica at day 1 with light microscopy. ... 72 Figure 56. Observation of cells osteogenesis after adding silica at day 1 with light microscopy. ... 73 Figure 57. Observation of cells proliferation after adding silica at day 4 with light microscopy. ... 73 Figure 58. Observation of cells osteogenesis after adding silica at day 4 with light microscopy. ... 74 Figure 59. Observation of calcium crystal formation with Alizarin Red Staining at day 7 with light microscopy ... 75
xvi
Figure 60. Observation of calcium crystal formation with Alizarin Red Staining
after adding silica at day 7 with light microscopy. ... 76
Figure C. 1. Alignment of pET22b(+) T7 LacO YadF 6xHisTag with the sanger sequencing result ... 100
Figure C. 2. Alignment of pET22b(+) T7 LacO SIA_SUBDO 6xHisTag with the sanger sequencing result ... 100
Figure C. 3. Alignment of pET22b(+) T7 LacO CAH_METTE 6xHisTag with the sanger sequencing result ... 100
Figure C. 4. Alignment of pET22b(+) T7 LacO R5-sfGFP 6xHisTag Ag43 with the sanger sequencing result ... 100
Figure C. 5. Alignment of pET22b(+) T7 LacO mCherry-R5 6xHisTag Ag43 with the sanger sequencing result ... 101
Figure C. 6. Alignment of pET22b(+) T7 LacO Venus YFP-R5 6xHisTag Ag43 with the sanger sequencing result ... 101
Figure D. 1. Map of pET22b(+) T7 LacO YadF 6xHisTag ... 102
Figure D. 2. Map of pET22b(+) T7 LacO SIA_SUBDO 6xHisTag ... 103
Figure D. 3. Map of pET22b(+) T7 LacO CAH_METTE 6xHisTag ... 104
Figure D. 4. Map of pET22b(+) T7 LacO R5-sfGFP Ag43 6xHisTag ... 105
Figure D. 5. Map of pET22b(+) T7 LacO mCherry-R5 Ag43 6xHisTag ... 106
xvii
List of Tables
Table A. 1. Nucleotide sequences of genes and genetic fragments ... 87
Table B. 1. List of primers ... 96
Table E. 1: PCR mix used to amplify the desired DNA region ... 108
Table E. 2: PCR conditions used to amplify the desired DNA region ... 109
Table E. 3: Restriction Enzyme Digestion Reaction Mixture ... 109
Table E. 4: Gibson Assembly Reaction ... 110
Table E. 5: Ligation reaction conditions ... 110
Table E. 6: 1L of 10x PBS buffer ... 110
Table E. 7: 1 L of 10x SDS Running Buffer ... 111
Table E. 8: 1 L of 10x TBS Buffer ... 111
Table E. 9: 1 L of 50x TAE ... 111
Table E. 10: Coomassie Blue Dye Solution for SDS Gel Staining ... 112
Table E. 11: Binding / Wash Buffer (pH: 7.4) ... 112
Table E. 12: Elution Buffer (pH: 7.4) ... 112
Table E. 13: Silica Precipitation Buffer (pH 8.0) ... 113
Table E. 14: Silica Wash Buffer (pH 7.0) ... 113
Table E. 15: YadF Reaction Buffer (pH 7.2) ... 113
Table E. 16: Solution A for blue silicomolybdic assay ... 113
Table E. 17: Solution B for 1 L of blue silicomolybdic assay ... 114
Table E. 18: Blue siliamolibdic test reaction mixture ... 114
Table E. 19: Autoinduction medium ZYM-5052 ... 115
xviii
Table E. 21: TSS (Transformation and Storage Solution) buffer ... 116 Table E. 22: Proliferation medium ... 116 Table E. 23: Differentiation medium ... 117
1
CHAPTER 1
INTRODUCTION
In nature, proteins, carbohydrates, peptides, nucleic acids play an active role in the formation of the hard tissues of organisms. One of the most important roles in the formation of well-known materials such as bone tissue and the tissues of sea crustaceans in a hierarchical order and for these structures to have a controlled architecture falls to protein and peptide molecules (Foo et al., 2004; Sarikaya, 1999). It is known that proteins play a fundamental role in the creation of many different materials. However, a single protein is not generally involved in the formation of the hard tissues of organisms, it is known that more than one and an overly complex protein group plays a role in the formation of hard tissue. Proteins are generally involved in the formation of hard tissues in two different ways. The first of these is to enable the growth of materials synthesized in the environment by holding them as a scaffold or to create new materials by showing different catalytic activities. It has been shown in different organisms that operons, which control the proteins used by organisms during the formation of hard tissues, are regulated depending on environmental factors and the presence of precursor materials and provide the secretion of necessary proteins (Müller et al., 2013; Wang et al., 2012). They form these structures at room temperature or lower temperatures by using a limited amount of material during their growth. Within the scope of the proposed studies, it is aimed to create synthetic gene circuits that can be programmed and capable of controlled biomineralization by using
2
synthetic biology strategies and tools of enzymes that cause biomineralization, which are characterized by different organisms (Wang et al., 2014).
Although proteins have many functions in the production of biomaterials, studies have been carried out to use proteins as a scaffold in technological applications and thus to grow different materials or to develop different applications for tissue engineering (Gagner et al., 2014). In addition, biomaterials in organisms with their direct catalytic activities (Müller et al., 2013). Similar systems have been made by selecting peptide molecules binding material or by integrating amino acid groups with reducing ends into designed peptide molecules in studies presented in the literature up to now (Mata et al., 2010; Seker & Demir, 2011). However, one of the most important constraints in such designs is the use of a single molecule at a time. In addition, the functionality of these molecules is limited due to the structural and chemical properties of the molecules. It is essential to overcome such restrictions and to create systems that can display more than one functionality at the same time to create more complex architectures. For this reason, a complex functionality must be created by using programmable cells instead of systems where only a single molecule can show limited activity. Within the scope of the project we are presenting, we are designing a programmable system that can perform both demolition and construction functions in order to find a solution to this problem. The enzyme and protein systems we need to create a system that works in this way are available in marine creatures previously studied in the literature. We want to use this information for our own design. Therefore, it will be necessary to consider the processes that produce two basic biomaterials such as calcification and silification.
3
Calcification and silification are the two most widely known biomineralization processes and are known to be the processes that play a major role in the formation of hard tissue skeletons in different living things. Calcification processes are one of the processes studied in detail in vertebrate organisms. Collagen protein is the protein known as one of the most important scaffold proteins in the formation of hard tissue in vertebrates, especially in bone tissue-like formations. Although collagen is thought to be involved in the formation of bone tissue as a strong template protein thanks to its triple helix structure, it has been shown in recent studies that collagen is not a passive protein, but an electrostatic potential and its distribution actively takes part in biomineralization throughout the entire collagen structure. It was observed that particles formed by the interaction of ions called prenucleation assemblages started to settle by holding around the positively charged collagen fibers. It is known that the prenucleation particles provide the formation of amorphous hydroxyapatite in parallel with the accumulation of new ions, and then form crystallized hydroxyapatite due to the transformation they undergo. It is known that these crystals are located in collagen fibrils (Boonrungsiman et al., 2012; Rey et al., 1996). Another important protein in vertebrates as a component of calcification processes is the amelogenin protein, which is involved in the production of tooth enamel. After the amelogenin protein is secreted, they come together thanks to non-covalent interactions to form nanospheres with the help of their hydrophilic and hydrophobic amino acid regions. Some of these nanospheres come together to form larger nanostructures, and finally, these nanostructures can interact with charged surfaces around them, such as other proteins, minerals, lipids. It has been
4
demonstrated that the nanospheres formed control the distance between the mineral crystals with their dimensional properties. Studies have shown that the carboxyl end of the amelogenin protein binds to calcium minerals on the surface of the hydroxyapatite mineral and controls the growth of these crystals on the face. As can be seen, amelogenin proteins perform two different functions, the first of which is to maintain the distance between the hydroxyapatite (HAP) crystals, and the other is to selectively bind to the mineral surfaces formed by the HAP crystals, allowing them to grow only in a certain direction (Fang et al., 2011). We have stated that many organisms in a wide spectrum from vertebrates to bacteria have biomineralization activities. Leaving aside the formation of biominerals enzymatically, an example of biomineralization processes is the formation of paramagnetic nanomagnets composed of iron oxide particles in magnetotactic bacteria. The most important features of these bacteria, although they are very simple creatures, are their ability to make a complex biomine. These creatures create nanomagnets in order to sense the magnetic field of the earth. In each of the magnetotactic bacteria, it is possible to encounter structures called magnetosomes and surrounded by a double layer consisting of lipids (Baumgartner & Faivre, 2011). From Magnetospirillum magneticum AMB-1, a magnetotactic bacterium, 48 different proteins related to magnetosome have been identified. However, among these, it has been demonstrated that the Mms6 protein can initiate magnetite production. Studies conducted under in vitro conditions have shown that the Mms6 protein can produce nanoparticles with similar morphology to bacterial magnetites. It has been demonstrated that the Mms6 protein, like the amelogene, controls the growth of magnetites formed by
5
binding to a certain crystal surface of the growing nanoparticles (Tanaka et al., 2011). In mutant studies, the magnetite structures formed in case of deletion of the gene encoding the Mms6 protein have quite different shapes and other magnetite structures It was determined that they did not contain the proteins involved in its production. The reason for this is that the mms6 protein initiates the formation of magnetite as a scaffold, and then other proteins are thought to join this structure and contribute to the control of crystal faces. Studies using the Mms6 protein have shown that this protein does not form a scaffold in a passive state. To bind iron ions and to form nuclei for biomineralization, it has been determined that amino acids containing hydroxyl and carboxyl side groups at the carboxyl end show activity by undergoing a structural change while binding iron minerals. In addition to the findings listed here, it has been determined that small-sized nanoparticles are enabled to evolve into larger particles due to the micelle structure formed by the mms6 protein, and the Mms6 protein plays a role in the assembly of these smaller structures by moving within the magnetosome (Lohsse et al., 2014; Tanaka et al., 2011).
In the section above, the most important examples of proteins that take place as scaffolds in biomineralization are mentioned. One of the systems in which genes of enzymatic biomineralization activities are characterized are marine biomineral systems. In addition, genetic networks of hard tissue formation, such as bone formation in mammalian cells, have been studied extensively. The most important feature that distinguishes material production processes catalyzed by enzymes from other known biochemical processes is that they take place not in substrate-saturated solutions, but in systems that are not substrate-saturated with the substrate. In
6
this way, the way for the formed biomineral systems to reach a desired shape within a certain time is opened, rather than suddenly entering a certain shape. As an example of this situation, the long thorn-like structures of different sea sponges can be given (Gendron-Badou et al., 2003). Some of the proteins that play a role in silification and calcification mechanisms in biomineralization processes are enzymes such as silicatein, silicate, carbonic anhydrase, silafine, alkaline phosphatase (Wang et al., 2014).
Silicatein enzyme is an enzyme that plays an active role in the formation of biosilica structures in sea sponges. This enzyme is considered within the protease family, including cathepsin L (cathepsin L) and papin. Silicatein provides the formation of biosilica both as an enzyme and as a scaffold. From the point of view of the mechanism, the silica formation reaction catalyzed by silica is the same as the non-catalyzed reaction but allows the use of substrates in neutral pH conditions and low concentrations (Tahir et al., 2004). Besides, silicatein has been used successfully in the synthesis of different materials (Tahir et al., 2005). The fact that the silicatein enzyme has a wide substrate specificity enabling the synthesis of different metal oxides has enabled the coating of biosilica on different surfaces (Shukoor et al., 2008) or coatings such as titanium oxide (Tahir et al., 2009). Similarly, in the coating of hydroxyapatite minerals with silica, the potential of silica forming under the physiological conditions of the silicatein enzyme has been utilized, and thus it has been shown that it can be used in the coating of tooth enamel and as a filling (Natalio et al., 2010). It is an enzyme suitable for the targets we envision in our study.
7
The silaffin protein, whose functionality in silica biomineralization is characterized, is also a protein involved in the production of silica with catalytic activity. Sillaffins have been isolated from a diatom, C. fusiformis. Silaffin protein provides the formation of silica nanoparticles by using silica, thanks to its catalytic activity. The recombinant silafine molecule called rSilC has been used in biosilica formation studies (Tomczak et al., 2007). During the formation of this protein, especially the positively charged polyamine groups on it are effective and turn this protein into a mold so that it can take an active part in biomineralization. After the silaffin protein provides the formation of silica in different phases in diatoms, it was observed that these silica phases undergo a change in nanospheres. Silaffin protein has a feature that can control the silica formation at every stage and produce silica nanoparticles and silica materials in different sizes and shapes. In addition to these synthesis features, the silaffine protein creates skeletons where the particles formed after the formation of silica can hold. In addition to recombinant silaffin proteins (rSilC) produced for the synthesis of silica nanoparticles, it has been shown in studies that these proteins can also produce different metal oxides such as titanium oxide (Kharlampieva et al., 2008). Based on these results, we predict that the silaffin protein we will use in our system is also a good candidate enzyme.
In addition to the production of silica, functionalities such as removing silica coatings on surfaces or changing their shape by providing silica destruction constitute an important part of our work. Carbonic anhydrase enzymes, which have been shown to have similar activities with this enzyme, will also be used after studies with the silica enzyme, which is known to provide silica destruction.
8
It has been observed that the silica enzyme isolated from the sea sponge S.
domuncula degrades the silica while also degrading the calcium carbonate
materials like carbonic anhydrase enzymes. Therefore, the use of anhydrase enzymes belonging to Methanosarcina thermophila and Bacillus clausii bacteria has been included in our study, assuming that carbonic anhydrase enzymes may also have the silica degradation activity of the silica enzyme (Schröer et al., 2003). Within the scope of this study, a new metabolic pathway is tried to be formed by using the enzymes and proteins listed above. Enzymes that will take place in this metabolic pathway will be brought together for the first time in the literature. The first part of the designed genetic circuit is the selection of enzymes to be used during the process and their characterization. Detailed literature information on this section is given above. The second part of the genetic circuit to be formed is the answer to the question of how these enzymes will be transmitted to the surface of the material, and how the production of destruction and production enzymes will be stopped and opened sequentially. A protein auto-carrier system called Ag43 (flu) was chosen considering that it would be the easiest and fastest system to produce these enzymes and deliver them outside the cell. The Ag43 (flu) auto-carrier system is an important protein in terms of transforming cells from planktonic state to biofilm during phase change and has been classified as an antigen (van der Woude & Henderson, 2008). Structural and functional properties of this protein are given in detail in the subject and scope section.
Although there are studies in the literature that generally involve a single type of molecule on material synthesis, these studies require smart cell designs to produce more complex materials and architectures. In this sense, the project we
9
present will fill an important gap in the literature and will enable complex material systems to be revealed by cells containing programmed biocatalyst gene circuits. In this sense, it will fill a great gap in terms of reprogramming biological material synthesis processes and using them in material synthesis / modification.
10
CHAPTER 2
MATERIALS AND METHODS
2.1. Strains, Cell Maintenance, Growth Conditions, Mediums
In the study, while Escherichia coli (E. coli) DH5α PRO strain was used for cloning experiments, E. coli BL21(DE3) strain was used for protein expression.
In the BL21(DE3), T7 polymerase gene is in upstream of LacI promoter so that expression of point of interest controlled by T7 promoter is inducible by Isopropyl-β-d-1-thiogalactopyranoside (IPTG). Stocks of strains were kept in Lysogeny Broth (LB) growth medium (Table E. 20) containing 25% (v/v) glycerol at – 80 0C.
E. coli DH5α PRO bacteria taken from the stock were inoculated overnight (o/n)
at 200 rpm at 37 0C. The culture was replaced with 1:100 ratio into fresh LB including spectinomycin and the new culture was left to grow in previous conditions to reach 0.3-0.5 values of optical density measured at 600 nm (OD600). The culture was waited in ice for 10 minutes. After holding them in ice, bacteria were collected by centrifuging them at 3000 rpm at 4 0C for 10 minutes. In sterile environment, the pellet was resuspended in 1:10 growth medium volume of Transformation and Storage Solution (TSS) (Table E. 21). Then, the competent bacteria were put into tubes in volumes of 100 µL and stored at – 80 0C ready to use. To transform plasmids, competent cells were kept on ice for thawing them for 20 minutes. Then, 50-100 ng DNA was added onto the cells and gently mixed by pipetting and they were waited on ice for 30 minutes which was followed by heat-shocking them at 42 0C for 45 seconds. After a further incubation on ice for
11
5 minutes, 1 ml of fresh LB was added to this mixture and it was incubated for 45 minutes at 37 0C, 200 rpm. The samples taken after the incubation were first centrifuged and then were resuspended in 250 µL of LB. The suspension was spread on LB-Agar (Table E. 20) containing proper antibiotic to allow them grow at 37 0C overnight.
2.2. Polymerase Chain Reaction (PCR)
The polymerase chain reaction was performed under the conditions recommended by the manufacturer of the Q5 polymerase (NEB) enzyme used in the reaction. The PCR mixture is given in Table E. 1 and PCR conditions are given in Table E. 2. Primary DNAs used in PCR were manually designed and synthesized by PRZ Biotech. Tm's of the primers used were calculated using the website (http://tmcalculator.neb.com). All primers values used in the study are given in Table 3.
2.3. Agarose Gel Electrophoresis
All DNA fragments to be imaged or purified were run in agarose gel electrophoresis. In agarose gel electrophoresis 1% (w/v) agarose gel was prepared. Agarose powder was placed in 1x TEA buffer (Table E. 9) dissolved by boiling including SybrTM Safe dye. After the gel was frozen, the solution containing DNA was mixed with 6x loading dye buffer (NEB) and loaded into the wells in the gel. The DNAs and 2-log DNA Ladder were run at 120V for 35 minutes and they were observed under blue light of LED transilluminator (GeneDireX, Inc.).
12
2.4. Digestion of DNA Fragments with Restriction Enzyme
The reaction mixture given in Table E. 5 was used to cut the DNA with restriction enzymes. All restriction DNA enzymes were purchased from NEB company. The reaction mixture was kept at 37 ° C for 3 hours.
2.5. DNA Isolation from Gel
"MN-Gel isolation and PCR clean-up" kit was used for DNA fragments to be isolated from agarose gel, and the recommended procedure in the kit was followed as it is. Briefly, the DNA fragments cut from the gel were transferred to 2 ml microcentrifuge types and weighed, and by calculating the volume from weight (100 mg = 100 µl) as described in the protocol, NT1 solution was added to the gel in a way that it was twice its weight. The gel, which was left to dissolve at 50 ° C, was loaded into the columns in the kit after it was dissolved, and the DNA was bound to the silica membrane inside the column. To remove chemical contamination from the columns, they were washed twice with NT3 buffer, DNA fragments were separated from the column with water (10 µl) heated at 65 ° C into a new tube.
2.6. Assembling DNA Parts Using Gibson Assembly Method
To assemble the parts to be cloned, the vector DNA was first set to be 50-100 ng. Gibson Assembly reaction was established by adjusting the DNA fragments to be cloned into the vector to be equimolar to the vector. For small fragments (<200 bp), the concentration was increased 2-5 times. The DNAs were mixed and added to the mixture by putting a total of 2.5 µL DNA into 7.5 µL of Gibson Assembly
13
Master Mix or 5 µL in 15 µL Gibson Assembly Master Mix (Table E. 4) and kept at 50 ° C for 1 hour. These samples predicted to assemble were then transformed into E. coli Pro DH5α cells by chemical transformation.
2.7. Joining DNA Parts with Ligation Enzyme
T4 ligase (NEB) enzyme was used to join the cut vector and fragment DNA by ligation method. Enzyme inactivation was performed for 10 minutes at 65 ° C for samples kept at room temperature for 10 minutes after the ligation reaction was prepared as follows (Table E. 5) according to the experimental method developed by considering the company recommendations. Subsequently, these samples were transformed into E. coli DH5α cells by chemical transformation.
2.8. Plasmid DNA Isolation
"MN-Plasmid DNA isolation kit" was used to isolate plasmid DNAs in the cell, and the recommended procedure in the kit was followed as it is. Briefly, the cells grown overnight were settled (5400 rpm, 10 minutes) and the supernatant was discarded, the cell pellet was dissolved in 250 µl of A1 solution. These samples were mixed by adding 250 µl of A2 solution and kept at room temperature for no longer than 5 minutes. Then 350 µl of A3 solution was added and the samples were settled (13000 rpm, 10 minutes). At the end of the centrifuge, the liquid phase of the samples whose solid and liquid phases were separated from each other, was loaded into the columns in the kit, and DNA was ensured to bind to the silica membrane in the column. Then, washing was performed with 500 µl AW and 700 µl A4 solutions heated at 50 ° C, respectively. Finally, DNA fragments in
14
the column were separated from the column into a clean tube with water (50 µl) heated at 65 ° C.
2.9 Genomic DNA Isolation
“Qiagen Genomic DNA Kit” was used to isolate genomic DNA of both bacterial and eukaryotic cells. Different protocols are recommended in the kit for both isolation methods. During isolation, genomic DNAs were isolated by following the relevant kit instructions.
2.10 Designing and verifying vectors
Vectors maps were designed by using online tool Benchling (https://www.benchling.com). All of changes and designs were done in the tool. After primers were designed, they were synthesized by PRZ BioTech company (http://przbiotech.com). Melting temperatures (Tm) of primers were calculated in the NEW ENGLAND BioLabs Inc. (NEB) (https://tmcalculator.neb.com/#!/main). Concentration and purity of isolated DNA was analyzed by using Nanodrop 2000 device. Newly designed constructs were verified by digestion with restriction enzymes to see whether interest of sequence is inserted into the vector or not. After the constructs were sent to Genewiz Company for sanger sequences. The sequencing results and the template were aligned in the Geneious Program (https://www.geneious.com) by choosing alignment type as global alignment with free end gaps, cost matrix as 65% similarity (5.0/4.0), gap open penalty as 12 and gap extension penalty as 3.
15
2.11. Cloning the vectors
2.11.1. Cloning pET22b(+) T7 LacO YadF 6xHis Tag Vector
The gene YadF from E. coli genome was amplified with PCR by using BMK1 and BMK2 primers (appendix). The pET22b(+) Ag43 Cmr vector constructed by our lab member Recep Erdem Ahan and YadF PCR product were digested with restriction enzymes KpnI and XhoI (appendix). Reactions were run by agarose gel electrophoresis (on page 11). When the linearized DNAs had expected band sizes, the digestion products were extracted from the gel (on page 12). The extracted linearized vector and insert were assembled by Gibson Assembly method (on page 12). The plasmid was transformed into E. coli DH5α PRO as described in 2.1 section. Four colonies were selected from LB-agar plate and they were inoculated overnight at 37 0C at 200 rpm with proper antibiotic. Plasmids were isolated from these cultures (on page 13) and they were verified with restriction digestion and sanger sequencing (on page 14). After verification, they were transformed into BL21(DE3) competent cells for protein expressions. Selection and verification of colonies and transformations into BL21(DE3) were as same as described above for the rest of cloning plasmids.
2.11.2. Cloning pET22b(+) T7 LacO CAH_METTE 6xHis Tag and pET22b(+) T7 LacO SIA_SUBDO 6xHis Tag vectors
SIA_SUBDO and CAH_METTE genes were synthesized by Genewiz company to be cloned into pET22b vector by Gibson Assembly. The pET22b vector containing the YadF gene was cut with the restriction enzymes XhoI and KpnI. After
16
extracting the backbone from the gel, the genes were cloned into the vector by Gibson Assembly. After verification, they were transformed into BL21(DE3).
2.11.3 Cloning pET22b(+) T7 LacO pelB 6xHis R5 sfGFP Ag43
The vector without R5 peptide constructed by Recep Erdem Ahan was used as a backbone. sfGFP part was amplified with BMK5 and REA34 primers to add GS linker and R5 peptide to upstream of sfGFP. The PCR product was re-amplified with BMK6 and REA34 primers to complete the insertion of R5 peptide and BamHI enzyme site. After second PCR, the product and the vector were digested with BamHI and AflII restriction enzymes and they were ligated with T4 Ligase. Verification and transformation were done as described.
2.11.4. Cloning pET22b(+) T7 LacO pelB 6xHis mCherry R5 Ag43 and pET22b(+) T7 LacO pelB 6xHis YFP R5 Ag43
pZa TetO mCherry 3xGS linker R5 and pZa TetO YFP 3xGS linker R5 vectors constructed by Tolga Tarkan Ölmez were used as a template for amplifying mCherry 3xGS linker R5 and YFP 3xGS linker R5 parts. BMK39-BMK41 and BMK39-BMK40 primer pairs were used in the PCR reactions, respectively. For their backbone, pET22b(+) T7 LacO pelB 6xHis R5 sfGFP Ag43 vector was used as a template. The backbone for mCherry 3xGS linker R5 was amplified with BMK42 primers and for YFP 3xGS linker R5 was amplified with BMK43-BMK44 primers. As in the section 2.11.1, finally the plasmids were transformed into BL21(DE3).
17
2.12. Protein expression and characterization
2.12.1. Growth Conditions for inducing protein expression
BL21(DE3) containing desired plasmid and BL21(DE) cells for using as a negative control were inoculated overnight at 37 0C at 200 rpm. The growth cultures were diluted with 1:100 ratio in desired volume of fresh LB medium with an appropriate antibiotic. The cultures were incubated at 37 0C at 200 rpm until their OD
600 values reached in range of 0.4-0.6. Then, they were induced with 1 mM of IPTG. Although, fluorescent protein inductions were done overnight at 18 0C at 200 rpm, incubation temperature and time of other proteins were different for optimization purposes. Their induction conditions can be found in the Chapter 3.
2.12.2. SDS-PAGE, Commassie Blue Staining and Western Blot
Sodium Dodecyl Sulfate Polyacrylamide Gel Electrophoresis (SDS-PAGE) and Western blot were performed to see whether interest of protein was expressed or not. 4 % stacking gel and 12 % separating gel were used for both analyses. Samples with 1X gel loading dye were waited at 95 0C for 5 minutes before running them in the gel at 120 V for 1.5-2 hours.
For SDS-PAGE analysis, the gel in Coomassie blue staining solution was incubated in microwave until it was heated by preventing boiling for total 20-40 seconds. Heated gel was shaken for 15 minutes at 250 rpm. After shaking, the gel was replaced into another box to was excess stain with water and then destaining solution was added into the box.
18
For immunoblot analysis, the gels were transferred to the PDVF membrane with the Bio-RAD turbo-blot device using the standard miniblot protocol. The PVDF membrane was blocked in 5% milk powder buffer dissolved in TBST buffer for 1 hour at room temperature (RT). It was incubated overnight with a dilution of 1: 5000 Anti-His goat primary antibody prepared in 5% milk powder buffer dissolved in TBST buffer to. The next day, the membrane was washed twice for 10 minutes and once for 5 minutes with TBST buffer. The membrane was incubated for 1 hour with a dilution of 1: 5000 HRP-linked anti-goat secondary antibody prepared in 5% milk powder buffer dissolved in TBST buffer. After incubation, the membrane was washed with TBST buffer twice for 10 minutes and once for 5 minutes. Bio-RAD ChemiDoc device was used to capture images from the membrane irradiated with the Bio-RAD ECL substrate kit.
12.13. Statistical Analysis
All data expressed in the graphs were drawn with the help of the "GraphPad Prism v6" program with the principle of "mean ± standard error mean", one-way or two-way analysis of variance (ANOVA) was used for data analysis.
12.14. Cell Culture Experiments
The dental pulp stem cells were taken from our jury member Emel Uzunoğlu Özyürek. Cells were seed into different multi-well plates as 5000 cells per well. For the first experiment (Figure 55 - Figure 58), cells were directly exposed to differentiation medium (Table E. 23). For later, they were grown in proliferation medium (Table E. 22), when their confluency reached 60 % ratio then silica and
19
osteogenic medium was replaced with growth medium. After drying silica in Critical Point Dryer (CPD), the material was dissolved in water containing 0.05 % BSA.
20
CHAPTER 3
RESULTS AND DISCUSSION
3.1. Characterization of Enzymes Considered as Having Silicase
Activity
3.1.1. Cloning and Characterization of YadF Coding Gene into pET22b Vector
The study was started with the cloning and characterization of enzymes that are thought to have silica degradation activity for processing silica-based materials. For this, it was planned to examine its activity by cloning the carbonic anhydrase named YadF which is naturally found in E. coli. The gene amplified from the genome was cloned into the pET22b(+) vector (Figure 1).
The gene encoding YadF was amplified by PCR from the E. coli genome with primer BMK1 and BMK2 at 65 ° C (Figure 1. A). The pET22b vector from which YadF will be cloned into was cut with the enzymes KpnI and XhoI (Figure 1. B). The vector part and YadF PZR product are combined with Gibson assembly reaction.
21
Figure 1. Cloning of pET22b(+) T7 pLacO YadF vector. A) Amplification of YadF gene by PCR. (expected band length: 720 bp). B) Digestion of pET22b (+) T7 LacO vector with XhoI- KpnI (expected band size: 5285 bp)
At the end of the reaction, the combined DNA fragments were transformed into the DH5α PRO cell by chemical transformation. The verification of the vectors after plasmid isolation from the cells was proven by sequencing (Figure C. 1). Plasmids isolated from confirmed colonies were transformed into BL21 (DE3) cell by chemical transformation method. Cells inoculated on agar medium supplemented with the appropriate antibiotic were grown overnight. The next day, single colonies were selected and grown overnight, and then the cells were re-seeded with 10 mL of appropriate antibiotic into LB medium at 1: 100 dilution in the morning. When the OD600 value reached about 0.6, protein production with 1mM IPTG (isopropyl β-D-1-thiogalactopyranoside) was induced at 37 ° C for 4 hours. It was checked whether the protein was produced from the induced cells
22
by immunoblot using total cells. (Figure 2. A) and cells were induced at different temperatures with different induction time (Figure 2. B).
Figure 2. Analysis of YadF expression with western blotting A) total cell extract from uninduced cell (lane 1) and from induced cell (lane 2) at 37 0C for 4 hours B) total cell extract from induced cell at 37 0C for 4 hours, 30 0C for 8 hours, 18 0C for overnight (lane 1, lane 2 and lane 3, respectively) and from uninduced cell (lane 4)
Subsequently, the YadF protein was purified with the His tag. The purified protein and its samples in the purification steps were analyzed by SDS-PAGE (Figure 3.A) and elution buffer of purified proteins was exchanged to its storage buffer (Figure 3.B).
23
Figure 3. SDS-PAGE analysis of YadF purification and buffer exchange A) purification of YadF with resin (lane 1: elution 3, lane 2: elution 2, lane 3: elution 1, lane 4: wash, lane 5: unbound) B) after buffer exchange (lane 2: precipitated proteins and proteins in supernatant, lane 3: collected proteins, lane 4: precipitated proteins) (expected molecular weight: 25 kDa)
3.1.2. Investigation of Carbonic Anhydrase and Silicase Activity of YadF Ester hydrolysis was examined to look at the carbonic anhydrase activity. Zinc-free buffer solution with zinc was used in the reaction. Enzyme activity was studied by looking at the optical density of p-nitrophenyl acetate due to hydrolysis (Figure 4).
24
Figure 4. Investigation of carbonic anhydrase activity of YadF by ester hydrolysis. the results obtained were analyzed by bidirectional analysis of variance (ANOVA) (GraphPad Prism v6), no marking was made in the groups that did not show significant difference.
According to the ester hydrolysis analysis, it was observed that the carbonic activity of YadF was not at a high level, but its activity. According to ANOVA analysis, there was no significant result.
Then, to examine the silica activity, silicic acid standards in different concentrations were prepared and their optical densities were examined (Figure 5.A). Then, different volumes of enzyme were added onto the formed silica and the optical density of the reaction was examined. As a negative control, only the enzyme-working buffer solution was put into the reaction (Figure 5.B).
25
Figure 5. Investigation of YadF's silicase activity with blue silicamolybdic analysis. A) Optical densities of standards at 810 nm depending on the silicic acid concentration. B) The results obtained were analyzed by two-way analysis of variance (ANOVA) (GraphPad Prism v6), and no marking was made in the groups that did not show significant differences.
After, analysis of YadF protein, it had stared to work with the other candidate proteins as silicase
3.1.2. Cloning and Characterization of Suberites domuncula Silicate (SIA_SUBDO) and Methanosarcina thermophila Carbonic Anhydrase (CAH_METTE)
SIA_SUBDO and CAH_METTE gene with proper overhangs having cut sites to ligate with the backbone were synthesized at Genewiz company. The pET22b vector containing the YadF gene was cut with the restriction enzymes XhoI and KpnI (Figure 6). With the pET22b (+) vector fragment formed after the cutting, the SIA_SUBDO and CAH_METTE genes were combined separately by Gibson Assembly method. At the end of the reaction, the combined DNA fragments were transformed into the DH5α cell by chemical transformation. Cells inoculated on
26
agar medium supplemented with the appropriate antibiotic and incubated to grow overnight. The verification of the vectors after plasmid isolation from the cells was proven by sequencing (Figure C. 2, Figure C. 3).
Figure 6. Digested pET22b(+) T7 LacO YadF vector with KpnI-XhoI to get backbone (expected band size: 5285 bp).
The proven vectors were transformed into B121 (DE3) cell by chemical transformation method. Cells inoculated on agar medium supplemented with the appropriate antibiotic were incubated to grow overnight. One of the single cell colonies observed in the petri dish in the morning was selected and planted with the appropriate antibiotic in LB medium. In addition, B121 (DE3) cell without vector was inoculated to negative control and Bl21 (DE3) cell containing YadF vector to be used as positive control. The implanted cells were left to grow overnight. Growing cells were re-seeded at 1: 100 dilution into fresh 10 mL of LB medium supplemented with the appropriate antibiotic. When the OD600 value reached about 0.6, protein production with 1mM IPTG was induced at 370C for 4
27
hours or at 180C for 16 hours. After induction, the cells were lysed and total cell extract was taken, and protein production was checked by SDS-PAGE (Figure 7).
Figure 7. SDS-PAGE analysis of induced cell lysates of silicases A) extracts of cells induced at 180C for 16 hours (L: Ladder, cells containing 1: YadF, 2: SIA_SUBDO and 3: CAH_METTE vector, 4: BL21(DE3) cells) B) extracts of cells induced at 370C for 4 hours (cells containing 1: CAH_METTE, 2: SIA_SUBDO, 3: YadF vector, L: Ladder) (expected molecular weights: 28, 32 and 25, respectively)
According to the SDS-PAGE gel result, CAH_METTE and SIA_SUBDO proteins could not be produced. Protein production by growing cells at different temperatures and different induction times was analyzed by immunoblot (Figure 8,Figure 9).
28
Figure 8. Western Blot analysis of silicases A) induced and uninduced cells at different temperatures without glucose L: ladder 1: BL21(DE3), 2,6: uninduced cells containing SIA_SUBDO vector, 3,7: induced cells containing SIA_SUBDO vector, 4,8: uninduced cells containing CAH_METTE vector, 5,9: induced cells containing CAH_METTE vector. 2,3,4,5 cells were grown at 37 0C for 4 hours. 6,7,8,9 cells grown at 300C for 8 hours B) induced and uninduced cells at different temperatures with glucose 1,2: induced and uninduced cells containing CAH_METTE vector, respectively 3,4: induced and uninduced cells containing SIA_SUBDO vector, respectively 5,6: induced and uninduced cells containing YadF vector, respectively. Cells were grown at 370C for 4 hours.
29
Figure 9. Western Blot analysis of silicases A) induced cells at different temperatures L: ladder 1: BL21(DE3), 2,3: cells containing SIA_SUBDO vector induced either with glucose without glucose, respectively 4,5: cells containing CAH_METTE vector induced either with glucose without glucose, respectively 6,7: cells containing YadF vector induced either with glucose without glucose, respectively. Cells were grown at 300C for 6 hours. 8,9: cells containing YadF vector induced with glucose at 180C for 8 hours and 16 hours, respectively. B) induced cells at 180C with different incubation times 1,2: cells containing CAH_METTE vector induced either without glucose or with glucose, respectively for 8 hours 3,4: cells containing CAH_METTE vector induced either without glucose or with glucose, respectively for 16 hours 5,6: cells containing SIA_SUBDO vector induced either without glucose or with glucose, respectively for 8 hours 7,8: cells containing SIA_SUBDO vector induced either without glucose or with glucose, respectively for 16 hours, 9: BL21(DE3), L: Ladder (expected molecular weights: 32, 25, 28 kDa, respectively)
After trying different temperatures and different incubation times, SIA_SUBDO and CAH_METTE expressions could not be seen, and the cells were grown in
30
autoinduction medium. Protein production was analyzed by SDS-PAGE by collecting samples after induction, purification, and concentration (Figure 10).
Figure 10. SDS-PAGE analysis of purification silicases after autoinduction A) 1,2,3: cell extracts containing YadF, SIA_SUBDO, CAH_METTE vector, respectively.4,5,6: purified proteins and 7,8,9: concentrated proteins, respectively. B) 1,2,3: purified proteins: CAH_METTE, SIA_SUBDO, YadF, respectively. 4,5,6: concentrated proteins in the same order (expected molecular weights: 32, 25, 28 kDa, respectively)
According to SDS-PAGE analysis, this time the CAH_METTE and SIA_SUBDO proteins were produced, but the proteins were lost during the concentration process. Therefore, it was decided to use the concentrator for 3kDa and higher instead of the concentrator for proteins of 10kDa and heavier. In addition, since the purified proteins are not sufficiently purified, the purification process will be repeated by washing the column properly. In addition, it has been found that the YadF protein is not expressed in the auto-induction environment.
3.2. Display of R5 Peptide Together with sfGFP on the Cell Surface
To attach R5 peptide to the 5 'end of, sfGFP gene in the Ag43 display cassette was amplified with primers at 660C by PCR reaction (Figure 11.A). To complete
31
the vector, the Ag43 160N sequence was amplified with primers REA35-REA17 by PCR at an adhesion temperature of 68 ° C. The sfGFP gene was secondly amplified with primers REA34-BMK11 by the PCR at an adhesion temperature of 66 ° C using primers to insert the entire R5 sequence. For cloning the PCR-amplified DNA fragments into the vector, the pET22b vector was linearized digestion with NcoI-XhoI restriction enzymes (Figure 11.B). The Ag43 160N and R5-sfGFP genes and the pET22b vector were assembled by Gibson Assembly method.
Figure 11. Cloning of pET22b (+) T7 pLacO pelB R5-sfGFP Ag43 160N vector. A) Amplification of part of the R5-sfGFP gene by PCR. (expected band length: 839 bp). B) PZR amplification of the region encoding Ag43 160N from left to right, amplification of the entire part of the R5-sfGFP gene by PCR, cut of the pET22b (+) T7 pLacO vector by XhoI-NcoI (expected bands, respectively: 2544 bp, 892 bp, 5431 bp)
At the end of the reaction, the combined DNA fragments were transformed into the DH5α PRO cell by chemical transformation. Cells inoculated on agar medium supplemented with the appropriate antibiotic and incubated to grow overnight.
32
The verification of the vectors after plasmid isolation from the cells was proven by sequencing (Figure C. 4).
The verified isolated vectors were transformed into B121 (DE3) cell by chemical transformation method. Cells inoculated on agar medium supplemented with the appropriate antibiotic and incubated to grow overnight. One of the single cell colonies observed in the petri dish in the morning was selected and planted with the appropriate antibiotic in LB medium. In addition, B121 (DE3) cell without vector was inoculated into LB medium to be used as negative control. The implanted cells were left to grow overnight. Growing cells were re-seeded in the morning into 10 mL of LB medium supplemented with the appropriate antibiotic at 1: 100 dilution. When the OD600 value reached approximately 0.4, protein production with 1mM IPTG was induced at 30 ° C for 8 hours. To understand the display of R5-sfGFP fusion protein on the cell surface, heat incubation was applied, and the fluorescence increase in the supernatants was observed (Figure 12).
33
Figure 12. Fluorescence changes in cell supernatants by heat incubation for analysis of the expression of R5-sfGFP protein on the cell surface. The obtained results were analyzed by two-way analysis of variance (ANOVA) (GraphPad Prism v6), the differences between the groups were marked with "*" (p ≤ 0.05, p ≤ 0.01, p ≤ 0.001 and p ≤ 0.0001 respectively "*", "**” Is represented by “***” and “****”). No marking was made in the groups that did not show significant differences.
According to the heat incubation experiment and ANOVA analysis, the R5-sfGFP was produced in cells that were significantly induced and demonstrated outside the cell.
Further demonstration of expression R5-sfGFP and display of it on the cell surface, SDS-PAGE (Figure 13) and western blot (Figure 14) analysis were done after heat treatment.
34
Figure 13. SDS-PAGE analysis of expression of R5-sfGFP with heat release experiment A) pellets and supernatants of cells whether they were heat-treated L: Ladder, 1,2: supernatant of BL21(DE3) heat-treated/untreated cells, respectively, 3: pellet of treated uninduced cells, 4,5: supernatant of treated/untreated uninduced cells, respectively, 6,8: pellet of untreated/treated induced cells, respectively. 7,9: supernatant of heat-untreated/treated induced cells, respectively. B) supernatants of cells L: Ladder 1,2: heat-untreated/treated uninduced cells, respectively 3,4: heat-untreated/treated induced cells, respectively (expected molecular weight: 68 kDa)
35
Figure 14. Western Blot analysis of expression of R5-sfGFP with heat release experiment L: Ladder, 1,2: supernatant of heat-treated/untreated of induced cells, 3,4: supernatant of heat-treated/untreated of uninduced cells, 5,6: supernatant of heat-treated/untreated of BL21(DE3) cells (expected molecular weight: 68 kDa)
Based on the above gel images, cells were expressing R5-sfGFP but not all of them were not displaying the protein on the surface. Further confirmation for display of the proteins, immunocytochemistry analysis was done to see only the displayed proteins (Figure 15).