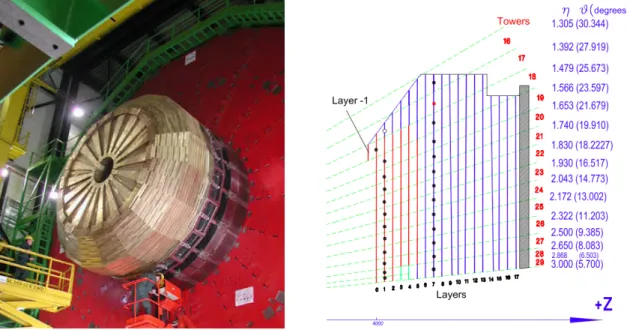
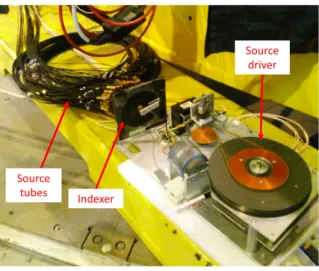
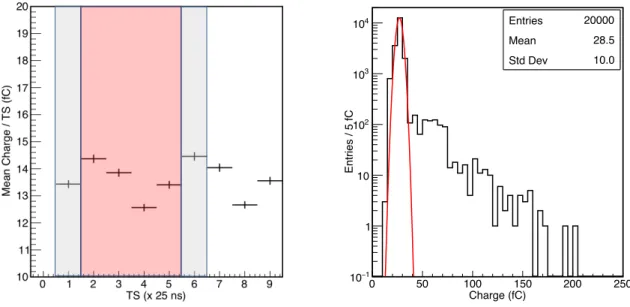
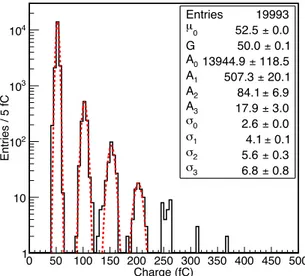
Radioactive source calibration test of the CMS Hadron Endcap Calorimeter test wedge with Phase I upgrade electronics
Tam metin
Şekil


Benzer Belgeler
Parlak oldu~u kadar zorunlu olan bir sava~~, bar~~~n aldat~c~~ görünü~üne tercih etmek isteyen korkak yürekliler ve ölgün ruhlular~n, benim tasar~m~n yenili~ini olu~turan
It is possible to observe some new formations with respect to conducting qualitative, critical and reflexive research. Besides the bureaucratic struc ture and rigidly
Key words: Modulus of smoothness, Muckenhoupt weight, weighted Lebesgue spaces, characterization, K -functional.. Introduction
Göl çevresindeki hayat özellikle milli park ilanıyla değiĢtiği için; baĢta tarım olmak üzere avcılık, hayvancılık, balıkçılık faaliyetlerindeki
This study tries to analyze the effects of monetary policy shocks on macroeconomic variables in small open economy by using Structural VAR approach of Cushman and Zha
1 Institute of High Energy Physics, Beijing 100049, People’s Republic of China 2 Beihang University, Beijing 100191, People’s Republic of China.. 3 Beijing Institute of
a) 1 lüdavendigâr Livasının Sivrihisar nahiyesi mezrca-sından Saru köyünde Yunus Emir bey'in bir çiftliği ve zaviye si varmış, çiftlik es kiden beri zaviyeye vakıf imiş.
fasında lâcivert zemin üzerine yaldızlı, yeşil, kırmızı, siyah, mavi renklerle haşiyeli levha denilen lezyinat vardır. Kenarında sular ara sındaki yaldızlı zincirler
