T.C
KARABUK UNIVERSITY INSTITUTE OF SOCIAL SCIENCES
DEPARTMENT OF BUSINESS ADMINISTRATION
A GLOBAL ANALYSIS ON FINANCIAL ANALYSING PRACTICES APPLIED IN STEEL SECTOR.
MASTER'S THESIS
Prepared By Ayşegül ŞEN YALÇIN
Thesis Supervisor
Dr. Assistant Prof. Metin KILIÇ
Karabuk
1
TABLE OF CONTENTS
TABLE OF CONTENTS ... 1
THESIS APPROVAL PAGE ... 3
DECLARATION ... 4
FOREWORD ... 5
ABSTRACT ... 6
ÖZ ... 7
ARCHIVE RECORD INFORMATION ... 8
ARŞİV KAYIT BİLGİLERİ (in Turkish) ... 9
ABBREVIATIONS ... 10
SUBJECT OF THE RESEARCH ... 11
PURPOSE AND IMPORTANCE OF THE RESEARCH ... 11
METHOD OF THE RESEARCH ... 12
HYPOTHESIS OF THE RESEARCH / RESEARCH PROBLEM ... 13
SCOPE AND LIMITATIONS ... 13
1. CHAPTER ONE: Financial Management ... 14
1.1. Meaning of Finance ... 14
1.2. Meaning of Financial Management ... 15
1.2.1. Corporate Finance ... 17
1.2.2. Financial Risk Management ... 21
1.2.2.1. Fraud Risks ... 23
1.2.2.2. Tax Compliance Risks ... 23
1.2.2.3. FX Risks ... 23
1.2.2.4. Pricing Risks ... 24
2. CHAPTER TWO: Financial Analysis ... 26
2.1. Financial Statements ... 27
2.1.1. The Income Statements ... 28
2.1.2. Balance Sheet ... 30
2.1.3. Cash Flow ... 32
2
2.2. Analysing Financial Statements ... 36
2.2.1. Common Size (Horizontal & Vertical) Analysis ... 37
2.2.2. Trend Analysis ... 38
2.2.3. Ratio Analysis ... 39
2.2.3.1. List of Financial Ratios ... 41
3. CHAPTER THREE: Steel Industry ... 46
3.1. The American Steel Industry ... 50
3.2. The Chinese Steel Industry ... 52
3.3. The Turkish Steel Industry ... 53
3.4. Financial Analysis in Steel Industry ... 56
3.4.1. Condensed Financials of Leading Steel Companies Over the World ... 57
3.4.2. Analysing the Key Financial Ratios of Leading Steel Companies over the World ... 68
CONCLUSION ... 78
REFERENCES ... 80
LIST OF TABLES ... 85
FOREWORD
I never would have managed to complete this thesis study without the overwhelming amount of help and support that I gained from my lecture Ass. Prof. Metin KILIÇ, my mother who has also been taking care of my lovely little daughter named Hira and all the rest of my family especially my beloved husband Fatih YALÇIN. I would like to thank all of them with all my heart.
ABSTRACT
Financial information of the companies that operates in any field is a vital to get a clear understanding about them. It is inevitable that the most common and the reliable way of providing information about a company’s economic performance is the preparation of financial statements.
Analyzing the financials of companies, which operates in the same field, is such a complicated issue since their capacities, production and sales amounts and therefore the profit abilities are quite changeable factors that impact their financials. Financial analysis methods are coming into use at that point and they make the comparisons much easier and meaningful among the competitive companies.
The commonly applied financial analysis methods could be changeable from sector to sector but in general speaking, the financial ratio analysis is one of the most frequently used and reliable one in many fields.
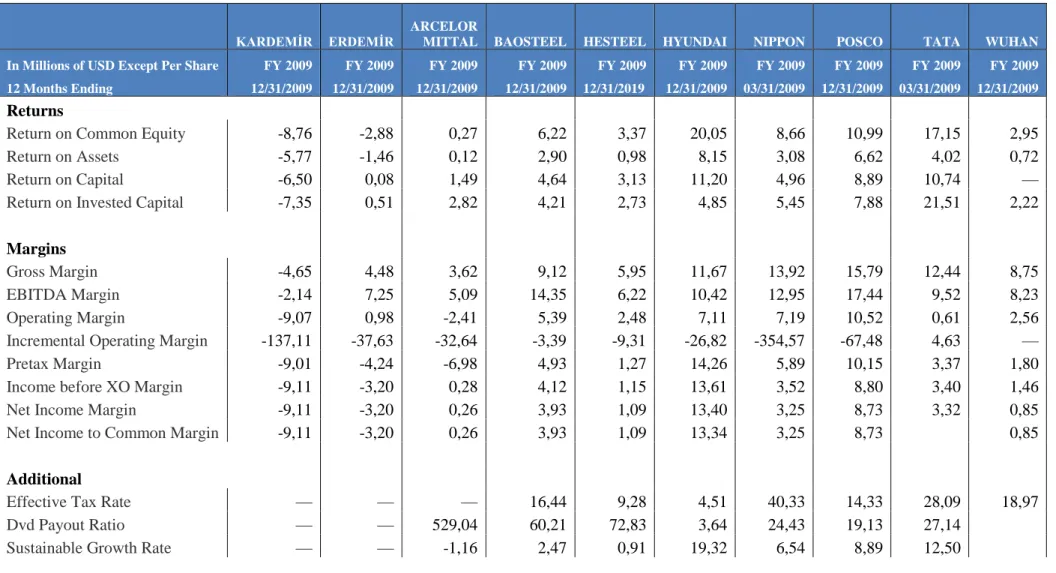
The steel industry has been taken into consideration in this study and the financial ratios of the world’s 10 leading steel companies’ have been examined in detailed. While the condensed financial statements of these leading steel companies have being showed in this study, their key financial ratios (in percentages) are also commuted and listed as tables showing the figures for the last decade.
7
ÖZ
Operasyon gösterdiği sektör farketmeksizin şirketler hakkında açık ve anlaşılır bilgiye ulaşmak için finansal bilgiler hayati öneme sahiptir. Yadsınamaz bir gerçek varsa o da şudur ki, bir şirketin ekonomik performansı hakkında bilgi vermenin en çok karşılaşılan ve en güvenilir yolu Mali tablo hazırlamaktır.
Aynı alanda operasyon gösteren şirketlerin kapasiteleri, üretim ve satış miktarları ve karlılık oranları oldukça değişkenlik gösterebildiği için, bu şirketlerin finansallarının analizi epeyi karışık bir konudur. Finansal analiz methodları ise işte tamda bu noktada analistlerin yardımına koşmaktadır ve bu analiz yöntemleri ile rekabetçi firmalar arasında kıyslamalar çok daha basit ve anlamlı hale getirilebilmektedir.
En çok uygulanan finansal analiz yöntemi sektöreden sektöre değişkenlik gösterebilir ancak genel olarak pek çok alanda, finansal rasyo analizi en sık kullanılan ve en güvenilir sayılan yöntemlerden biridir.
Bu çalışmada Çelik sektörü ele alınmış olup, dünyanın önde gelen 10 çelik şirketinin finansal rasyoları detaylı bir şekilde incelenmiştir. Bir yandan bu önde gelen çelik şirketlerinin son 10 yıla ait özet Mali tabloları gösterilirken öte yandan onların aynı yıllara ait ana finansal rasyoları (yüzdelik olarak) hesaplanarak tablolar halinde gösterilmiştir.
8
ARCHIVE RECORD INFORMATION
Title of the Thesis A Global Analysis on Financial Analysing Practices Applied in Steel Sector.
Author of the Thesis Ayşegül ŞEN YALÇIN Supervisor of the
Thesis
Assist. Prof. Dr. Metin KILIÇ
Status of the Thesis Master Thesis Date of the Thesis 07.10.2019
Field of the Thesis Business Administration Place of the Thesis KBU/SBE
Total Page Number 87
9
ARŞİV KAYIT BİLGİLERİ (in Turkish)
Tezin Adı Çelik Sektöründe Finansal Analiz Uygulamaları Tezin Yazarı Ayşegül ŞEN YALÇINTezin Danışmanı Dr. Öğr. Üyesi Metin KILIÇ Tezin Derecesi Yüksek Lisans
Tezin Tarihi 07.10.2019 Tezin Alanı İşletme Tezin Yeri KBU/SBE Tezin Sayfa Sayısı 87
10
ABBREVIATIONS
RoW : Rest of World
GDP : Gross Domestic Products RoA : Return on Assets
CCC : Cash Conversion Cycle
EBIT: Earnings Before Interest and Taxes EPS : Earnings Per Share
BOF : Basic Oxygen Furnace EAF : Electric Arc Furnace
11
SUBJECT OF THE RESEARCH
The subject of this thesis study is to examine the financial ratio analysis applied in steel industry and computing the financial ratios of leading steel companies through the world in recent decade.
PURPOSE AND IMPORTANCE OF THE RESEARCH
It is difficult to give a definition to finance - the premises’ have many faces, which make it difficult to provide a clear explanation.
The term of finance as it is known today, grows out because of economics and accounting systems. The asset’s value of the notions have been growing up by the economists, which usually based on the future cash flows that will be provided via assets. Accounting plays the key role for the business. Companies’ activities are translated into numbers that provide a brief information about its economic situation and the performance including the problems faced. Finance is a kind of art that interpreting the accounting numbers for performance valuation, showing the actual status and planning the future actions.
In an enterprise system, the initial aim of financial management is to help financial managers to upper the companies’ values. Financial markets also include the determining of stock and bond values, for this reason, a clear understanding of those issues is a must for anyone who is interested in finance.
Corporate finance is the synonym for the term of financial management. Financial management or the corporate finance in other words, focuses on the financial decisions regarding to types of the assets to procure, raising the needed capital and how to run the company to maximize its fair market value.
Financial management is also called corporate finance, focuses on decisions relating to what types of assets to acquire, how to raise the capital needed to purchase assets, and how to run the firm to maximize its value.
12
Although corporate financing decisions are usually the responsibility of top executives and their finance staffs, there are several reasons managers at all levels need to understand the logic on which these decisions rest. First, we all make similar financing decisions in our personal lives whenever we borrow money to buy a home, a car, or return to school. Second, as investors, we are often consumers of the financial securities that companies issue, and it is always wise to be an informed consumer. Third, and most important for present purposes, sound financing decisions are central to effective financial management. This is witnessed by the fact that financial leverage is one of the levers of performance. Therefore, failure to appreciate the logic driving an enterprise’s financing decisions robs managers of a complete understanding of their company and its challenges.
The development of steel industry is critically linked with the overall growth of the economy. As a metal, steel has had a long journey from the early days when it enjoyed only limited usage avenues. It has a splended versatility, which has enabled it to transgress all barriers. It has great advantages like long life, minimum maintenance cost, forward/backward linkage and resale value.
In a study at European University Institute of Florence in 1980, the steel industry looked the apparent arena in which is in a mutual interaction in the Community. No one could have foreseen at that stage that this industry, which had already paid heavy prices in the crises, would founder even more deeply into the quagmire and be exposed to further exceptional pressures. (Meny and Wright, 1987:12)
The purpose of this study is to determine the most commonly applied financial management and analysing systems through the iron and steel companies and having some tables showing the specific financial ratios of leading steel companies in the world. After having all these ratios on hand, it could allow us to get a result on the issue of financial ratio analyses from the investor’s point of view.
METHOD OF THE RESEARCH
In order to reach the goal of this thesis study the literature search / document analysing mythologies were applied.
13
HYPOTHESIS OF THE RESEARCH / RESEARCH PROBLEM
The below listed hypothesis are accepted as true without any doubt and no need investigate:1. Publicly available financial information of the inspected steel companies are accepted as correct.
2. The sources used in this study are accepted as providing updated, valid, true and enough information.
SCOPE AND LIMITATIONS
There is a company limitation on this study as it could not be possible to examine all the companies’ financial ratios that operate in steel sector, for this reason I have limited them as the leading ten over the world. The financial figures that are used in this study are also limited to publicly available financial statements.
14
1. CHAPTER ONE: Financial Management
The meanings of key words regarding to finance and financial management process are explained under this title.
1.1. Meaning of Finance
When tracing the origin of the term of finance, many evidences could be provided that it is showing that the finance issue is as old as human life on earth. The Finance as word originally comes from French. The meaning of “the management of money” is given to it by the English-speaking people in the 18th century. Additionally the word “EXCHANGE" could be easily used instead of finance. The meaning of finance is simply exchanging the available resources like money, securities or assets and it includes the managing the resources and therefore the barter systems are some important parts of finance (Akrani, 2011: 1).
Oxford dictionary, determines the word ‘finance' as the ‘management of money'. Another definition by Webster's Ninth New Collegiate Dictionary is like “the Science on study of the management of funds”. Funds management includes the money circulation, credit granting or making some investments as well as the banking facilities (Subramanian and Paramasivan, 2009: 2).
According to the Guthumann and Dougall, “Business finance can broadly be defined as the activity concerned with planning, raising, controlling, administering of the funds used in the business”. In the words of Parhter and Wert, “Business finance deals primarily with raising, administering and disbursing funds by privately owned business units operating in non- financial fields of industry” (Subramanian and Paramasivan, 2009: 3).
Finance, in other words, is an easy way of providing the needed funds like money or assets required by the companies or even individuals to achieve their economic goals.
15
Any business has the needs of finance to meet their goals and to survive in the economic environment. All kind of business activities depend on the finance. Some experts define finance as the art of managing money.
1.2. Meaning of Financial Management
Financial management allows anybody or any business to make the best planning to ensure a positive cash flow. Administration is also included in Financial Management as well as the prolongation of financial assets. Assessment is the primary concern of financial management, which is coming before the techniques of financial quantification.
Financial Management is a key part of the either economic or non-economic activities. These could lead the managers to decide the both most effective procurance and utilization of finance in a most profitable way. Within the scope of the traditional approaches, the financial management was a part of accountancy whereas it has expanded to the various business areas with the universal functions and innovations in today’s industrial world. Nowadays financial management has become a vital part of business concern (Subramanian and Paramasivan, 2009: 2).
Financial management is related to earning, funding and managing the assets through the goal in mind. For this reason, the financial management functions could be divided into three areas, which the first one is the investment, second is the financing and finally yet importantly is asset management (Horne and Machowicz, 2009: 21).
Importance of financial management is to meet each requirements of the business Environment. Any company should keep up adequate financial management regarding to fulfilling their smooth functioning business activities. In addition, one of the key importance of financial management is sustainable growth to achieve the companies planned goals. The importance of financial management cannot be denied in any case of business planning a controlling systems as well as the financial stability and to keep the companies away from bankruptcy.
Financial Management is strongly about the most efficient way of funds management in various business fields. To describe the business finance with simple words, it can be said that the financial management as practiced by company.
16
The most important financial management points could be listed as follow: a) Investment Decision: The Investment Decision related to the decision to be
taken by the investors or the finance managers regarding to the funds amount and the occasions to invest in. on other words, it is about selecting the areas and the types of the assets to be invested in.
b) Financial Planning; As a result of Financial planning it, each financial necessity of the organizations could be decided. Financial planning is also aim to take prompt and correct measurements in time instead of worries and difficulties to be faced in later stage of financial management life cycle of a company. Financial planning is such a crucial area, which linked to business concern. Typically, the most important key for business success is mostly depends on the financial planning of a company.
c) Protecting / Allocating Funds; Importance of financial management also includes protecting finance in hand towards achieving business goals. One has to determine the areas where the funds are required and allocated; it is the same in all kind of fields for smooth functioning of business. Overspending on one project may lack the finance in many cases. Proper utilization of the funds to assets enhance is important for the operational success of the company. When the funds are used appropriately and allocated wisely, it can help reducing expenses and increasing capital for the company.
d) Financial Decision; Financial decision is also one of the most important keys of financial management. Once the financial choice has made by a company it cannot be rewind. Once the money spent on a financial choice, it will not be repaid again for any wrong decision made. It is not unignorably that a financial selection could affect the all business operation. As the finance department has a clear relationship with all the other departments of a company.
17
e) Assets Management; “Once assets have been obtained and the proper funds are provided, these assets still needed to be managed successfully. The financial managers are responsible with operations over existing assets.” (Horne and Machowicz, 2009: 21)
f) Economic Growth and Stability; Proper financial management helps companies to ensure their economic growth. They can expand their wealth gradually. Which will help them to grow financially. It is the only way to ensure any company’s financial stability is through economic growth and only option to ensure the same aim is through financial management.
An effective financial management is supposed to have some objectives or goals, because judgment as to either or not a financial decision is efficient should be made in light of some standards. Various purposes could be likely in this case; however, the main objective of the company is to increase the wealth as much as possible.
Common stock shares give us an evidence about ownership. The market price per share of the company represents the shareholders wealth, which could be define as the reflection of companies’ financial management decisions on the important issues such as investments, financing, and asset management. One of the idea in order to measure the achievement of a business decision is to looking its effects on the companies share prices (Horne and Machowicz, 2009: 22-30).
1.2.1. Corporate Finance
Corporate finance decision is any decision that a company makes and which has financial implications, and any decision, which affects the financials of a company.
Corporate finance is the mixture of finance, which includes the financing, capital structuring and investment decisions at the same time. Corporate finance is initially about the maximizing of shareholder value through both long and short-term financial plans and strategies (Kenton, Date Accessed: 09.05.2019).
Assuming that anyone was about to start his own business. The type of job, that he is starting, is not important; he would have to answer the following questions in any case:
18
1. How long-term investments should he takes on? In other words, what sorts of equipment’s, buildings or machinery will he need?
2. Where will he get the long-term financing to pay his new investments? Will he borrow money via a bank?
3. How will he manage his daily financial activities such as paying suppliers as well as collecting from customers?
These are May not the only inquiries to be occur, but they are among the key ones. Corporate finance, in general, is the study of ways to answering these kind of inquiries (Ross,Westerfield and Jordan, 2002).
Capital structure of the company, including its funding and management’s actions in line with the increasing the firm value, is corporate finance. It also includes the tools and the analysis used in order to prioritize and distribute financial resources. The rules of Investment decisions are generally refers to capital budgeting techniques. The best technique is the will maximizing shareholders' wealth as well as the owners of the company. This essentials property could be divided into several criterias as follows:
• Considering the cash flows carefully.
• Discounting the cash flows at the alternative cost of funds.
• Selecting the best technique to maximize the shareholders' wealth.
• Seperating the projects and considering each one independently (this is known as the value-additivity principle) (Copeland and Weston, 1988).
The basic aim of corporate finance is maximizing the firm’s value with a right way of planning and implementing management resources while balancing the risk and profitability of the firm. It can apply to any firm in any sector from production to services and the other business fields (CFI, Date Accessed 01.03.2019).
Corporate finance teams are responsible with directing and foreseeing their copanies' financial activities and the decisions about capital investments. Such decisions can be whether a compulsory or a proposed investments and Corporate finance should
19
also be charged of deciding whether to pay for these investment with equity, debt, or both as well as the dividend issue that shareholders would like to receive.
Corporate managers are the delegates between the shareholders and the owners of the firm in the case of any conflict. Agency theoryi is to analysis of such conflicts, which is now a day’s one of the major part of the economic literature. Whether to give a devidend to shareholders can create major conflicts. The dividend payouts to shareholders means the reducing the resources under managers’ control, which also means that reducing their power too (Jensen, 1986: 323-329).
Managers have encouragements to grow their companies up further to the optimal size. The company grows the managers’ power increases by increasing the resources under their control (Murphy, 1985: 11-42).
The financial management functions are generally correlated with a top officer of the company, such as a vice president of finance or like chief financial officer (CFO). The responsibility of the vice president of finance is to coordinating the activities of the treasury department as well as the managers. While the controlling office handling various costs, payments and financial accounting, taxes, and management information systems etc. The responsibility of the treasurer’s office is being in charge of managing the companies’ cash and loans, its financial planning as well as its capital expenditures (Ross,Westerfiels and Jordan, 2002).
The financial manager’s responsibility is to make decisions concerning the acquisition and usage of funds in order to get the biggest benefit of the firm. Some specific activities that are involved in the financial managers’ working fields are like;
Forecasting and planning; managers should interact with other executives and making the plans, which can help shaping the company’s future.
Major investment and financing decisions; managers should help determining the optimal sales amount and expected growth rate; they also should help deciding on which assets to invest and best way to find these investments funds.
20
Coordination a Control; managers should be interacted with other executives to be sure that the company is operating efficiently. Any business decision has some financial implications (Weston, Besley and Brigham, 1996).
The first issue that occurs in minds regarding to the companies’ long-term investments is Capital Budgeting. The meaning of capital budgeting is the process of planning and managing the company’s long-term investments. Within the scope of capital budgeting, the financial manager should try to identifying the investment opportunities that are worth more for company to invest than they cost.
Capital Structure is the following question arising in the financial managers minds is to obtaining and managing long term financing which required in order supporting its long-term investments. A company’s capital structure (or financial structure) is the specific mixture of long-term debt and equity the company uses to finance its activities. The financial manager should have two concerns in this field that the first one is how much should the firm borrow? Is the mixture of debt and equity is best? The mixture chosen will affect either the risk or the value of the firm. Second, what are the cheapest sources of funds for their firm?”
There are three major problems faced by managers when making investment decisions. First, they always have to seek for new opportunities in the market or new technologies. Growth is based on this. Second, the estimated cash flows from the projects should be ready on hand, and finally, the projects should be evaluated before getting to final decision (Copeland and Weston, 1988).
Ideally financing the capital investments through the company’s resources, debt or mixture of both are the issues of capital structuring. It also includes the long term borrowings for the main capital expenditures. The equity and the debt, which are the main sources of a company, should be managed nested since having too much debt may increase the risk of default in repayment, which can lead the firm to bankruptcy (CFI, Date Accessed: 02.02.2019).
A company’s capital structure is vital to maximize the business value. Its structure should be a nice combination of both long-term and short-term liabilities as
21
well as its equity. In order to determining how well balanced or risky is the company’s capital structure, the ratios between the firm’s liabilities and its equity is used.
Development is a must for the company’s capital structure, with taking the risk into consideration since it has linked the value strongly. Risk may be includes for two consideration; first the business risk and the second is the financial risk (Phuntsho, 2013: 23).
1.2.2. Financial Risk Management
Financial risk may be defined in several ways. The nature of cash flow and transactional exposures should be well understood in order to have a better understanding of the impact of financial risk in any company. The risk could be either the amount involved or the timing. Understanding the companies’ risk factors in their financials is the most apperant way to understand such kind of risks. The impact of the changes in the reported earnings, for example, will be indicative of the situation that the company experienced.However, financial risk will extend to expected future transactions. Moreover, there is a term of economic exposure, which is wll known as the financial risk, which comes from the macroeconomic variables and the competitive position that the company involves (Moles, 2016: 11).
Risk management issue is one of the biggest part of corporate treasury. It depens on the business field and the structure of the company, the types of risk of a company may vary.
There could be plenty of different types of expected or unexpected risks of a company could be faced, but the most commonly faced risks through the treasury professionals are the financial risks such as FX, interest rate, liquidity, credit, etc. The management of financial risk could be seperated into two parts: one is risk measurement and the second is risk control. Generally, it is agreed on how to measure the risk than on how it should be controlled (Financial Risk Management: A Practitioner's Guide to
Managing Market and Credit Risk Second Edition, Date Accessed 02.03.2012).
While the financial risks have been increasing dramaticly in recent decades, risk and risk management are not modern times issues. Globalization shows us that any risk
22
could be caused by an event that is thousands of miles away and nothing to do in domestic markets. Information is available
The result of increasingly global markets is that risk may originate with events thousands of miles away that have nothing to do with the domestic market. Information is available instantly at anywhere, which means the change (Horcher, 2005: 1).
Well run fimrs’ operations plans are generally based on a set of forecasted financial statements. The process of financial planning starts with forcasting the sales amounts for the upcoming years. In order to achieve the targeted sales amounts, the assets will be required and the decision is needed to be made on how to finance these required assets. In this case, the balance sheet as well as the income statements should be projected. After determining the base case of forecasted financial statements and the key ratios, top managers will have to know (1) if the results are realictic to be reached, (2) how to reach the planned results (Weston, Besley and Brigham, 1996).
The risk profile of a company is determining via scope of its annual statementss. The greater the risks, the more requirements of audit testing. The independent auditors are seeking for such kind of risk factors which may cause the financial statements to be misstated. However, the auditors are worried of all kinds of risks that could impact the company because the financial statements reports could not be kept away from company’s operations. The assesments methods applied by the auditors could also be use by the management as a risk management developing system (Paul, 2012: 4).
The investment value of a company depends on the cash flow timing. One of the key principles of finance is that anybody prefers to receive cash flows as earlier as possible rather than later. Ten Liras, for example, received today is worth more than ten liras received next year because today’s liras can be invested to gain some interest. Therefore, the timing plays a big role in stock and bond prices.
The companies’ must consider the risks at any time. The amount and timing of cash flows are not usually known as certain. Most investor’s do not willing to have many risks (Ross,Westerfield and Jordan, 2002).
23
In order to have a good understanding of the types of the risks that the company may faced and categorized them based on the probability as well as the severity, the risk managers should normally coordinate the various business units. Some of the risks that large companies may faced are not limited to:
Fraud risks
Tax compliance risks
FX risks
Pricing risks
Risk managers need to manage wide range of risks types and nowadays more companies are focusing on early risk detection capabilities. There is a growing trend of being holistic fort he managers to have a better understanding of their companies business and being more involved in the strategic planning (Lee, 2017).
1.2.2.1. Fraud Risks
Fraud means an act that is giving misinformation or black out to mislead another parties. Some analytical procedures are applied by the independent auditors in order to avoid from fraudulent statements (C. Knapp, 2001: 25-27).,(M. Knapp 2001: 25-27).
1.2.2.2. Tax Compliance Risks
Financial intermediates such as banks, are nowadays became the delegate between the responsibles and the tax authorities. These kinds of institutions deliver the information they receive to the texing authorities through the World such as earnings, witholdings etc (Marian, 2013:3).
1.2.2.3. FX Risks
Since the buying and selling of different currencies are inevitable for the cosmopolitan companies over the world, FX (Foreign Exchange) risk is one of the most prevalent problem that they frequently faced with. These risks coul arise due to the
24
activities like sales and purchasing as well as the debt gained on a foreing currency, dividend payments etc.
Exchange controls, limitation on foreign currencies by the government are could be the another types of FX risks which are also likely to be born. In the lights of the above-mentioned information, it could be said that, if a company works as multinational, it is better to be familiarize itself with the laws related to the country’s currency (Lee, 2017:2).
1.2.2.4. Pricing Risks
Risk of a decline of a security value or an investment portfolio is called price risk. The less volatility, the less price risk sucs as stocks. There are many hedging techniques and tools ranging from concervative decisions to aggressive strategies. Price risk changes from a compant to others while it could be less for a well-established company, it could be felt very strongly for a small startup company. Price risk could be reduced easily comparing to the other types of risk by diversification. In order to lessen the price risk, the invested stocks should be varied. In other words, the investors should purchase different companies shares especially from different kind of business fields, which means not putting all the eggs into same basket (Kenton, Date Accessed: 09.05.2019).
In today’s modern world, both the treasury and the risk management departments are fundamentals for being a successful and sustainable for all leading organizations. It may have not been truer before; the treasury management helps to keep the liquidity on the expected levels to meet its liabilities, payments, bills and such kind of risks like Exchange rate, volatility on oil prices over the World etc. Furthermore, the analysisi and the assesments provided as a result of an effective treasury and risk management enables companies to be informed all the times and also to be capable to give better strategic decisions (Oxford, Date Accessed 10.04.2019).
Due to some Corporate governance rules and some compliance regulations that have became compulsory (like ISO 31000, an International Risk Management Standard) the emphasis on risk management have been increasing significantly in recent years (Lee, 2017:2).
25
A sample risk management system should include beow listed sections according to ISO 31000:
Risk management objectives (governance)
Risk strategy
Description of the potential risks in the environment
Acceptable risk levels
Risk management system
Risk assessment
Risk protocols
Risk response
Roles and responsibilities of risk management
26
2. CHAPTER TWO: Financial Analysis
Diagnosing the current and the past economic condition of any company and giving some hints about its itsfuture condition could be described as the puspose of financial analysis (Benton, 1983).
Determining the profitability, liabilities, strengths and future earnings potentials of a company is called the financial analysis. Assesment of a companies financial life force could be done via wide range of techniques. The most commonly applied techniques are horizontal analysis, vertical analysis and ratio analysis.
Since the financial analysis provide some important clues about the company’s current health and future potential, it is known as the critical point of Corporate governance. These analysis reports missions are not only providing critical datas to the investors but also allow the managers to measure their financial performance with regard to the expected results and the industry growth. From the managers perspectives, financial analysis are the key factors for the success and sustainability of the company as they shows the SWOT of the companies (Financial Planner World, Date Accessed 2019).
The aim of a financial statements of a company is to providing the key datas that are taken into consideration while decision making and also in order to evaluating the performance of the company to the key actors such as the owners, shareholders, creditors, competitors etc. Financial statements summarizes the basic accounting datas. The actors could be interested in various parts of these reports for example, the creditors are willing to know the liquidity of the company while government is examining them from the regulatary point of view. Profitability ratios are also attractive side of the reports for the Shareholders (Ilearnlot, Date Accessed 10.01.2019).
A brief information on the companies assets, equity, profit, liabilities, loss are given via financial statements. All these information may not be easily understandable
27
for the interested parties like shareholders, creditors etc. Therefore, there are many methods to analyses and interprete the financial statements.
Financial analysis consist of using several financial statements. These statements give information about some things. Initially, the balance sheet summarizes the assets, liabilities, and owners' equity of of the company at the current time, but generally annually or a quarter based. Second is the income statement, which summarizes the revenues as well as the expenses of the company through a limited period mostly based on quarterly periods and year-ends. While the balance sheet shows the snapshot of the company at that period, the income statements summarizes the pprofitability of it over the same period. Some useful derivatives statements can be produced via these main statements such as cash flow, statement of retained earnings etc (Horne and Machowicz, 2009).
2.1. Financial Statements
Financial statements are one of the most commonly used written records that shows the success of the company activities and the performance of it.
Firms must make full and fair disclosure of their operations by publishing financial statements and other reports required by the formal authorities. The avarage size of the annual reports sent to stockholders continues to increase each year (Weston, 1996: 77).
Financial statements are in use of people for the wide range of information needs. The users of them are generally but not limited to the managers, current investors, potential investors, shareholders, creditors, government, etc (Posthumus, Basson, Oliver and Watney, 2000).
Financial statements provide reliable datas to the investors as well as the analysts who are rely on the datas given by the company on the statements and use them to make predictions about its future value and the stock prices (Murphy, Date Accessed: 18.05.2019).
Consolidated financial statements are consist of both the main company’s financials and its subsidiaries. Consolidated statements provide a brief look at the
28
financial position of the main cmpany and its subsidiaries at he same time, and they show the snapshot of the overall health of an entire group (Consolidated Financial Statements, Date accessed: 22.05.2018).
Hamptors John syas that the financial statements are logical way of collection of accounting numbers. The aim of it is to provide a clear understanding of financial issues of the company. It could show the current position in the case of a balance sheet or income statements (Subramanian and Paramasivan, 2009: 2-20).
Footnotes to the financial statements give some additional information, which may help to explain how these figures are reached and any irregularity if available. Thus, the footnotes are the reports, which provide the details and additional information of the main parts of reporting. This is method is used for clarfying (Kenton, Date Accessed: 09.07.2018).
The main parts of the financial statements are the balance sheet, the income statement, and the cash flow statement. Financial statements are needed to be audited by some authorities such as government agencies, independent auditing firms, accountants, etc.
2.1.1. The Income Statements
Income statemnets are used in order to summarize the operating results of a company which is matching the earned revenue in a particular priod of time and the expenses occurred in order to earned that revenue in the same period that ares usually on a quarterly bases. The figures showing the revenue and expenses on the income statement are directly taken from the adjusted trial balance. The income statement demonstrates a net income when the revenue exceeds the total expenses, whereas it demonstrates a net loss if the total expenses exceed the revenue in the same priod. The net income or the loss for the period seen on the income statement is reported in the accumulated earnings statement thus it can be said that the income statement comes the first of allother financial statements (Accountingformanagement, Date Accessed: 27.03.2019).
There are some different terms to define the income statement such as statement of operations, earnings statement, and profit and loss statement (Drake, 2012).
29
The Income Statement is the outcome of the recorded information of a company and then these information separated into revenue and expences figures. It usually made up montly as of the closing of the books and shows the current picture of the revenue and expense figures of the company on a specific period of time such as a quarter or a fiscal year. While the managers use the income statement to value the pprofitability and the performance of the company, the investors and the creditors are also evaluating the companies via this report on the case of reisk assesments (Moneyinstructor, Date Accessed: 18.05.2019).
An income statement can give an idea of the growth of a company during the related period and when having a comparative ones on hand, it allow us to see the progress made since the last period end. In order to evaluate and analyse the profitability of the company, the changes in money values as well as the percentages could be designated (HelFert, 1972) .
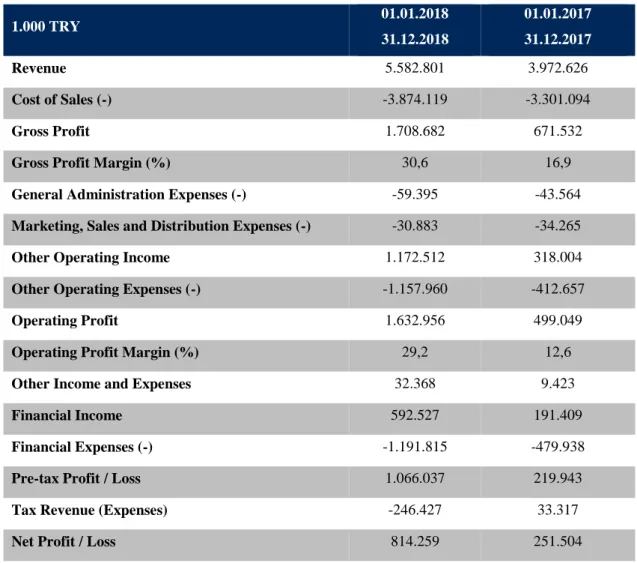
Table 1. Condensed Income Statement of Kardemir as of FY 2018
1.000 TRY 01.01.2018 31.12.2018 01.01.2017 31.12.2017 Revenue 5.582.801 3.972.626 Cost of Sales (-) -3.874.119 -3.301.094 Gross Profit 1.708.682 671.532
Gross Profit Margin (%) 30,6 16,9
General Administration Expenses (-) -59.395 -43.564
Marketing, Sales and Distribution Expenses (-) -30.883 -34.265
Other Operating Income 1.172.512 318.004
Other Operating Expenses (-) -1.157.960 -412.657
Operating Profit 1.632.956 499.049
Operating Profit Margin (%) 29,2 12,6
Other Income and Expenses 32.368 9.423
Financial Income 592.527 191.409
Financial Expenses (-) -1.191.815 -479.938
Pre-tax Profit / Loss 1.066.037 219.943
Tax Revenue (Expenses) -246.427 33.317
Net Profit / Loss 814.259 251.504
30 2.1.2. Balance Sheet
A balance sheet, which is also a kind of a most commonly used financial statement, underlined the figures showing a company’s liabilities, equity and its assets on a specific time period. It is usually used as the base of calculating the financial ratios and assessment of its capital structure. It is a report showing the liabilities and the assets of the company. This report is a fundamental part of calculating financial ratios besides the income statement as well as the cash flow statements (Hayes,Date Accessed:05.02. 2019).
The balance sheet addresses not only the total assets of a company but also the way they financed via either debt or equity. In other words, ıt could be called as the statement of worth or a statement of financial position. The simple formula of the balance sheet: Assets = Liabilities + Equity (Corporate Finance İnstitute, Date Accessed18.03.2019).
31 Table 2. Condensed Blance Sheet of Kardemir
Source: Kardemir, Date Accessed: 30.05.2019
1.000 TRY 31.12.2018 31.12.2017 1.000 TRY 31.12.2018 31.12.2017
Total Current
Assest 2.913.800 2.787.735 Current Liabilities 2.105.625 2.859.825
Cash and Cash
Equivalents 272.693 989.792 Short Term Borrowings 21.450 46.382 Trade Receivables 807.331 771.411 Current Portion of Long Term Borrowings 473.775 460.729
Inventories 1.645.139 755.692 Trade Receivables 1.378.424 1.408.680 Prepaid
Expenses 101.855 250.376 Deferred Income 104.245 861.193 Other Current Assets 86.782 20.464 Other 127.731 82.842 Total Long-Term Liabilities 2.040.026 1.620.550 Total Non-Current Assets 5.318.967 4.140.036 Long Term Borrowings 1.492.370 1.403.941 Tangible Assets 5.206.339 3.945.574 Other 53.046 39.572 Intangible Fixed Assets 32.883 37.006 Provisions for Employee Benefits 184.367 169.336 Deferred Tax Assets 988 120.035 Long-Term Deferred Revenues 7.749 7.701
Other 78.757 37.421 Deferred Tax
Liabilities 302.494 Shareholders' Equity 4.087.115 2.447.395 Paid-In Capital 1.140.000 1.140.000 Mutual Affiliates Capital Adjustment (-) -82.360 -79.980 Revaluation Fund 1.648.845 837.168 Restricted reserves allocated from profits 36.628 34.304 Retained Earnings 510.417 250.056
Net Profit/(Loss) for
the Period 814.485 251.545
Other 19.100 14.302
Total Assets 8.232.767 6.927.771 Total Equity and
32 2.1.3. Cash Flow
The cash flow statement shows the cash excahge, in a specific period, between an organization and the outside world and this is what makes the cash flow important. Because this can let the investors know if the company has enough cash to pay its expenses or not. Sometimes it could be difficult to interpret the profits stated on the income statement as it includes mostly non-cash elements and therefore not providing a figure about the company’s exchange of cash during the period. From the investors perspectives of view, cash but not only operating income also cash from all sources is determined as what pays back their investments. (Michelle Seidel, Date Accessed: 04.02.2019).
The cash sources of cash inflow and the outflow of a company concern in a limited time is shown on the cash flow statements. The cash flow statement of the company is just involves short-term financial position of it. The summary of cash flows over the investments, operating and financing is shown on this statement and it also reconciles them with changes in its cash and cash equivalents (Subramanian and Paramasivan: 2009).
33 Table 3. Cash Flow Statements of Kardemir as of FY 2019
Consolıdated Statement Of Cash Flows For The Year Ended 31 December 2018 (Amounts expressed in Turkish Lira (“TL”) unless otherwise indicated.)
Current period (Audited)
Prior period (Audited) Note 1 January — 31 December 2018 1 January -31 December 2017 CASH FLOWS FROM OPERATING ACTIVITIES 227.048.129 1.387.550.241 Net profit /(loss) for the year from operations (A) 814.259.158 251.504.356 Adjustments to reconcile net profit (loss) for the period (B) 1.057.397.876 494.960.830 Adjustments related to impairment (reversal)
Allowance (reversal) on inventories 8 (3.722.247) (5.239.393)
Impairment on goodwill 12
Allowance (reversal) related to trade receivables 7,15 2.900.535 98.871 Adjustments related to provisions
Provision (reversal) for employee benefits 17 32.961.527 30.667.701 Provision (reversal) for litigatio6 16 4.492.205 1.410.393 Adjustments for tax (income) / expense 28 251.778.250 (31.560.886) Depreciation and amortization expense 21,22 146.103.876 140.445.296 Adjustments related to interest (income) / expense
Interest expense 27 104.693.961 96.808.342
Interest income 26 (60.963.353) (29.769.086)
Deferred financing expense arising from credit sales 6 17.451.763 Adjustments related to profit / (loss) reconciliation 24 (372.348) 4.871.113 Adjustments related to fair value loss / (gain)
Fair value loss / (gain) from derivative financial instruments 26,27 41.482.563 11.836.887 Adjustments related to retained earnings of investments accounted under equity method
Share of profit from investments accounted under equity method 9 (228.832) 541.541 Adjustment for other items related with cash flow of investment or financial activities 25 (30.049.278) (8.072.694) Adjustments related to derivative swap contracts loss / (gain) 26,27 (56.868.359) 34.475.648 Adjustments related to unrealized foreign exchange differences 625.189.376 230.995.334 Net cash provided by operating activities before changes in working capital (C) (1.621.370.902) 653.687.359 Change in trade receivables (48.561.125) (367.578.092) Change in other receivables (46.868.965) (3.138.600)
Change in other payables 10.288.206 23.969.924
Change in inventories (877.421.856) (60.026.788)
Change in prepaid expenses 104.915.882 (127.075.920)
Change in trade payables (6.945.334) 721.836.720
Adjustments related to increase / (decrease) in other working capital items 121.772 17.412.849 Adjustments related to increase / (decrease) in deferred income (756.899.482) 448.287.266 Net cash provided from the operating activities (A+B+C) 250.286.132 1.400.152.545 Payments related to provisions for employee benefits 17 (12.111.388) (8.532.562) Payments related to other provisions 16 (3.560.277) (94.597) (Payments) / refunds for income taxes 28 (7.566.338) (3.965.685)
Other cash inflow / (outflow) 7 (9.460)
CASH FLOWS FROM INVESTING ACTIVITIES (340.824.881) (119.945.087) Cash inflow from sale of tangible and intangible assets
Proceed from the sale of tangible assets 11 220.808 1.478.562 Cash outflow from purchase of tangible and intangible assets
Purchase of tangible assets 11 (359.590.723) (126.158.739)
Purchase of intangible assets 12 (3.892.143)
Net cash outflow from subsidiary purchase- Enbatı (886.784) Cash outflow from acquisitions or due to capital increase (250.000)
Dividend received from investment in associates 9,25 30.049.278 8.627.233
Other (10.367.460)
CASH FLOWS FROM FINANCING ACTIVITIES (602.684.181) (608.088.575) Proceed from financial borrowings
Cash inflow from loans 453.002.727 387.916.300
Repayment of financial borrowings
Cash outflow for loan payments (939.490.873) (887.584.888) Cash outflows for repayment of financial lease liabilities (841.084) (1.285.111) Cash inflow from derivative financial instruments 151.617.049 16.304.230 Cash outflow from derivative financial instruments (106.585.577) (43.845.508)
Interest received 60.963.353 29.769.086
Interest paid (219.607.851) (108.027.074)
Cash outflow for purchasing own shares and other based on equity (2.379.425) (698.110)
Other cash inflow (outflow) 637.500 (637.500)
INCREASE/(DECREASE) IN CASH AND CASH EQUIVALENTS (716.460.933) 659.516.579 CASH AND CASH EQUIVALENTS AT THE BEGINNING OF PERIOD 4 989.154.857 329.638.278 CASH AND CASH EQUIVALENTS AT THE END OF PERIOD 4 272.693.924 989.154.857
34 2.1.4. Changes In Equity
Retained earnings statement is also other name of this statement. The information about the changes on the companies equity are shown on this table. However, this statement is not as much popular among the companies and it will probably not be prepared as a separate statement of changes in owner's equity (Subramanian and Paramasivan: 2009) .
35 Table 4. Changes in Equity of Kardemir as of FY 2018
Consolıdated Statement Of Changes In Equıty For The Year Ended 31 December 2018 (Amounts expressed in Turkish Lira (“TL”) unless otherwise indicated.)
Other comprehensive income /(loss) not to be
reclassified to profit or loss in subsequent periods Total retained earnings
Actuarial gain / (loss) arising from employee benefits Note Paid-in capital Capital adjustme nt differenc es Treasu ry shares (-) Share issue premium Actuarial gain / (loss) arising from employee benefits arising from investments accounted under equity method Revaluatio n fund of tangible assets Restricte d reserves assorted from profit Retained earnings Net profit/(loss ) for the year
Equity attributable to the parent Non-controlli ng interest Total equity Balance as of January 1, 2017 1.140.000.0 00 4.613.596 (79.282.26 2) 11.803.95 3 4.533.749 (182.123) 884.492.54 0 33.450.11 3 361.861.43 6 (123.789.8 79) 2.237.501.1 23 (115.062) 2.237.386.0 61 Net profit/(loss) for the year
251.545.43
6 251.545.436 (41.080)
251.504.35 6
Other comprehensive income/(loss) - - - - (6.311.252) - (34.485.96
1)
- - - (40.797.213
)
- (40.797.213
)
Total comprehensive income/(loss) - - - - (6.311.252) - (34.485.96
1) - - 251.545.43 6 210.748.223 (41.080) 210.707.14 3 Treasury shares (698.110) (698.110) (698.110) Transfers 19 - - - (12.838.90 5) 854.035 (111.805.0 09) 123.789.87 9 - - -Balance as of December 31, 2017 1.140.000.0 00 4.613.596 (79.980.37 2) 11.803.95 3 (1.777.503) (182.123) 837.167.67 4 34.304.14 8 250.056.42 7 251.545.43 6 2.447.551.2 36 (156.142) 2.447.395.0 94 Balance as of January 1, 2018 1.140.000.000 4.613.596 (79.980.372) 11.803.953 (1.777.503) (182.123) 837.167.67 4 34.304.14 8 250.056.42 7 251.545.43 6 2.447.551.23 6 (156.142 ) 2.447.395.0 94
Net profit/(loss) for the year
814.484.55
0 814.484.550
(225.392) 814.259.158
Other comprehensive income/(loss) - - - - 4.643.255 - 824.084.49
3
- - - 828.727.748 - 828.727.74 8
Total comprehensive income/(loss) - - - - 4.643.255 - 824.084.49
3 - - 814.484.55 0 1.643.212.29 8 (225.392 ) 1.642.986.9 06
Increase (decrease) due to Redemption
of Shares (2.379.425) - - -- - - - (2.379.425 ) - (2.379.425 ) Transfers - - - - - - (11.247.719) 2.323.771 260.469.3 84 (251.545.43 6) - - -Transfers 19 - - - - - -- - (1.268.344 ) - (1.268.344 ) 381.560 (886.784)
Increase (decrease), due to other changes - (1.159.135) - 1.159.135 - - - -Balance as of December 31, 2018 1.140.000. 000 4.613.596 (82.359.797) 11.803.953 2.865.752 (182.123) 1.648.845.313 36.627.91 9 510.416.6 02 814.484.55 0 4.087.115. 765 26 4.087.115. 791
36 2.2. Analysing Financial Statements
Financial statement analysis allow us to compare the companies’ financial performances, which are in the same field of business. Generally speaking these analysis help to identify a companies both strengths and weaknesses so we could determine its financial position. It also give some suggestions of the actions to be taken which can lead the company to use the advantage of its strength or in order to correct its weaknesses.
The importance of the financial statement analysis is inevitable fot either the company managers (especially the financial and risk managers) or the creditors and the investors. The internall managers use these analyisis to make the best investment and financing decisions and thus maximizing the company value. Since these analysis allow the externall actors, such as the creditors, shareholders and the investors, to evaluate if the company attractive enough to be invested in and alao how close the company to meet its current and expected financial obligations (Weston, Besley and Brighan, 1996).
The financial statement is the official document of a company that shows the all-financial information of it in a sepeciific period. Providing clear and true information and understanding of the companies financial aspects are the main purpose of the report. Thus, the importance of the financial statement is as high as the decisions.
“Financial statements are like a fine perfume - to be sniffed but not swallowed” (Brilloff, Date Accessed: 08.04.2019).
There are several techniques of financial data analysis to interpret the companies’ financial position among the competitors via the datas presented. Some of the most commonly applied techniques are common size analysis (horizontal and vertical), trend analysis and the ratios analysis. These analysis could be explained as the study of differences of the reported datas among the industries or the companies. While belending the information gained via these types of analysis the overall financial position could be determined (Gibson, 2009:5).
37
2.2.1. Common Size (Horizontal & Vertical) Analysis
Common size (horizontal & vertical) analysis addresses the comparisons in percentages. To give an example, wehen a company has $ 1.000.000 assets while having $40.000 cash, it means that the cash represents 4% of total assets. Using the percentages rather than the actual amounts is mostly preferable. To have a an example; lets say a company A earns $10.000 while the company B earns $ 1.000, the A seems to be more profitable at first sight however, the total equity of A $ 1.000.000 and B is USD 10.000 in this case, the equity is as follows:
Firm A Firm B
Earnings $ 10.000 = 1% $ 1.000 = 10%
Owners’ Equity $1.000.000 $ 10.000
The common size analysis usually applied in order to make the comparisons more meaningful among the companies in different sizes. The changes in amounts should be evaluated very carefully in this analysis because sometimes a very small change in the amounts can be seen as a significant change on the percentage. To give an example; assuming that a company’s profit was only USD 100 last year while it is USD 500 this year, this could be seen only an increase of USD 400 however it means an important percentage increase (GIBSON, 2009).
A base amount is selected for a Vertical analysis and each amounts are compared based on this selected one from the same year. To give an example, assuming that the advertising expenses were $2,000 in 2005 and sales were $200,000, which means that the advertising is 1% of sales. On the other hand, a base year is selected for Horizontal analysis and each amount is compared with the base amount in the same year. To give an another example, assuming that the sales amount was $600,000 in 2009 and it reached to $900,000 in 2010 which means that the sales has increased 50% from 2009 to 2010 (GIBSON, 2009).
38
Comparisons of the financial statement items means common size analysis. Each item on the financial statement is compared with a benchmark in this analysis (Drake). With usage of Horizontal analysis, we will be able to examine a specific items behaviours from the financial statements like sales or cost of goods sold over the time. The items on the income statements or the balance sheet are analysis via Vertical analysis in a specific period of time. When making a vertical analysis on the income statement all the figures are stated as a percentage of sales whereas all the items are stated as a percentage of total assets when analysing the balance sheet.
2.2.2. Trend Analysis
The financial statements could be analysed via calculating some ratios with using the information given on them. Each item on the financial statements could be taken into percentage relationship and each one can have upward or downward directions over the common value of 100%. Trend analysis helps us to get a better understanding of the trend relationship with several items that are shown on the financial statements. These percentages could be considered as the index figures which show the upwards or downwards of financial information results in different time periods (T.Subramanian, 2009).
When the total assets grow, most of the other accounts must also must grow for this reason, we can combined the trend analysis with common size analysis, which mentioned earlier (Whitehurst, 2011).
Exercise
Please compute the trend analysis from above mentioned information via taking the 1999 as the base year and make an interpretation (in thousands) (T.Subramanian, 2009).
Year Deposits Advances Profit
1999 2,05,59,498 97,14,728 3,50,311 2000 2,66,45,251 1,25,50,440 4,06,287 2001 3,19,80,696 1,58,83,495 5,04,020 2002 3,72,99,877 1,77,26,607 5,53,525 2003 4,08,45,783 1,95,99,764 6,37,634 2004 4,40,42,730 2,11,39,869 8,06,755
39 Solution
Trend Analysis (Base year 1999 = 100)
Year
Deposits Advances Profits
Amount Rs. Trend Percentage Amount Rs. Trend Percentage Amount Rs. Trend Percentage 1999 2,05,59,498 100.0 97,14,728 100.0 3,50,311 100.0 2000 2,66,45,251 129.6 1,25,50,440 129.2 4,06,287 115.9 2001 3,19,80,696 155.5 1,58,83,495 163.5 5,04,020 143.9 2002 3,72,99,877 181.4 1,77,26,607 182.5 5,53,525 150.0 2003 4,08,45,783 198.7 1,95,99,764 201.8 6,37,634 182.0 2004 4,40,42,730 214.2 2,11,39,869 217.6 8,06,755 230.3 2.2.3. Ratio Analysis
Financial ratios analyisis is used to calculations in order to avoid the problems arise when comparing the different size of companies. These ratios help to examine and compare the relationships among the divided parts of financial information. Usage of ratios analysis help us to eliminate the size problems of the companies since the size is divided. In this way, we have the percentages and multiples on hand (Whitehurst, 2011).
Financial Ratios have been used in many cases within a company. Nevertheless, the most important case is the performance assessment. To give an example, the managers are mostly evaluated or compensated by the investors or the owners on based of accounting performance results like profit margin and/or return on equity ratios. In addition, the companies with multiple division could compare themselves with the competitors in the same field with using the information reported on the financial statement which is also very practical for making new projections for the future as well as checking how realistic was the assumptions made by the companies (Westerfield, Jaffe, Roberts and Ross 2015:92).
The accounting data capability sometimes seems to be axiomatically by plenty of accountants; however, it explores how accounting datas have been used. The growing paths of financial ratio analysis is differs from creditors point of view to managerial perspectives. While the managers mostly emphasizes with profitability measures, the creditors emphasized measures of ability to pay (Horrigan, 1968: 284-294).
40
Tere is a doubt in financial ratio discussions simply because a ratio means dividing a number to another one whic means that a plenty of possible ratios could be reached and examined. Eveybody or each company can have its favouritte ones (Whitehurst, 2011).
In order to examine and describe the economic activities we can also utilize the financial ratios. For this reason, we should first evaluate the predictive power of ratios. Interest earned ratio and the net profit to sales ratios are effective predictors default experience according to Hickman in the case of corporate bond during 1900-1943, but Saulnier and some others stated that borrowing companies with weak current ratios as well as the net worth to debt ratios are more likely to have loan defaults (Horrigan, 1968: 284-294).
There is a doubt about the definition of the ratios simply because different experts and the sources could may not define the ratios in the same way. Thus the definition we use here quite likely to be different from the ones you have seen or may will see elsewhere. For all these reasons when using the ratios for an analysis make sure that you are documented the calculation way for each of the ratios an when even comparing the figures to the other sources figures also be sure about the way these figures are computed.
Financial ratios are generally expressed as percentages per time periods.
1. A company’s capability to meet its current obligations is measured via Liquidity ratio. It can simply measure the efficiency of utilization of current assets and liabilities.
2. The Leveage (Borrowing capacity) ratio is used for the measuring the protection level of long term funds suppliers.
3. Profitability ratio is used to measuring the earning ability of the company.
4. Investors are interested in a special group of ratios, in addition to liquidity, debt, and profitability ratios.
5. The profitability, liquidity or borrowing capacity could be indicated via Cash flow ratios. Any pair of numbers could be used for calculating a ratio. With taking the wide range of variables stated on the financial statement into consideration, plenty of meaningful ratios could
41
be reached. There is not either a standard list of ratios or standard of computation of them. There could be different lists of financial ratios and different formulas for the sameratios on each sources. Comparisons of the ratios could be interpreted (1) prior ratios, (2) ratios of competitors, (3) industry ratios, and (4) predetermined standards. It should be underlined that the trend of a ratio and the variability of it are the key issues (Gibson, 2009).
When the financial statements are made up then the ratio analysis becomes a tool of analysts (Smith, 1989).
2.2.3.1.1. List of Financial Ratios
It is possible to classify the financial ratios which measure: management efficiency, liquidity, profitability, leverage, and valuation & growth.
Various financial ratios are listed below. It should be taken into consideration that the the ratios could also be commuted in percentages by multiplying the decimal number by 100%. The definition of the main ratios are listed below.
a. Profitability Ratios
Gross Profit Rate = Gross Profit ÷ Net Sales
Shows the gross profit comes from sales. Net sales minus cost of sales is equal to gross profit.
Gross Profit Margin = ( Gross Profit ÷ Net Sales ) * 100 It is the expression of gross profit in percentage.
Return on Sales = Net Income ÷ Net Sales
It is also called as net profit margin (rate) which is used to measure the percentage of income from sales. It is better to have it as high as possible.
42
Return on Assets = Net Income ÷ Average Total Assets
This is the measurement of return on investment (ROA). This ratio is used in financial analysis for the aim of evaluating the management if they are successful to generate income via using assets.
Return on Stockholders' Equity = Net Income ÷ Average Stockholders' Equity It is the measurement of financial performance.
b. Liquidity Ratios
Current Ratio = Current Assets ÷ Current Liabilities
Assesment of the company’s capability of paying its short-term obligations via usage of current assets.
Acid Test Ratio = Quick Assets ÷ Current Liabilities
It is also called as “quick ratio", which company’s capability of paying its short term obligations via usage of more liquid types of current assets such as cash and current receivables.
Cash Ratio = ( Cash + Marketable Securities ) ÷ Current Liabilities
Measurement of the company’s capability of paying its current liabilities via usage of cash and marketable securities.
Net Working Capital = Current Assets - Current Liabilities
Determines if the company’s current assets covers its current obligations and if there is any excess or deficiency.