SLIGHT DECLINE IN NON-AGRICULTURAL UNEMPLOYMENT
Seyfettin Gürsel*, Zümrüt İmamoğluand Ayşenur AcarAbstract
Seasonally adjusted labor market data shows that non-agricultural unemployment rate decreased by 0.1 percentage point in the period of August 2014 compared to the period of July 2014, and reached 12.4 percent. Non-agricultural employment increased much more than the non-agricultural labor force, hence non-agricultural unemployment decreased. Increase in non-agricultural employment was due to the increase in manufacturing employment that has been decreasing for a while and the increase in construction employment that has been stagnating. Employment in service sector continues to increase slightly. Consequently, we observe a slight decline in non-agricultural unemployment. Increases in employment are line with economic recovery in the third quarter of 2014. We expect that non-agricultural unemployment will stagnate in the next period.
Strong increases in non-agricultural labor force and employment
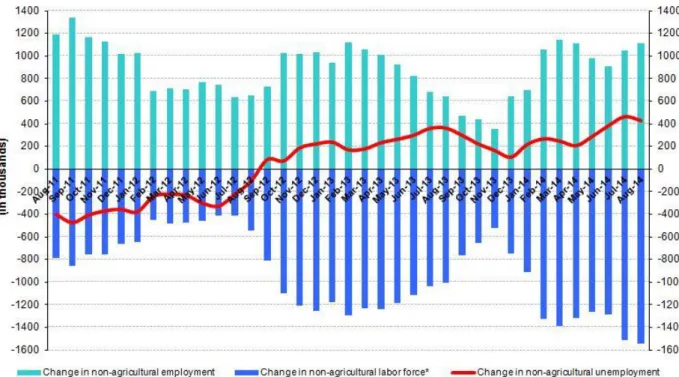
According to the data released by TurkSTAT, non-agricultural labor force increased by 1 million 542 thousand (7.1 percent) and non-agricultural employment increased by 1 million 112 thousand (5.7 percent) in the period of August 2014 (Figure 1). Consequently, the number of persons unemployed in non-agricultural sectors increased by 430 thousand. On the other hand, non-agricultural employment increased by over 1 million in the period of July, after stagnating since April 2014. It continued to increase in August 2014 as well.
Figure 1 Year-on-year changes in non-agricultural labor force, employment and unemployment
Source: TurkSTAT,Betam
*Prof. Dr. Seyfettin Gürsel, Betam, Director, [email protected]
Zümrüt İmamoğlu, PhD, Betam, Research Associate, [email protected] Ayşenur Acar, PhD, Betam, Research Assistant, [email protected]
Labor Market Outlook:
November 2014
www.betam.bahcesehir.edu.tr
2
Slight decline in non-agricultural unemployment
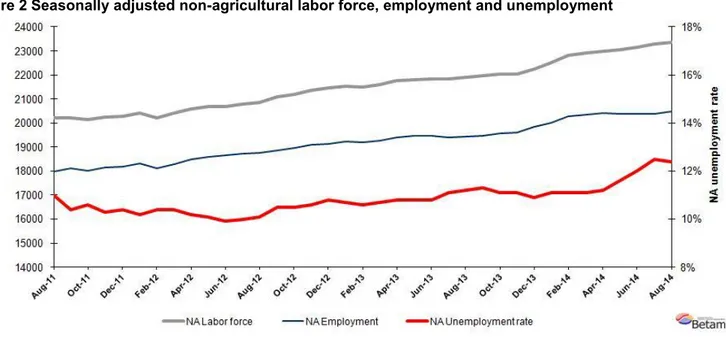
According to seasonally adjusted data, non-agricultural labor force increased by 83 thousand in the period of August 2014 compared to the period of July 2014, and reached 23 million 362 thousand (Figure 2, Table 1). Non-agricultural employment increased by 96 thousand and reached 20 million 465 thousand. Hence, the number of persons unemployed in non-agricultural sectors decreased by 13 thousand and non-agricultural unemployment rate decreased by 0.1 percentage point and reached 12.4 percent. Increase in non-agricultural labor force was counterbalanced with the increase in non-agricultural employment that has been either decreasing or slightly increasing since the period of March 2014. Therefore, non-agricultural unemployment slightly decreased in this period.
Figure 2 Seasonally adjusted non-agricultural labor force, employment and unemployment
Source: TurkStat,Betam
Non-agricultural unemployment will stagnate in the next period
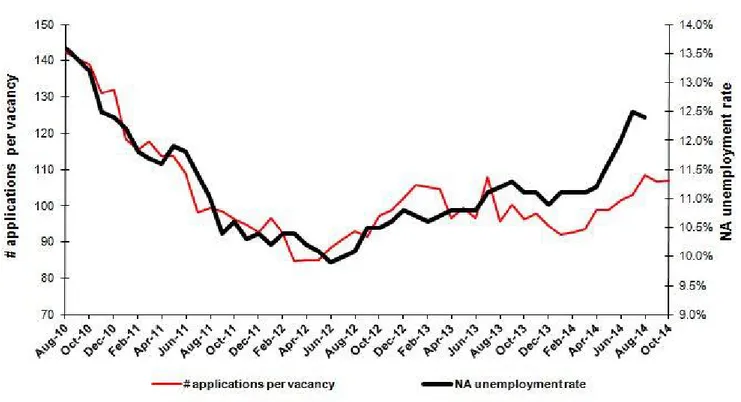
Our calculations based on the seasonally adjusted application per vacancy statistics calculated using Kariyer.net series are presented in Figure 3. Kariyer.net series that has been increasing since January 2014, continue to increase in July and August, but it has been stagnating since September 2014. The unemployment figures of August 2014 include the figures of July, August and September, and therefore, the stagnation in Kariyer.net series begins to reflect in the unemployment figures. It is noteworthy that the unemployment figures of September include the period of October. According to forecasting model of Betam, unemployment will stagnate in the next period.1 We expect a stagnation in employment and an increase in unemployment during the economic contraction in the second quarter of 2014. However, we observed rapid increases in unemployment in the last periods. Unemployment rate increased by 1.3 percentage points from 11.2 to 12.5 percent since the period of May 2014. A decline of 0.1 percentage point in unemployment could be a reflection of the economic recovery in the third quarter. However, according to the Kariyer.net series, one could expect a stagnation in unemployment rather than a remarkable decline. Hence, we expect that non-agricultural unemployment to stay over 12 percent.
1Soybilgen'in kullandığı tahmin modeli "Kariyer.net Verisiyle Kısa Vadeli Tarım Dışı İşsizlik Tahmini" başlıklı Betam Araştırma Notu 168'de ayrıntılı olarak tartışılmaktadır.
Soybilgen, B., "Kariyer.net Verisiyle Kısa Vadeli Tarım Dışı İşsizlik Tahmini", Betam Araştırma Notu 168. http://betam.bahcesehir.edu.tr/tr/2014/06/kariyer-net-verisiyle-kisa-vadeli-tarim-disi-issizlik-tahmini/
Figure 3 Seasonally adjusted non-agricultural unemployment rate and application per vacancy
Source: Kariyer.net, TurkStat,Betam
Recovery in manufacturing and construction employment
Seasonally adjusted labor market series show that employment increased in all sectors (with an exception of agricultural employment) in the period of August 2014 (Table 2, Figure 4).2Manufacturing employment that has
been decreasing for the last three periods, continued to increased in the period of August 2014. Similarly, construction employment that has been decreasing for the periods between March and June 2014, slightly increased in the previous period. Construction employment continues to increase rapidly in this period. Non-agricultural employment increased due to these recoveries in manufacturing and construction employment. As for service employment, we observe slight increases.
2Employment in each sector is seasonally adjusted separately. Hence the sum of these series may differ from the seasonally adjusted series of
www.betam.bahcesehir.edu.tr
4
Figure 4 Employment by sectors (in thousands)3Source: TurkStat,Betam
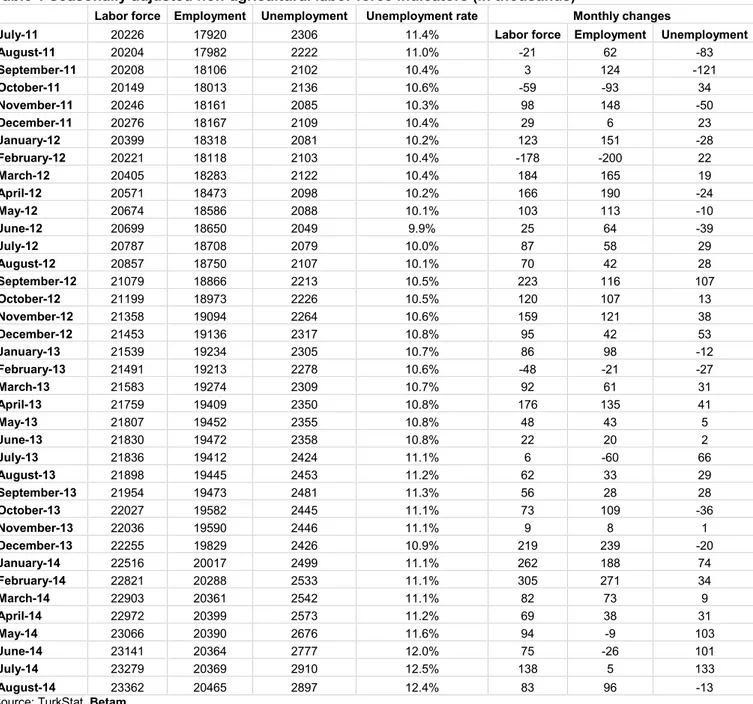
Table 1 Seasonally adjusted non-agricultural labor force indicators (in thousands)
Labor force Employment Unemployment Unemployment rate Monthly changes
July-11 20226 17920 2306 11.4% Labor force Employment Unemployment August-11 20204 17982 2222 11.0% -21 62 -83 September-11 20208 18106 2102 10.4% 3 124 -121 October-11 20149 18013 2136 10.6% -59 -93 34 November-11 20246 18161 2085 10.3% 98 148 -50 December-11 20276 18167 2109 10.4% 29 6 23 January-12 20399 18318 2081 10.2% 123 151 -28 February-12 20221 18118 2103 10.4% -178 -200 22 March-12 20405 18283 2122 10.4% 184 165 19 April-12 20571 18473 2098 10.2% 166 190 -24 May-12 20674 18586 2088 10.1% 103 113 -10 June-12 20699 18650 2049 9.9% 25 64 -39 July-12 20787 18708 2079 10.0% 87 58 29 August-12 20857 18750 2107 10.1% 70 42 28 September-12 21079 18866 2213 10.5% 223 116 107 October-12 21199 18973 2226 10.5% 120 107 13 November-12 21358 19094 2264 10.6% 159 121 38 December-12 21453 19136 2317 10.8% 95 42 53 January-13 21539 19234 2305 10.7% 86 98 -12 February-13 21491 19213 2278 10.6% -48 -21 -27 March-13 21583 19274 2309 10.7% 92 61 31 April-13 21759 19409 2350 10.8% 176 135 41 May-13 21807 19452 2355 10.8% 48 43 5 June-13 21830 19472 2358 10.8% 22 20 2 July-13 21836 19412 2424 11.1% 6 -60 66 August-13 21898 19445 2453 11.2% 62 33 29 September-13 21954 19473 2481 11.3% 56 28 28 October-13 22027 19582 2445 11.1% 73 109 -36 November-13 22036 19590 2446 11.1% 9 8 1 December-13 22255 19829 2426 10.9% 219 239 -20 January-14 22516 20017 2499 11.1% 262 188 74 February-14 22821 20288 2533 11.1% 305 271 34 March-14 22903 20361 2542 11.1% 82 73 9 April-14 22972 20399 2573 11.2% 69 38 31 May-14 23066 20390 2676 11.6% 94 -9 103 June-14 23141 20364 2777 12.0% 75 -26 101 July-14 23279 20369 2910 12.5% 138 5 133 August-14 23362 20465 2897 12.4% 83 96 -13 Source: TurkStat,Betam
6
Table 2 Seasonally adjusted employment by sector (in thousands)Agriculture Manufacturing Construction Service Monthly changes
July-11 5388 4846 1707 11367 Agriculture Manufacturing Construction Service August-11 5452 4816 1758 11408 64 -30 51 41 September-11 5383 4866 1760 11480 -69 50 2 72 October-11 5414 4823 1680 11510 31 -43 -80 30 November-11 5406 4870 1670 11622 -8 47 -10 112 December-11 5329 4873 1635 11659 -77 3 -35 37 January-12 5333 4864 1709 11745 4 -9 74 86 February-12 5276 4808 1565 11746 -57 -56 -144 1 March-12 5222 4850 1580 11853 -54 42 15 107 April-12 5249 4930 1653 11890 27 80 73 37 May-12 5293 4908 1727 11951 44 -22 74 61 June-12 5249 4900 1748 12001 -44 -8 21 50 July-12 5260 4926 1741 12041 11 26 -7 40 August-12 5257 4892 1761 12097 -3 -34 20 56 September-12 5319 4911 1777 12179 62 19 16 82 October-12 5357 4917 1781 12274 38 6 4 95 November-12 5365 5003 1802 12289 8 86 21 15 December-12 5346 5051 1776 12309 -19 48 -26 20 January-13 5331 5073 1812 12350 -15 22 36 41 February-13 5297 5023 1800 12389 -34 -50 -12 39 March-13 5281 5083 1785 12406 -16 60 -15 17 April-13 5269 5176 1807 12425 -12 93 22 19 May-13 5207 5200 1754 12498 -62 24 -53 73 June-13 5179 5163 1788 12521 -28 -37 34 23 July-13 5194 5146 1737 12529 15 -17 -51 8 August-13 5218 5117 1752 12577 24 -29 15 48 September-13 5208 5096 1776 12601 -10 -21 24 24 October-13 5119 5090 1848 12644 -89 -6 72 43 November-13 5077 5064 1804 12722 -42 -26 -44 78 December-13 5060 5131 1894 12803 -17 67 90 81 January-14 5402 5232 1947 12838 342 101 53 35 February-14 5530 5359 2013 12916 128 127 66 78 March-14 5599 5365 1980 13016 69 6 -33 100 April-14 5563 5373 1906 13121 -36 8 -74 105 May-14 5563 5364 1862 13163 0 -9 -44 42 June-14 5488 5332 1811 13222 -75 -32 -51 59 July-14 5413 5243 1817 13310 -75 -89 6 88 August-14 5370 5257 1851 13356 -43 14 34 46 Source: TurkStat,Betam