Contents lists available at ScienceDirect
Health
Policy
and
Technology
journal homepage: www.elsevier.com/locate/hlpt
Pricing
and
reimbursement
of
generic
pharmaceuticals
in
Turkey:
Evaluation
of
hypertension
drugs
from
2007
to
2013
Seda
Kumru
a,
Mehmet
Top
b, ∗a Medipol University Faculty of Health Sciences, Department of Health Care Management, 34200 ˙Istanbul, Turkey
b Hacettepe University Faculty of Economics and Administrative Sciences, Department of Health Care Management, 06800 Beytepe-Ankara, Turkey
a
r
t
i
c
l
e
i
n
f
o
Article history:
Available online 28 April 2018 Keywords:
Pharmacoeconomics Health economics Generic drugs
Generic pharmaceutical pricing Reimbursement
Internal reference pricing
a
b
s
t
r
a
c
t
Purpose: Thisstudywasdesignedtoexaminetheeffectsofdrugpricingandreimbursementpoliticson drugexpendituresfromJanuary2007toSeptember2013,withafocusoninternalreferencepricingin Turkey.
Method: Dataused inthisstudy arefromJanuary 2007toSeptember2013, whichincludesfivedrug clusters involvingoriginal drugs and thefirst generic drug (equivalentofthe original drug)that was availableonthemarket in2010and2011.Theeffectofthefirstgenericdrugthatenteredthemarket onoriginaldrugusewasanalyzedusingthetime-seriesanalysismethod.Toaccountfortheabsenceof genericdrugsinthemarket,originaldrugconsumptionwasestimatedandcomparedwithoriginaldrug consumptionfollowinggenericdrugentry.Winters’Additivewasselectedasthemostsuitablemethod toestimatetheconsumptionamountoftheoriginaldruginthefiveequivalentgroups.
Results: From2007to2012,theconsumptionofprescribeddrugsinthehypertensiongroupincreased about63%andhypertensiondrugexpendituresoftheSocialSecurityInstitute(SSI)increasedalmost82%. Between2007and2012,theincreaseinhypertensiondrugconsumptionnotincludedintheequivalent groupwas 83%,whereasit wascalculatedas 61%fordrugsintheequivalentgroup.Thepricesofthe originalandgenericdrugsweresimilarastimewentbyandafterregulationbyauthorities.
Conclusion: ThegenericdrugmarketinTurkeyhasnotreacheditsfullpotential.Originalpharmaceuticals stilldominatemostofthemarket.TheinternalreferencepricingsysteminTurkeyhasnotbeenableto encouragepricecompetitivenessandpricereductions.
© 2018FellowshipofPostgraduateMedicine.PublishedbyElsevierLtd.Allrightsreserved.
Introduction
Pharmaceuticals are a significant driver of cost in healthcare for the various reasons. Many countries have implemented different cost-containment policies that are adapted to their own economic and health needs for drug pricing and reimbursement processes ( Table 1) [1–3]. Reference pricing is one of the most commonly used methods for cost containment in drug expenditures [4]. Dan- zon divided reference pricing (IRP) and external reference pricing (ERP) [5]. ERP involves determining a product’s price based on its prices in other countries [6]. ERP tends to reduce price differentials between countries [7]. Leopold et al. revealed that richer coun- tries tend to reference other richer countries, while poorer coun- tries reference other poorer countries [8].
∗ Corresponding author.
E-mail addresses: [email protected] (S. Kumru), [email protected] (M. Top).
IRP is a reimbursement instrument used by third party pay- ers. The maximum price of a pharmaceutical is determined with reference to the prices of equivalent medicines in the same mar- ket [5]. Equivalent medicines are put together in reference groups defined by the active substance (Anatomical Therapeutic Chemical (ATC) level 5), chemically related active substances (ATC level 4), or disease area (ATC level 3). These groups may differ between coun- tries, such as Germany, which has jumbo classes for statins and proton pump inhibitors (PPIs) [9]. ATC level 4 medicines are also prevalent in a number of Central and Eastern European countries to help conserve costs, such as anti-psychotics in Poland [10].
Generic medicines are the equivalents of their trademark coun- terparts in terms of chemical structure, bioequivalence, dosage form, route of administration, effectiveness, molecule, saf ety, and quality [11,12]. The results of a recent studies show that brand-name drugs are not superior to generic drugs, including hypertensive drugs, antiepileptic medications, and statins [13–20]. Therefore, generic drugs are cheaper than the originals and can be substituted for them [12,21,22]. In Sweden, patients have to pay https://doi.org/10.1016/j.hlpt.2018.03.004
Table 1
Pricing and reimbursement policies for generic drugs. Free pricing Direct price
controls
Use of international price comparisons
Internal reference pricing
Definitions of internal reference price
Germany X Statistically derived median price for drugs containing the same active
substance and having comparable efficacy.
Netherlands X X X Average price of drugs with similar pharmacotherapeutic effects.
Denmark X X Lowest priced generic equivalent available on the market.
Spain X X Arithmetic mean of the three lowest cost-per-treatment-day grouped
by formulation and calculated by DDD.
Italy X Lowest priced generic equivalent available on the market.
Portugal X X Lowest priced generic equivalent available on the market.
Turkey X X X The lowest priced generic equivalent in the market and a price range
of up to 10% of this price.
Sources: Mossialos, E., Walley, T., and Mrazek, M. Regulating pharmaceuticals in Europe: an overview. In: E. Mossialos, M. Mrazek, and T. Walley (Eds.) Regulating pharma- ceuticals in Europe: striving for efficiency, equity and quality. Open University Press, England; 2004: 1–37. Puig-Junoy, J. Impact of European pharmaceutical price regulation on generic price competition a review. Pharmacoeconomics. 2010; 28(8): 649–663. [2,3]
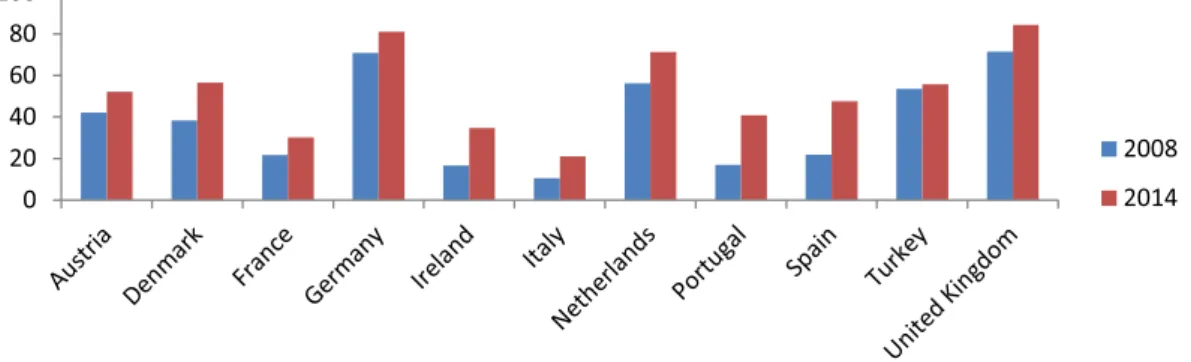
Fig. 1. Volume based market share of generic drugs (%).
Source: OECD. Pharmaceutical Market [Internet]. 2017 [cited 2017 Sep 10]. Available from: http://stats.oecd.org/Index.aspx?DataSetCode=HEALTH _ PHMC ).
the differences in price between original and generic drugs if they prefer to take the original one [9]. Thus, the use of generic drugs has resulted in significant cost savings in healthcare in recent years [11,12,22–25].
Governments are implementing supply-side or demand-side policies to increase the use of generic drugs, such as in France, Belgium, and Ireland. The application of supply-side policies pro- vides for the creation of lower price levels for substitutable drugs [1,26]. Some of the lowest generic prices have been seen in Nether- lands, Sweden, and the United Kingdom. For example, the prices of omeprazole and simvastatin are as low as 2–4% of the pre- patent loss prices, which are much lower than the generic prices in France, Belgium or Ireland [27–29]. Several demand-side measures across Europe have been established to enhance the prescription of generics. These measures include educational activities, prescrip- tion targets, financial incentives including patient copayment dif- ferentials, compulsory International Non-proprietary Name (INN) prescriptions, and prescription restrictions. Some researchers argue that lower prices for generics are found in European countries with higher volumes [30–32]. The impact of supply-side and demand- side measures can make a considerable difference in overall ex- penditure. For example, when adjusted for population size, expen- diture on PPIs and statins in Sweden in 2007 was over 10 times that in Ireland, which has resulted from aggressive reforms to in- crease generic volumes (compulsory substitution) and increase use of generics versus patented products [26].
Generic drugs play an important role in the treatment of dis- eases by increasing the availability and affordability of modern drugs in the global healthcare system [33–35]. Reduced costs also reduce copayments when applicable. One benefit is en- hanced adherence, which is important in cardiovascular diseases [36–38]. High-income countries are struggling to fund new medicines [36,37]. The Millennium Development Goals and the
2015 Goals have been identified policy issues to control drug spending with an objective of providing access to essential drugs through the use of generic drugs [38]. The World Health Organiza- tion (WHO) recommends that countries develop generic drug poli- cies to provide high-quality and affordable drugs [39].
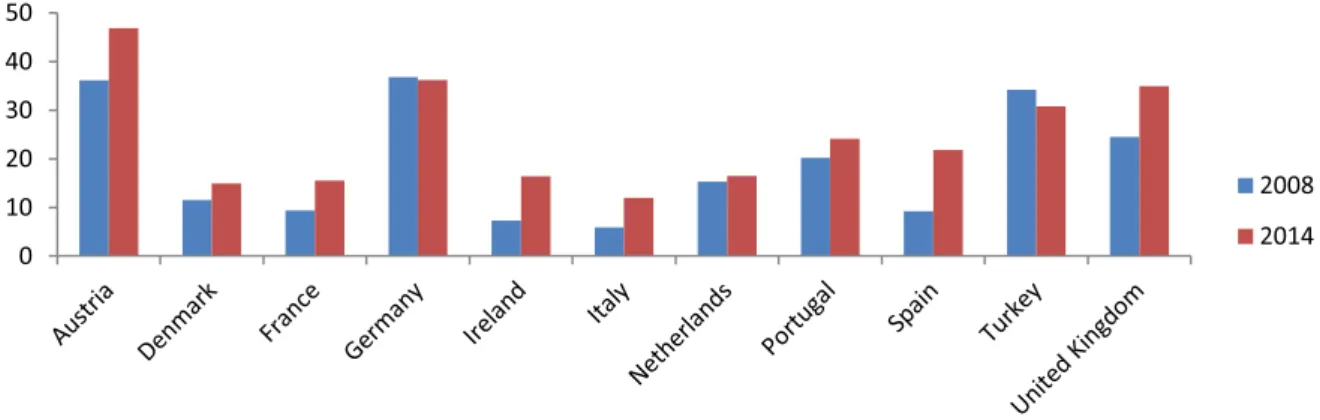
Health Statistics from the Organization for Economic Co- operation and Development show that the share of the generic market has increased more than twice in Ireland, Italy, Portu- gal, and Spain from 2008 to 2014. Germany, the Netherlands, and the United Kingdom in particular have relatively high market shares of generic drugs in terms of volume ( Fig.1). Notably, Ger- many’s value-based market share of generic drugs has fallen, while their volume-based market share has increased from 2008 to 2014 ( Figs. 1and 2) [40]. Generics with a higher market share in vol- ume correlate with lower prices [41,42].
Consequently, generic medicines allow for cheaper therapies with the same effectiveness by creating price-based competi- tion. Countries have different generic drug policies that focus on price competition, which allows for lower prices. Typically, generic prices in Europe can be aggregated into three policies: (a) ini- tially fixed discounts, such as in Austria (although there is com- petition after the third generic appears), France, and Norway; (b) free pricing, such as in the Netherlands, Sweden, and United King- dom but with mechanisms to obtain low prices; and (c) mixtures of these policies [43,44]. Like many countries, Turkey has vari- ous policies to benefit from the price advantage of generic drugs. However, as shown in Fig.2, the volume of the generic medicines market in Turkey is lower than countries like the Netherlands, Germany, and the United Kingdom. Furthermore, there has not been a significant increase in volume market share of generic drugs in a six-year period (roughly a 2% increase), and a de- crease of 3% occurred on a value basis ( Fig. 1 and 2). Thus, this study evaluates generic drug pricing and reimbursement policies
Fig. 2. Value based market share of generic drugs (%).
Source: OECD. Pharmaceutical Market [Internet]. 2017 [cited 2017 Sep 10]. Available from: http://stats.oecd.org/Index.aspx?DataSetCode=HEALTH _ PHMC ).
Table 2
Maximum retail price of pharmaceuticals.
All pharmaceuticals Original pharmaceuticals Generic pharmaceuticals Twenty year old pharmaceuticals Ex factory price < 3,63 TL; Ex factory
price < = Reference Price ∗100 Without generic Ex factory price = Reference Price Ex factory price > 6,93 TL; Ex factory price < = Reference Price ∗%80
TL: Turkish Liras With generic
Ex factory price < = Reference Price ∗%60 Ex factory price < = Reference Price ∗%60 Ex factory price < 6,93 TL; Ex factory price < = Reference Price ∗100.
Source: Turkish Ministry of Health. Be ¸s eri Tibbi Ürünlerin Fiyatlandirilmasi Hakkinda Tebli ˘g (Notification on the pricing of medicinal products for human use). 2015, Official Gazette, 11 December 2015; Issue 29559. Ankara, Turkey; 2015.
in Turkey and makes suggestions based on examples from other countries.
Genericpharmaceuticalpricingandreimbursementinturkey
The process of pharmaceutical pricing and reimbursement in Turkey is heavily regulated by ERP, mandatory public rebates, reg- ulated wholesale, pharmacy profit ratios, pharmacy discounts, pa- tient co-payments, and IRP The retail prices of pharmaceuticals are determined based on their prices in five reference countries (France, Greece, Italy, Portugal, and Spain). Mandatory discounts are determined according to the characteristics of pharmaceuticals (such as generic drugs or original drugs) by the Turkish Medicines and Medical Devices Agency ( Table2) [43–47].
Public financing is provided for pharmaceutics by the Social Security Institution (SSI) according to a positive drug list [45]. The SSI implements mandatory public rebates and internal refer- ence prices for drugs in an EDG [48]. The pharmaceutical com- pany may apply additional discounts in addition to mandatory public rebates. Mandatory public rebates for reimbursed medicines change according to the prices and characteristics of pharmaceu- ticals (generics, originals, twenty-year-old medicines 1). In Turkey, when a generic drug that is equivalent to an original drug enters the market and enters the positive drug list, the public price and reimbursed price of the original drugs are determined by various rules [24,49]( Table3).
The public price of a drug is calculated by subtracting the mandatory public rebates from the drug’s retail price. For a medicine in a drug cluster, the reimbursed price depends on the maximum reimbursed price for this group.IRP in Turkey is im- plemented for medicines with the same active substance in the EDGEDG (ATC 5), and the maximum reimbursed price for each group is 10% more than the cheapest unit price in the EDG. A drug that has the cheapest unit price must have 1% of the market share in volume for the equivalence group within the last five months. If a generic drug that is being considered for an EDG is 5% cheaper
1 Introduced to the world market for the first time before 1/8/1987.
than the cheapest drug in that group, it is added to the positive drug list within one week [50]. If a drug is more expensive than the maximum reimbursement price, patients pay for the price that exceeds the maximum reimbursement price. Finally, the pharma- cist discount and the patient copayment are deducted from the re- imbursement price of the drug, and the price to be paid by SSI is obtained.
Pharmacies are obligated to make a discount for drugs to be refunded from the SSI at rates determined according to the sales revenue of the previous year. Patient copayment rates for drugs are 20% for employees and their dependents (including their families) and 10% for retirees and their beneficiaries (including their fami- lies) [51]. Both the pharmacist discount and the patient copayment rates are not different for generic drugs and original drugs. More- over, the pharmacy service fee paid by the SSI is not different for the generic and the original drug. Table4summarizes the pricing and reimbursement policy components of generic drugs in Turkey. There is limited contemporary research on drug expenditures in Turkey using time series analysis. There is also limited research on generic and original hypertension drugs according to changes in reimbursement policies in Turkey. The purpose of this study is to evaluate the effects of changes in drug pricing and reimbursement policies on the use and expenditure of these drugs. The effects of IRPmethod on drug use were also evaluated. Because of the inte- grated and interactive nature of pharmaceutical pricing and reim- bursement process in Turkey, this study was designed to examine the effects of drug politics on drug spending in the period of 2007– 2013 with a focus on IRP.
Method
The data for this study covers the period of January 2007 to September 2013. The data is for five drug clusters that include original drugs and the first equivalent generic drugs in 2010 and 2011 that are used in hypertension therapy. According to the WHO, the drugs primarily used in the control of hypertension are diuretics, beta-blockers, calcium antagonists, angiotensin- converting-enzyme (ACE) inhibitors, angiotensin II antagonists, and alpha-adrenergic blockers [52]. Four of the groups in the study are
Table 3
Mandatory public rebates of pharmaceuticals.
All pharmaceuticals Original pharmaceuticals Generic pharmaceuticals Twenty year old pharmaceuticals
•Ex factory price ≤ 4.23TL; Discount Rate = %0 TL: Turkish Liras
Without generic
•4.24 TL ≤ Ex factory price ≤ 8.09 TL; Discount Rate = %10
•8.10 TL ≤ Ex factory price ≤ 12.19 TL; Discount Rate = %31
•12.20 TL ≥ Ex factory price; Discount Rate = %41 With generic
•4.24 TL ≤ Ex factory price ≤ 8.09 TL; Discount Rate = %10
•8.10 TL ≤ Ex factory price ≤ 12.19 TL; Discount Rate = %18
•12.20 TL ≥ Ex factory price; Discount Rate = %28
•3.84 TL ≤ Ex factory price ≤ 7.32 TL; Discount Rate = %10
•7.33 TL ≤ Ex factory price ≤ 11.02; Discount Rate = %18
•11.03 TL ≤ Ex factory price; Discount Rate = %28
•4.24 ≤ Ex factory price ≤ 8.09; Discount Rate = %0
•8.10 ≤ Ex factory price ≤ 12.19 TL; Discount Rate = %10
•12.20 TL ≤ Ex factory price; With Reference Discount Rate = %28 Without Reference
Discount Rate = %40
Source: Social Security Institution. Regulations on medical enforcement. 2017.
Table 4
Components of pricing and reimbursement policies of generic pharmaceuticals in Turkey.
Components of pricing policies
External reference pricing Wholesale profit rate Pharmacy profit rate Components of
reimbursement policies
Mandatory public rebates
Optional discounts made by the pharmaceutical company Internal reference pricing
Patient copayment Discount of pharmacy Pharmacy services fee
angiotensin II antagonists, and one is an ACE inhibitor. The ATC groups and numbers of drugs in the five EDGs were studied, and the first generic entry dates are summarized in Table5.
The study covers data on medicines used in outpatient treat- ment and reimbursed by the SSI. Pharmaceutical expenditure and consumption volume data were obtained from the SSI on a monthly basis, and drug retail prices were obtained from the le- gal website of the Turkish Pharmaceutical and Pharmacy Agency. The volume of antihypertensive drugs was measured as the total number of consumed drugs as tablets or capsules per month. Daily doses were not used since the price of pharmaceuticals is deter- mined by tablets and capsules in Turkey.
The effects of generic drugs on the market were analyzed by first investigating the effects of retail price reduction, compulsory public rebates, and changes in the reimbursed price of original pharmaceuticals. Secondly, the reimbursed prices of original drugs in every cluster were assigned a value of 100, and then the prices of original and generic pharmaceuticals were calculated after the first generic pharmaceutical entered the market. The effect of in- troducing the first generic drug on consumption of the original drug was analyzed by the time series analysis method [53,54]. In the absence of generic drugs entering the market, the origi- nal drug consumption was estimated and compared to the original drug consumption following the entry of the generic drug. Winters’
Additive method was selected as the most suitable method for the estimating the consumption of the original drugs in the five EDG.
The Root Mean Square Error (RMSE), Mean Absolute Error (MAE), and Mean Absolute Percentage Error (MAPE) were used as measures to forecast accuracy. RMSE, MAE, and MAPE are the most common measures of predictive accuracy. Smaller values of RMSE, MAPE, and MAE indicate better model performance [53,55,56]. Moreover, model adequacy was confirmed using the Ljung–Box test to check that the residuals from a time series model resemble white noise [54]. The loss of market share of the original drugs that occurred after generic drug entry was calculated. Calculations were done to determine how much generic drug consumption compensated for the decline in original drug consumption. The market share of original drugs and generic drugs after the first generic drug was included in the drug clusters was separately determined for one month, six months, and twelve months later. Lastly, various scenarios were developed, and the savings were calculated in cases where each generic medicine is offered at a lower price instead of using mandatory public rebates.
Results
Between 2007 and 2012, the consumption of prescribed hyper- tension drugs increased about 63%, whereas the hypertension drug expenditures of the SSI increased almost 82%. Between 2007 and 2012, there was an 83% increase in the consumption of drugs not included in the EDG (antihypertensive drugs with active ingredi- ents such as lacidipine, nifedipine, and combination antihyperten- sive drugs containing active ingredients such as trandolapril and verapamil, valsartan and amlodipine, and perindopril and diuret- ics). However, there was a 61% increase for drugs in the EDG. The SSI’s expenditures for hypertension drugs not included in the EDG increased by 22% from 2007 to 2012, but the expenditures for hy- pertension drug that are included in the EDG decreased by 23%.
The SSI’s hypertension drug expenditures included in the EDG grew 19% from 2007 to 2009, but it decreased by 35% from 2009 to 2012. The SSI’s expenditures for hypertension drugs that are not included in the EDG increased by 52% between 2007 and 2009,
Table 5
Descriptive information of five drug groups.
ATC group Numbers of drugs Date of inclusion in the drug
group of the first generic drug 1. Group C09CA08 8 drugs (3 original drugs and 5 generic drugs) June-2011
2. Group C09CA08 28 drugs (19 generic drugs and 9 original drugs)
June-2011 3. Group C09CA08 11 drugs (3 original drugs and 8 generic drugs) October-2011 4. Group C09DA04 21 drugs (5 original drugs and 16 generic
drugs)
December-2011 5. Group C09BA04 10 drugs (5 original drugs and 5 generic drugs) April-2012
Table 6
Retail price and public price changes, direct price controls and internal reference pricing effects in the decrease of the original pharmaceutical price after the first generic drug access to market (%).
Effect of retail price change in the decrease of the original pharmaceutical price (%) ∗
Effect of public price change in the decrease of the original pharmaceutical price (%) ∗∗
Effect of direct price control in the decrease of the original pharmaceutical price (%) ∗∗∗
Internal reference pricing effects in the decrease of the original pharmaceutical price (%) 1. Group 33.84 13.56 47.40 1.59 2. Group 33.94 13.54 47.49 1.60 3. Group 34.42 13.44 47.87 1.61 4. Group 40.12 12.27 52.40 10.88 5. Group 39.86 12.33 52.19 18.12
∗The highest price restrictions that drugs can receive in the external reference pricing system. ∗∗Mandatory public rebates.
∗∗∗Direct price controls include price restrictions that drugs can receive in the external reference pricing system and mandatory public rebates.
Fig. 3. Reimbursed prices of original and generic pharmaceuticals after the first generic pharmaceutical put on market.
but it only went up 22% from 2007 to 2012. Regarding treatment groups, the most preferred drug group in this period appears to be angiotensin II receptor antagonists, followed by beta blockers. The prescription rates in both groups increased steadily. The treatment share of angiotensin II receptor antagonists increased from 26% to about 33%, while the share of Beta-Blockers reached 26%. The share of ACE inhibitors declined, with the share of 28.03% in 2007 falling to 21% in 2012.
Calcium channel blockers have the fourth largest market share of 10%, followed by diuretics with a share of over 5%. Angiotensin II receptor antagonists, which have the highest share in volume, show an average of 50% for all medication payouts. ACE inhibitors had the second largest share of expenditure in 2012 but with a declining share of spending on an annual basis. The group with the third highest expenditures was beta blockers. The expenditure on hypertension drugs increased by 22.13% between 2007 and 20 09. After 20 09, there was a decrease of 32.75%. During the period of 2007–2012, there was an estimated decrease of 17.87%. In Turkey, the first generic drugs directly affect the price of the original pharmaceuticals. Table 6 shows that changes in retail
price and public price, direct price controls, and IRP decrease the original pharmaceutical price after of the first generic drug for the five drug clusters examined in this study.
After the first generic pharmaceuticals enter the market, changes in retail prices and public prices of the original drugs in the five clusters respectively result in average decreases of 36% and 13% in the original pharmaceutical price. Direct price controls were calculated to decrease the price of original drugs by an average of 49% in these clusters. IRP decreased original drug prices by an average of 2% in the first three groups, 11% in the fourth group, and 18% in the fifth group. Consequently, direct price control poli- cies considerably reduce the prices of original drugs compared to IRP.
Fig. 3 shows how the price reimbursed by the SSI for orig- inal drugs and generic drugs changes after an EDG is formed. The price reimbursed by the SSI for an original drug when there is no an equivalent generic drug is assigned a value of 100. Af- ter the generic drug enters the market, the reimbursed price for the original drug drops and approaches the price of the generic drug. Due to mandatory public rebates, reimbursed prices for
Table 7
Forecasting models statistics.
Model type Model fit statistics Ljung–Box Q(18)
RMSE MAPE MAE Statistics DF Sig.
1. GROUP Winters’ Additive 23586.335 6.207 18164.127 12.765 15 .620 2. GROUP Winters’ Additive 230234.818 6.395 175127.322 14.949 15 .455 3. GROUP Winters’ Additive 55355.261 5.599 41476.452 19.598 15 .188 4. GROUP Winters’ Additive 252795.777 6.198 182777.495 13.431 15 .569 5. GROUP Winters’ Additive 451138.633 5.649 342115.292 9.461 15 .852
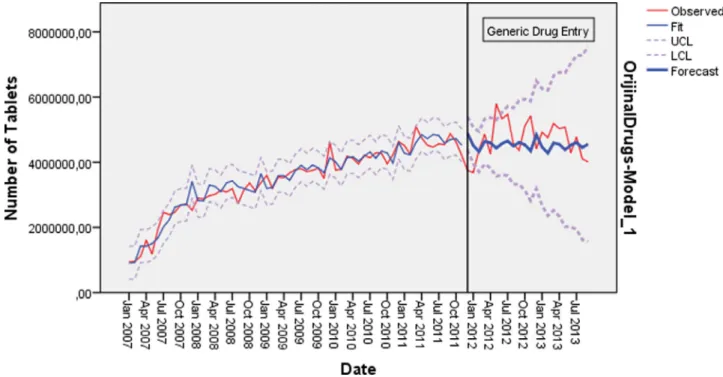
Fig. 4. Predicted and actual number of tablets in 1. Drug group: 2007 January–2013 September.
original pharmaceuticals sometimes fall below the reimbursed price of generic pharmaceuticals, or the original drugs have sim- ilar prices to generic drugs. Thus, patients mostly buy the original versions of drugs prescribed by doctors.
There are no favorable conditions for the realization of a larger market share with lower prices of generic drugs. Therefore, savings are not created by increasing the market share of generic drugs. Moreover, patients continue paying higher prices and copayments for original drugs if they are more expensive than the maximum reimbursement price. Table6shows that generic medicines lower the prices of original medicines. Moreover, it is expected that de- mand will shift towards generic drugs that offer lower prices after the appearance of generic drugs. In the absence of generic drugs entering the market, the original drug consumption was estimated and compared to the original drug consumption following the ap- pearances of generic drugs. The model statistics for each equivalent group are summarized in Table7. The table shows that the most suitable method for estimation in the five EDGs is the Winters’
Additive method. All the estimates made for the groups at the end of the Box–Jung test result in model residuals with a normal dis- tribution similar to white noise.
In the first EDG, the original drug consumption after the first generic drug entry on June 2011 was less than the predicted con- sumption. An average reduction of 27% was calculated for the orig- inal drug consumption expected after the first generic drug entry. In the period of June 2011–September 2013, the market share of generic drugs on a volume basis corresponds to an average de- cline of 15% in the market share of original drugs. As a result, the amount of original drug consumption in this EDG decreased after the first generic drug entry. Given that hypertension is a chronic disease that is treated with medication, it can be said that the consumption of this EDG has changed toward other hypertensive drugs. Fig.4shows that the predicted and actual number of tablets in first EDG according to time series analysis. Fig.4revealed that the estimated values were lower than observed values in the first EDG.
Fig. 5. Predicted and actual number of tablets in 2. Drug group: 2007 January–2013 September.
Fig. 6. Predicted and actual number of tablets in 3. Drug group: 2007 January–2013 September.
As in the first EDG, the original drug consumption after the first generic entry in June 2011 in the second equivalent group was less than the predicted consumption. There is an average reduction of 21% in the original drug consumption during the 15-month period from June 2011 to 2013. The market share of generic drugs on a volume basis shows an average decline of 47% in the market share of original drugs. There was a decrease in the amount of original drug consumption in this EDG after the first generic drug entry. As a result, the generic drug influ- enced the demand for the original drug in this EDG, and the con- sumption was directed toward the generic drug and away from
the original drug. Fig. 5 revealed that the estimated values were lower than observed values in the second EDG by time series analysis.
The original drug consumption in the third EDG after the first generic drug entered the market was above the estimated con- sumption. In this EDG, the first generic drug entry does not neg- atively affect the original drug consumption. From October 2011 to September 2013, the consumption of the original drug was 10% higher on average than the expected consumption. Fig.6revealed that the estimated values were lower than observed values in the third EDG by time series analysis.
Fig. 7. Predicted and actual number of tablets in 4. Drug group: 2007 January–2013 September.
Fig. 8. Predicted and actual number of tablets in 5. Drug group: 2007 January–2013 September.
As in the third EDG, the original drug consumption in the fourth EDG was above the expected drug consumption after December 2011. From September 2012 to September 2013, the amount of original drug consumption was 4% higher on aver- age than the expected amount of consumption. In this equivalent group, the generic drug entry did not negatively affect the original drug consumption. Fig.7revealed that the estimated values were lower than observed values in the fourth EDG by time series anal- ysis.
In the fifth EDG, the consumption of the original drug was less than the expected consumption amount. A market loss of
approximately 9% was calculated for the original drug after the first generic drug entered the market. From April 2012 to Septem- ber 2013, the generic drug consumption was 1.5 times higher on average than the estimated loss of market share for the original drug. Fig. 8revealed that the estimated values were higher than observed values in the fifth EDG by time series analysis.
Table8shows the market shares of the original drugs and the generic drugs in every cluster after the first generic pharmaceutical entered the market. The supply of generic drugs had no remarkable effect of reducing the market share of the original drugs. According to the data from 6 months after the supply of generic drugs, most
Table 8
Market share of original drugs and generic drugs after the first generic pharmaceutical access to market.
One month later (%) Six month later (%) Twelve month later (%)
1. Group Original 99 97 94 Generic 1 3 6 2. Group Original 99 96 88 Generic 1 4 12 3. Group Original 100 99 98 Generic 0 1 2 4. Group Original 75 73 71 Generic 25 27 29 5. Group Original 88 87 – Generic 12 13 –
Note: Generic drug included in fourth drug group and fifth drug group has been reimbursed already before the equiv- alent group is defined and so it has a higher market share.
Table 9
The savings provided by the every new generic drug entry into equivalent group (%).
1. Group 2. Group 3. Group 4. Group 5. Group
1. Scenario 2. Scenario 1. Scenario 2. Scenario 1. Scenario 2. Scenario 1. Scenario 2. Scenario 1. Scenario 2. Scenario
1. Generic drug −28,60 −15,47 −26,74 −15,12 −27,82 −15,11 −17,46 −10,93 −20,61 −13,93
2. Generic drug −15,74 −5,40 −14,07 −3,61 −15,03 −3,59 −5,71 0,16 −8,55 −2,54
3. Generic drug −4,17 4,93 −2,66 −4,45 −3,53 7,35 4,86 10,14 2,31 7,72
4. Generic drug 6,25 7,94 7,61 9,03 6,82 7,45 14,37 19,13 12,07 16,95
5. Generic drug 15,62 23,16 16,85 24,47 16,14 24,48 22,94 27,22 20,87 25,25
of the market still belonged to the original drugs. The data for 12 months later also supports these results ( Table8). Therefore, it was determined that the generic drug entry influences the original drug consumption in the first, second, and fifth EDGs. The loss in the original drug’s market share in the first equivalent group did not lead to greater use of generic drugs. The reduced consumption of original drugs is thought to correspond to a shift towards other hypertension medications.
In the second group, nearly 50% of the loss of the original drug market share was covered by generic drugs, while the other 50% was replaced by other hypertension drugs. The original drug con- sumption in the fifth EDG is less than the estimated consumption, and the consumption of generic medicines is greater than the loss of market share in the original medicine consumption. In this EDG, the generic drug has created a market for itself. In the third and fourth EDGs, the original drug consumption was not negatively af- fected by the generic drug consumption, and the amount of con- sumption of the original drugs was above the predicted amount. However, there is still a shift in demand towards other hyperten- sion drugs.
The results show that original drugs are still dominant in the market after the entry of generic drugs. Although generic medicines influence the original drug consumption, the domi- nance of the original medicines persists. Market losses for the original medicines are likely to lead to other hypertension med- ications, particularly original hypertension medications that are not available in EDGs. In Turkey, direct price controls involving pharmaceutical prices limitations and mandatory public rebates have reduced the price of pharmaceuticals. Thus, pharmaceutical expenditures have been under control. The price limitations and rebates have substantially and rapidly decreased the pharmaceu- tical price, but the price drop does not continue with the same effectiveness. The mandatory rebate policies result in high savings, but there is no price competition in later periods.
Consequently, Turkey cannot maximize its full potential with respect to generic medicines, and new pricing and reimbursement policies are needed for generic pharmaceuticals. Generic drug poli- cies are aimed at creating price competitiveness with generic drugs that have lower prices and ensuring that the savings continue to increase. In this study, various scenarios were developed, and the
savings in cases where generic medicines offer a lower price in- stead of mandatory public rebates have been evaluated. In the first scenario, each new generic drug included in the equivalent drug groups offers a 10% lower public price than the cheapest drug available in the EDG. In the second scenario, the first generic drug offers a 15% lower public price, and also each subsequent generic drug should have a 10% cheaper public price.
Table 9 shows that the savings provided by the every new generic drug entry into five equi valent groups in detail. According to the first scenario, the savings provided by the fourth generic drug in the first three EDGs are higher than the savings pro- vided by mandatory public rebates and the existing IRP system. In the third and fourth EDGs, the highest level of savings provided through mandatory public rebates and the IRP system was reached with the third generic drug. In the second scenario, the highest saving rate provided by the rebates and pricing system was ob- tained by the second generic drug in the fourth EDG and by the third generic drug in the first, third, and fifth EDGs. The savings achieved with new generic medicines in both scenarios continue to increase.
Discussion
There was a continuous increase in the consumption of hy- pertension drugs included in the EDGs between 2007 and 2012 (61%). Furthermore, the hypertension drug expenditures of the SSI decreased after 2009 (35%). The results the direct price control policies significantly reduced the reimbursed prices of the hyper- tension drugs. The price of original drugs is recalculated when a generic drug that is equivalent to an original drug put on the mar- ket. The maximum price that is determined for the original drug is reduced, and obligatory public rebates are increased. In other words, the original drug prices are required to decrease when an equivalent generic drug is put on the market in Turkey.
The prices of original drugs decreased between 17% and 38% at 12 months after the appearance of generic drugs. Kanavos cal- culated that the prices of original drugs after the appearance of generics and the ends of patents decrease by 16–59% after 12 months [57]. Woerkom et al. emphasized that there are much greater reductions in prices for certain generics compared to orig-
inal drugs in the Netherlands, Sweden, and the United Kingdom [28]. The rate of decline in prices of original drugs with the appear- ance of generics in Turkey is lower, and the decline in prices is not a result of price competition but a result of direct price controls.
The study results show that the IRP system in Turkey does not encourage price competition. Mandatory public rebates induce close price levels for generic and original drugs. Every new generic drug does not have a competitive price for existing drugs in EDGs. Consequently, there are many generic and original drugs that have similar prices. However, the price of the generic drug should be lower than the price of the original product so that increasing the volume-based market share of generic drugs will lead to a decrease in drug expenditures.
In Slovenia, the volume-based market share of original drugs declined after implementing reference pricing, and the market share of generics increased. Therefore, it was found that refer- ence pricing seems to be an important determinant of the original drugs’ market share when the original drug price is above the ref- erence price [58]. Our analysis indicated that even if the original drugs have generic equivalents, they still have the highest volume- based market share because there is no intensive preference for generic drugs [57]. Consequently, price competition does not oc- cur, and the market share of generic drugs does not increase. In this study, the scenarios show that every new generic drug with a lower price than existing drugs provides higher savings, which continues increasing. Dylst et al. argued that reference pricing can provide short-term cost savings. However, in the long term, the cost savings of reference pricing may show a declining trend as drug prices continue to rise. They concluded that health outcomes, health status, and the medical outcomes of patients were not neg- atively affected by reference pricing [4].
The time series analysis results of these EDGs show that al- though generic medicines influence the original drug consumption, the dominance of the original medicines still continues. Market losses for original medicines are likely to lead to other hyperten- sion medications, especially original hypertension medications that are not available in EDGs. Based on the research results, the prices of drugs other than the reference price are increased, and the con- sumption amounts of these drugs are increased between the re- sults of the promoted IRP [2]. We also found that between 2007 and 2012, the increase in the consumption of original drugs that were not included in the EDG and are usually are more expensive than drugs in the EDG was higher than the increase in the EDG (81% for original drugs not included in the EDG and 57% overall for the equivalent group of drugs). Welfare losses result from IRP applied in Turkey. The SSI pays 10% more than the cheapest unit price in an equivalent drug cluster of the IRP system. Therefore, 10% range in refunded price has resulted in high pharmaceutical expenditure by the SSI and high patient copayments.
Conclusions
The results of this study could provide important benefits for drug economy studies in Turkey. The pharmaceutical economy in Turkey is still developing. This study investigated hypertension drugs using time series analysis according to drug expenditures and usage. Our study is one of the first of its kind in Turkey. The results show that Turkey is not maximizing its full potential with respect to generic medicines, and therefore, new pricing and reimbursement policies are needed for generic pharmaceuticals. Generic drug policies implemented in Turkey focus on the price of pharmaceuticals. Generic drugs do not have competitive prices compared to existing drugs in an EDG, and the prices of original drugs in these groups are required to decrease mandatorily accord- ing to the drug pricing and reimbursement rules. For this reason, original drugs have similar prices to generic drugs, and patients
mostly buy the original versions of drugs prescribed by doctors. The original pharmaceuticals still dominate most of the market.
IRP system in Turkey does not encourage competitive price, and the reductions in price are mostly a result of price limitations and mandatory public rebates. This result shows that pricing and reim- bursement policies for generic drugs need to change, and the IRP system should be redesigned. A pricing policy may be proposed in which the price of each generic drug is more competitive. Further- more, pricing policies are not enough to control drug spending by increasing generic drug use, and there is a need for doctors, phar- macists, and patients to be included in the process, to be informed about generic drugs, and to develop various incentive policies. Pre- scription targets, financial incentives, patient copayment differen- tials, compulsory INN prescriptions, and prescription restrictions could help to increase the use of generic drugs.
Limitations
This study only covers drugs used in the treatment of hyper- tension. Therefore, it is not possible to generalize the study re- sults to the whole country’s drug expenditure and consumption. It was decided that a group of diseases should be selected because it was not possible to include drugs in the entire reimbursement system due to resource constraints in the study and the accessi- bility of the data. The main selection criterion is that hypertension is a chronic disease, a common disease, and a drug-treated dis- ease. There may have been some situations such as the withdrawal of some medicines over time, the inclusion of certain medicines in the scope of reimbursement, the inclusion of certain medicines in an EDG over time, the emergence of an EDG, the merging of EDGs, or the identification of new EDGs between 2013 and 2017. The pricing and reimbursement of drugs in the system applied in Turkey cannot be determined by separating the main cause of changes in drug expenditures from other factors, which affect each other. For this reason, the study is designed to cover the pricing of medicines and policy changes in this process.
Directionsforfutureresearch
Future studies could conduct a detailed analysis of the expendi- ture and the amount of use of EDGs for many diseases or disease groups, including hypertension. The changes in drug reimburse- ment policies should also be considered, particularly the reference price. It is important to continue conducting similar research to control drug expenditures, as well as to evaluate the effects of the policies on pricing and reimbursement of drugs on the other par- ties, such as physicians, pharmacists, and the pharmaceutical sec- tor. Future studies could also evaluate the financial burden of poli- cies aimed at controlling public drug expenditure, especially for patients, and their impact on access to healthcare. These policies are also important considerations for physicians’ prescription be- haviors and their effects on services offered by pharmacists.
Acknowledgments
The data used in this study was obtained from the doctorate thesis study entitled “Effects of Reimbursement Reference Pric- ing in Hypertension Pharmaceutical Expenditure: 2007–2012 Pe- riod Evaluation”. This thesis was supported by The Scientific and Technological Research Council of Turkey Direct Institute Doctor- ate Scholarship Program (Grant no. 1649B031000021) (TÜB ˙ITAK Do ˘grudan Yurt ˙Içi Doktora Burs Programı). Thesis detail: “Effects of Reimbursement Reference Pricing in Hypertension Pharmaceu- tical Expenditure: 2007–2012 Period Evaluation”. Doctoral The- sis, Hacettepe University, Social Sciences Institute, Ankara, Turkey, 2015.
AuthorStatements Funding None Competinginterests None declared Ethicalapproval
Legal approval was obtained from Social Security Institution (Sosyal Güvenlik Kurumu) in Turkey.
References
[1] OECD. Pharmaceutical spending trends and future challenges. Health at a gGlance 2015. 2015;29.
[2] Mossialos E, Mrazek M, Walley T. Regulating pharmaceuticals in Europe: striv- ing for efficiency, equity and quality. In: Regulating pharmaceuticals in Europe: striving for efficiency, equity and quality [Internet]; 2005. p. 227–8. Available from: http://qualitysafety.bmj.com/lookup/doi/10.1136/qshc.2004.012070 . [3] Puig-Junoy J . Impact of European pharmaceutical price regulation on generic
price competition a review. Pharmacoeconomics 2010;28(8):649–63 . [4] Dylst P , Vulto A , Simoens S . The impact of reference-pricing systems in Europe:
a literature review and case studies. Expert Rev Pharmacoecon Outcomes Res 2011;11(6):729–37 .
[5] Danzon PM , Ketcham JD . Reference pricing of pharmaceuticals for medicare: evidence from Germany, The Netherlands and New Zealand, 7. MIT Press; 2003 .
[6] Urbinati D , Mzoughi O , Hammi E El , Belgaied W , Toumi M . Overview of exter- nal reference pricing systems in Europe ´. J Mark Access Health Policy 2015;3 . [7] External Reference Pricing [Internet] Available from: http://www.
europe-economics.com/publications/external _ reference _ pricing _ - _ final _ report. pdf .
[8] Leopold C, Vogler S, Mantel-Teeuwisse AK, de Joncheere K, Leufkens HGM, Laing R. Differences in external price referencing in Europe—a descriptive overview. Health Policy (New York) [Internet] 2012;104(1):50–60. Available from: http://dx.doi.org/10.1016/j.healthpol.2011.09.008 .
[9] Godman B , Schwabe U , Selke G , Wettermark B . Update of recent reforms in germany to enhance the quality and efficiency of prescribing of proton pump inhibitors and lipid-lowering drugs. Pharmacoeconomics 2009;27(5):435–8 . [10] Wladysiuk M , Araszkiewicz A , Godman B , Szabert K , Barbui C , Haycox A . In-
fluence of patient co-payments on atypical antipsychotic choice in Poland: im- plications once generic atypicals are available. Appl Health Econ Health Policy 2011;9(2):101–10 .
[11] Van der Merwe Smit E, Bredenkamp J. Originator and generic medicine: pric- ing and market share. Int J Pharm Healthc Mark [Internet] 2013;7(2):104–19. Available from: http://www.emeraldinsight.com/doi/10.1108/IJPHM- 04- 2013- 0010 .
[12] Dunne S , Shannon B , Dunne C , Cullen W . A review of the differences and simi- larities between generic drugs and their originator counterparts, including eco- nomic benefits associated with usage of generic medicines, using Ireland as a case study. BMC Pharmacol Toxicol 2013;14:1–19 .
[13] Misono AS, Lee JL, Stedman MR, Brookhart MA. Clinical equivalence of generic and brand-name drugs used. 2012; 300(21): 2514–2526.
[14] Gagne JJ, Kesselheim AS, Choudhry NK, Polinski JM, Hutchins D, Matlin OS, et al. Comparative effectiveness of generic versus brand-name antiepileptic medications. Epilepsy Behav [Internet] 2015;52:14–18. Available from: http: //dx.doi.org/10.1016/j.yebeh.2015.08.014 .
[15] Gagne JJ, Choudhry NK, Kesselheim AS, Polinski JM, Hutchins D, Matlin OS, et al. Comparative effectiveness of generic and brand-name statins. What is the problem and what is known about it so far? 2014;2016.
[16] Corrao G, Soranna D, Arfè A, Casula M, Tragni E, Merlino L, et al. Are generic and brand-name statins clinically equivalent? Evidence from a real data-base. Eur J Intern Med [Internet] 2014;25(8):745–50. Available from: http://dx.doi. org/10.1016/j.ejim.2014.08.002 .
[17] Corrao G , Soranna D , La Vecchia C , Catapano A , Agabiti-Rosei E , Gensini G , et al. Medication persistence and the use of generic and brand-name blood pressure-lowering agents. J Hypertens 2014;32(5):1146–53 .
[18] Corrao G , Soranna D , Merlino L , Mancia G . Similarity between generic and brand-name antihypertensive drugs for primary prevention of cardiovascu- lar disease: evidence from a large population-based study. Eur J Clin Invest 2014;44(10):933–9 .
[19] Lessing C , Ashton T , Davis P . The impact on health outcomes and healthcare utilisation of switching to generic medicines consequent to reference pric- ing: the case of lamotrigine in New Zealand. Appl Health Econ Health Policy 2014;12(5):537–46 .
[20] Paton C . Generic clozapine: outcomes after switching formulations. Br J Psy- chiatry 2006;189(AUG.):184–5 .
[21] Cameron A, Ewen M, Ross-Degnan D, Ball D, Laing R. Medicine prices, avail- ability, and affordability in 36 developing and middle-income countries: a secondary analysis. Lancet [Internet] 2009;373(9659):240–9. Available from: http://dx.doi.org/10.1016/S0140- 6736(08)61762- 6 .
[22] Zeng W . A price and use comparison of generic versus originator cardiovas- cular medicines: a hospital study in Chongqing, China. BMC Health Serv Res [Internet] 2013;13(1):1 Available from: BMC Health Services Research . [23] West RLGeneric drugs. [Internet] Available from: https://www.fda.gov/
downloads/AboutFDA/Transparency/Basics/UCM226568.pdf .
[24] Carone G , Schwierz C , Xavier A . Cost-containment policies in public pharma- ceutical spending in the EU. Econ Financ Aff 2012 345 p .
[25] Generic Drugs Continue to Deliver Billions in Saving to the U.S. Health- care System, New Rep Finds [Internet]. [cited 2016 Sep 10]. Available from: https://www.gphaonline.org/gpha-media/press/generic-drugs-continue-to- deliver- billions- in- savings- to- the- u- s- healthcare- system- new- report- finds/# [26] Godman B , Shrank W , Andersen M , Berg C , Bishop I , Burkhardt T , et al. Com-
paring policies to enhance prescribing efficiency in Europe through increasing generic utilization: changes seen and global implications. Expert Rev Pharma- coecon Outcomes Res 2010;10(6):707–22 .
[27] Godman B , Bishop I , Finlayson AE , Campbell S , Kwon H-Y , Bennie M . Reforms and initiatives in Scotland in recent years to encourage the prescribing of generic drugs, their influence and implications for other countries. Expert Rev Pharmacoecon Outcomes Res 2014;13(4):469–82 .
[28] Menno van Woerkom , Hans Piepenbrink , Brian Godman , Joost de Metz , Stephen Campbell , Marion Bennie ME LLG. Ongoing measures to enhance the efficiency of prescribing of proton pump inhibitors and statins in The Nether- lands: influence and future implications. J Comp Eff Res 2012;1(6) .
[29] Godman B , Wettermark B , Hoffmann M , Andersson K , Gustafsson LL . Mul- tifaceted national and regional drug reforms and initiatives in ambulatory care in Sweden: global relevance. Expert Rev Pharmacoecon Outcomes Res 2014;9(1):65–83 .
[30] Godman B , Abuelkhair M , Vitry A , Abdu S , Bennie M , Bishop I , et al. Payers endorse generics to enhance prescribing efficiency: impact and future implica- tions, a case history approach. Generics Biosimilars Initiat J 2012;1(2):69–83 . [31] Godman B , Wettermark B , van Woerkom M , Fraeyman J , Alvarez-Madrazo S ,
Berg C , et al. Multiple policies to enhance prescribing efficiency for established medicines in Europe with a particular focus on demand-side measures: find- ings and future implications. Front Pharmacol 2014;5:1–9 (June) .
[32] Dylst P , Simoens S . Does the market share of generic medicines influence the price level?: a European analysis. Pharmacoeconomics 2011;29(10):875–82 . [33] Simoens S. Sustainable provision of generic medicines in Europe. [Internet]
Available from: http://www.quotidianosanita.it/allegati/allegato3090824.pdf . [34] Cameron A, Laing R. Cost savings of switching private sector consumption from
originator brand medicines to generic equivalents [Internet] Available from:. 2010 http://apps.who.int/medicinedocs/documents/s22118en/s22118en.pdf . [35] Sheppard A. Generic medicines: essential contributors to the long
term health of society. IMS Health [Internet] 2010;16. Available from: http://www.imshealth.com/imshealth/Global/Content/IMSInstitute/Documents/ Generics _ Medicines.pdf .
[36] Hassali MA, Alrasheedy AA, McLachlan A, Nguyen TA, AL-Tamimi SK, Ibrahim MIM, et al. The experiences of implementing generic medicine policy in eight countries: a review and recommendations for a successful promotion of generic medicine use. Saudi Pharm J [Internet] 2014;22(6):491–503. Avail- able from: http://dx.doi.org/10.1016/j.jsps.2013.12.017 .
[37] Malmström RE , Godman BB , Diogene E , Baumgärte C , Bennie M , Bishop I , et al. Dabigatran—a case history demonstrating the need for comprehensive approaches to optimize the use of new drugs. Front Pharmacol 2013;4:1–31 . [38] United Nations Millennium Development Goal 8: elivering on the global
partnership for achieving the millennium development goals. MDG Gap Task Force Rep 2008. [Internet]2008 [cited 2017 September 10] Available from: http://www.un.org/millenniumgoals/pdf/MDG%20Gap%20Task%20Force% 20Report%2020 08.pdf 20 08 .
[39] WHO. Advancing the right to health: the vital role of law. World Health Orga- nization; 2017. p. 1–308.
[40] OECD. Pharmaceutical Market [Internet] Available from: http://stats.oecd.org/ Index.aspx?DataSetCode=HEALTH _ PHMC .
[41] Dylst P, Vulto A, Simoens S. Reference pricing systems in Europe: characteristics and consequences. Generics Biosimilars Initiat J [Inter- net] 2012;1(3–4):127–31. Available from: http://gabi-journal.net/wp-content/ uploads/GaBIJ- 2012- 3- 4- p127- 31- ReviewArticle- Dylst.pdf .
[42] Godman B, Shrank W, Wettermark B, Andersen M, Bishop I, Burkhardt T, et al. Use of generics—a critical cost containment measure for all healthcare profes- sionals in Europe? Pharmaceuticals. 2010; 3(8): 2470–2494.
[43] Turkish Medicines and Medical Devices Agency. Analysis of the effects of pub- lic interventions on the first 100 drugs in 2008–2013 value basis. 2014. [44] Turkish Ministry of Health Be ¸s eri Tibbi Ürünlerin Fiyatlandirilmasi Hakkinda
Tebli ˘g (Notification on the pricing of medicinal products for human use). Offi- cal Newsp Turkish Repub 2015;29559 .
[45] Deger C , Ozdemir AZ , Sumer F , Parali E , Yilmaz ZS , Tunalioglu A , et al. Exter- nal reference pricing (Erp) in Turkey and its effects on countries that refer to Turkey. Value Health. 2014;17AD(3) .
[46] Toumi M , Rémuzat C , Vataire A-L , Urbinati D . External reference pricing of medicinal products: simulation-based considerations for cross-country coordi- nation. Final report. Eur Com 2014:113 .
[47] Turkish Ministry of Health Be ¸s eri Tibbi Ürünlerin Fiyatlandirilmasi Hakkinda Tebli ˘g (Notification on the pricing of medicinal products for human use). Offi- cial Gazette 2015(29559) 11 December 20152015 .
[48] Gürsoy K . An analysis of public pharmaceutical policy, pricing and spending in Turkey. J Soc Sec 2016;6(1):225–43 .
[49] Social Security Institution. Regulations on medical enforcement. 2017. Ankara, Turkey.
[50] Social Security Institution. Regulation on the payment commission operational procedures. 2015. Ankara, Turkey.
[51] Social Security Institution Health implementation practice regulation. Offical Newsp Turkish Repub 2013;28597 .
[52] Chalmers J . World Health Organization—international society of hypertension guidelines for the management of hypertension. In: WHO-ISH hypertension guidelines committee; 1999. p. 151–85 .
[53] Saigal S , Mehrotra S . Performance comparıson of time series data using pre- dictive mining techniques. Adv Inf Min 2012;4(1):57–66 .
[54] Hejase HAN, Assi AH. Time-series regression model for prediction of mean daily global solar radiation in Al-Ain, UAE. ISRN Renew Energy [Inter- net] 2012;2012:1–11. Available from: http://www.hindawi.com/journals/isrn. renewable.energy/2012/412471/ .
[55] Woschnagg E, Cipan J Evaluating Forecast Accuracy. UK Ökonometrische Prog- nose SS 2004 University of Vienna Department of Economics, Elisabeth 9501689 Jana http://homepage.univie.ac.at/robert.kunst/procip.pdf .
[56] Chai T , Draxler RR . Root mean square error (RMSE) or mean absolute error (MAE)?—arguments against avoiding RMSE in the literature. Geosci Model Dev 2014;7(3):1247–50 .
[57] Kanavos P . Measuring performance in off-patent drug markets: a methodolog- ical framework and empirical evidence from twelve EU Member States. Health Policy 2014;118(2):229–41 .
[58] Aronsson T , Bergman MA , Rudholm N . The impact of generic drug competi- tion on brand name market shares—evidence from micro data. Rev Ind Organ 2001;19(4):423–33 .