The Effect of IFRS Adoption on Financial Disclosure: Does Culture Still Play A
Role?
Nazlı Hosal Akman, PhD
Faculty of Business Administration
Bilkent University Bilkent, 06800, Ankara, Turkey
E mail: [email protected]
Phone: +90 312 290 2022
Abstract
This study investigates whether the differences in financial disclosure due to culture have diminished after the use of IFRS. Using 498 firm-year observations for the period of 2004 to 2006 from six countries, the results indicate that the effect of culture still prevail on the amount of disclosure even after the use of IFRS. However, it is also noted that, the level of financial disclosure increases in all countries examined following the adoption of IFRS. Nevertheless, findings of the study show that the use of single set of accounting standards does not completely eliminate the impact of culture on financial disclosure.
Keywords:
International Financial Reporting, Culture, Disclosure, IFRS, Convergence1. Introduction
Accounting scholars, practitioners and regulators have been carrying debates over measurement and disclosure issues in order to achieve internationally comparable and high quality financial statements. Considerable amount of progress has been achieved in terms of harmonization and convergence of accounting standards although there are still differences among the national reporting practices. 1 January 2005 marks the day for the start of global accounting convergence. Effective from this date on, European Union (EU) required the companies whose shares are traded in the EU Stock Exchanges to prepare their consolidated financial statements in accordance with the International Financial Reporting Standards (IFRS) as adopted by the EU. Some other countries also either required the use of IFRS as is or adopted the standards by building into their national accounting standards around the same date. For example, Australia revised national accounting standards and required Australian companies to use Australian IFRS starting at 1 January 2005. It is known that information disclosed in the financial statements of a company is a function of its environment, where culture is an important factor. Earlier studies demonstrate that cultural dimensions developed by Hofstede (1984) influence the level of financial disclosure of firms in different countries (Zarzeski, 1996; Jaggi and Low, 2000; Hope, 2003; Archambault and Archambault, 2003). However, the effect of cultural dimensions on financial disclosure has not been studied after the widespread use of IFRS. The objective of this study is to investigate whether the use of IFRS eliminates the impact of cultural dimensions on the financial disclosure because the countries share the same set of standards. The study uses a sample of 498 firm-year observations from six countries for the period between 2004 and 2006. The results of the study suggest that culture still plays a role in the financial disclosure levels of companies even after the adoption of IFRS, although the level of disclosure increases in all countries examined following the adoption of IFRS. The results display that the use of the same accounting standards does not completely eliminate the differences in disclosure and companies continue to disclose information in accordance with their cultural background. The next section provides a brief review of relevant literature and it is followed by the methodology employed and the results, respectively. Conclusion and recommendation for future research are provided in the final section.
2. Literature Review
It is widely accepted that accounting is the language of business that enables communication among financial information users and providers. Just as each nation has its own language, not surprisingly, different countries have different accounting standards. Gray (1988) and Lainez and Gasca (2006) among others, argue that social, political, economic and cultural environment of each country influence national accounting systems. The success of convergence of accounting standards depends to large extent on the sufficient understanding of the underlying reasons of national accounting differences. Previous research on classification of countries according to accounting rules and practices shows that there are certain clusters that differ in terms of measurement and disclosure practices (Nair and Frank, 1980; Nobes 1983; Doupnik and Salter, 1993). Nobes (1983)‟s and Doupnik and Salter (1993)‟s classification studies report two general clusters: Micro level countries under the influence of Anglo-American practices and macro level countries under the influence of Continental Europe practices.
Furthermore, Doupnik and Salter (1993) report more variety in accounting practices among macro level countries which in turn may impede the achievement of convergence in these countries. Increase in cross country capital transfers and foreign direct investments evolved the necessity of eliminating or minimizing the differences in accounting standards to enhance comparable financial information globally. Within this framework, convergence of financial reporting standards globally becomes one of the major tasks of accounting standard setters. Financial statements that are prepared in accordance with similar accounting standards are expected to improve comparability, and thus investors would be able to decrease investment risks by global diversification (Doupnik and Perera, 2007). Although both preparers and users agree upon the benefits of similar accounting standards, some still argue that because of the environmental differences among the companies, convergence is hard to achieve.
International Accounting Standards Board (IASB) leads the global convergence movement. IASB has no enforcement power on the use of IFRS, but the International Organization of Securities Commission‟s (IOSCO) endorsement of IASB standards has assisted in the implementation of those standards in different countries. Furthermore, EU required the companies that are traded in the stock exchanges to apply IFRS in preparation of consolidated financial statements effective from 1 January 2005. Along with the EU many other countries such as Australia, New Zealand, South Africa, and Turkey have taken steps to use IFRS as their national accounting standards or revised their national standards to adapt IFRS. Convergence of IFRS and United States generally accepted accounting standards (US GAAP) is also an ongoing project which is expected to be completed by mid-2011 (Financial Accounting Standards Board, 2010).
Choi et. al. (1999) study accounting within three functions: measurement, disclosure and auditing. Among these, this study focuses on financial disclosure which helps to achieve the goal of communicating financial information to decision makers. Previous studies investigate the underlying reasons for different disclosure levels among companies and find that different environmental factors including cultural dimensions affect disclosure levels (Zarzeski, 1996; Jaggi and Low, 2000; Hope, 2003; Archambault and Archambault, 2003). Hofstede (1984) defines culture as the collective programming of the mind that differentiates one member of a group or society from the others. He groups cultural values in four dimensions as:
1. Individualism versus collectivism: In individualistic societies the dependence of individuals among each other is low; individuals are independent and self-sufficient. At the other extreme, in the collectivist societies that score low in individualism scale, collaboration among members of society is higher and there are strong cohesive in-groups (Hofstede, 1991).
2. High Power Distance versus Low Power Distance: Power distance demonstrates the acceptance of equality and describes how inequality is perceived in a society. In high power distance societies, people accept hierarchy without questioning. However, in low power distance societies unequal power thus hierarchy is not accepted as it is (Hofstede, 1991).
3. High Uncertainty Avoidance versus Low Uncertainty Avoidance: It is a measure of peoples discomfort arising from uncertainties. Societies with high uncertainty avoidance scores prefer to have rules and try to avoid foggy environment in which they feel threatened. (Hofstede, 1991).
4. Masculinity versus femininity: Masculine cultures are more assertive and gender differences are more emphasized. Consequently, individuals are more success oriented and material in masculine societies. On the other hand, social welfare and care for others are more important in feminine societies. (Hofstede, 1991).
In a later study Hofstede identifies a fifth value dimension as Long-term Orientation versus Short-term Orientation which he defined as „the extent to which people favor a pragmatic future oriented perspective- fostering virtues like perseverance and thrift-over short-term thinking‟ (as cited in Ding et al., 2005, p. 332). This cultural dimension has not found as acceptance as the others, especially in accounting, and thus is not included in this study.
Gray (1988) formulates an “accounting value model” based on Hofstede‟s cultural dimensions and proposes four „accounting values‟: Professionalism versus Statutory Control; Uniformity versus Flexibility; Conservatism versus Optimism; Secrecy versus Transparency. Salter and Niswander (1995) test the theory developed by Gray (1988) by linking the accounting values and the Hofstede‟s cultural dimensions. Among the accounting values, Secrecy versus Transparency is related with financial disclosure, thus the following paragraphs summarize the expected relations among cultural dimensions and Secrecy versus Transparency as developed by Gray (1988) and the findings of studies that investigate the relation between cultural dimensions and financial disclosure.
i. There is less secrecy and more competition in individualistic societies. Individualistic societies demand accountability and require extensive disclosure relative to collectivist societies. Accordingly a negative relation is proposed between secrecy and individualism. In other words, a positive correlation with individualism scores and financial disclosure is expected. Salter and Niswander (1995) report a significant negative relation between secrecy and individualism. Zarzeski (1996) investigates the effect of culture and financial disclosure in French, German, Hong-Kong, Japanese, Norwegian, British and US companies. Her findings show that there is a positive relation between individualism and financial disclosure. Companies that are members of individualistic countries disclose more information. Jaggi and Low (2000), Hope (2003), and Archambault and Archambault (2003) use Center for International Financial Analysis and Research (CIFAR)‟s evaluations of corporate disclosure levels from more than 40 countries in the first half of the 1990‟s and their findings support the positive relation as well.
ii. There is a negative correlation between power distance scores and financial disclosure. Gray (1988) proposes that power distance is positively related with secrecy, as less information is expected to preserve power inequalities. However, Zarzeski (1996), Jaggi and Low (2000) and Hope (2003) report positive relation between financial disclosure and power distance. Archambault and Archambault (2003) find contradictory results and note the negative relation between disclosure and power distance. Salter and Niswander (1995) do not find significant relation between power distance and financial disclosure. Thus, research relating to this relation does not provide conclusive results. iii. There is positive relation between secrecy and uncertainty avoidance. Gray (1988) proposes that
secrecy is positively related with uncertainty avoidance, as less information is expected to preserve security and avoid conflict and competition. In other words, a negative correlation between uncertainty avoidance and financial disclosure is expected. Salter and Niswander (1995) find significant positive relation between secrecy and uncertainty avoidance i.e. there is less financial disclosure in strong uncertainty avoidance counties. Furthermore, according to Santema, Hoekert, van de Rijt and van Oije (2005), societies with low uncertainty avoidance scores would have more detailed reporting rules (as cited by Saad 2006). Zarzeski (1996), Jaggi and Low (2000) and Hope (2003) all report negative relation between uncertainty avoidance and disclosure. On the other hand Archambault and Archambault (2003) determine positive relation between uncertainty avoidance and financial disclosure. Again, there is lack of consensus in the direction of relation.
iv. There is negative relation between masculinity and secrecy. Gray (1988) hypothesizes that the lower a country ranks in masculinity; it is more likely that it ranks high in secrecy. More caring societies (i.e. feminine societies) will tend to be more open especially in disclosure of socially related information (Gray, 1988). Furthermore, Santema, Hoekert, van de Rijt and van Oije (2005) propose that in masculine societies such as Germany, disclosures would include more economic and financial information, whereas in feminine societies, such as Sweden, social aspects would be emphasized in disclosures (as cited in Saad, 2006). According to Zarzeski (1996), masculine societies are more competitive and competition requires reduced costs, for that reason she expects a positive relation between masculinity and financial disclosure. Her findings support her expectations. On the other hand, Jaggi and Low (2000), Hope (2003) and Archambault and Archambault (2003) determine a negative relation between masculinity and financial disclosure. However, Salter and Niswander (1995) do not find significant relation between secrecy and masculinity.
Studies that investigate joint dimension demonstrate that collectivist and high power distance societies prefer secrecy and tend to disclose information only to those who have direct managerial and financial responsibilities (Velayutham and Perera, 2004). In another line Jaggi and Low (2000) also investigate the impact of culture on financial disclosure in Common and Code Law countries. Their findings suggest that culture do not influence the level of disclosure in Common Law countries but it is an important factor in Code Law countries. In contrast, Hope (2003) find that the impact of legal systems don‟t override the impact of cultural values on the level of financial disclosure.
In light of these findings, it is apparent that culture does influence disclosure level but the association results are inconclusive.
3. Methodology
This study investigates whether culture continues to influence the amount of financial disclosure after the use of IFRS by several countries. We anticipate IFRS to facilitate the presentation of comparable financial statements, thus the differences that might be caused by culture in the amount and content of disclosure of companies domiciled in different countries could decrease, even disappear.
3.1 The Sample
The sample comprises 2004, 2005 and 2006 financial statements of companies from six countries: Australia, France, Germany, Italy, the Netherlands and the United Kingdom. All of these countries started to require the use of either IFRS or accounting standards similar to IFRS effective from 1 January 2005. Financial institutions and insurance companies are excluded from the study; because such companies might be subject to different disclosure requirements. Minimum 25 English financial reports of companies from France, Germany, Italy and the Netherlands, included in the stock exchange indices comprising large companies, are selected in the sample. From English speaking Australia and The United Kingdom, companies are selected randomly from stock exchange index constituents. Overall the study uses 498 firm-year observations and the accounting standards used by the sample companies during 2004-2006 are presented in Table 1.
Insert table (1) about here
As can be observed from Table 1 during 2004, except for German companies, majority uses national standards. Other standards mainly represent US GAAP, which is mostly used by German and Dutch Companies. Although the adoption of IFRS became a legal requirement in 2005, companies in some of these countries started using IFRS before 2005. For example, Germany allowed listed companies to prepare consolidated financial statements according to IFRS or US GAAP (Delvaille et al., 2005). Significant number of Australian and British companies within the sample continues to use national standards in 2005, as their reporting period falls after 31 December. The sample includes the same companies along analysis period, however, the sample size decreases in Germany, Australia, the Netherlands and the United Kingdom because of mergers and acquisitions.
3.2Disclosure Index
Previous disclosure studies construct disclosure indices, utilizing disclosure checklists. Some researchers use self-constructed checklists (Meek et.al, 1989; Wallace et al. 1994; Zarzeski, 1996 and Webb et al., 2008) whereas some use checklists developed by others (Hope, 2003 and Archambault and Archambault, 2003). Disclosure checklists either include only voluntary disclosure items (Meek and Gray, 1989 and Webb et al. 2008) or both voluntary and mandatory disclosure items (Singhvi and Desai, 1971; Choi, 1973; Barret, 1976 and Inchausti, 1997) where the number of items range from 17 to 224 (Inchausti, 1997). This study uses a self-constructed disclosure checklist consisting mainly of mandatory disclosure items. A self-constructed checklist is deemed necessary, as this study aims at investigating the disclosure levels before and after IFRS based on IFRS disclosure requirements. All IAS and IFRS are examined for the required information except for IAS 11 (Construction Contracts), IAS 26 (Accounting and Reporting by Retirement Benefit Plans), IAS 30 (Disclosures in Financial Statements of Banks and Similar Institutions), IAS 41 (Agriculture) and IFRS 4 (Insurance Contracts). Furthermore, disclosure requirements of IAS 34 (Interim Financial Reporting) are excluded from the checklist, as only annual financial statements are analyzed. The revisions on the standards effective from 1 January 2007 or the new IFRS developed are also excluded from the checklist. Ultimately, the checklist includes 133 disclosure items.
The disclosure index used in this study does not measure the quality of disclosure but only reports the existence of the disclosure items in the financial statements. No weights are assigned to items in the measurement of the index. Choi and Wong Boren, (1987) and Zarzeski (1996) study disclosure with both weighted and un-weighted indices and find no difference among the results. Financial statements are examined carefully to assess the existence of the disclosure items. In doing so, if disclosure items are present in the financial statements the index got 1 or otherwise 0. When a disclosure is deemed irrelevant for a specific company, then the item is ignored in the computation of the index for that company. The relevance of an item is assessed by a very careful and thorough review of all the notes to the financial statements and the accompanying annual reports.
3.3 Hypothesis
Based on prior literature, we expect culture to influence financial disclosure in 2004 financial statements. However, starting from 2005, with the wide use of IFRS, we expect the differences to disappear. Thus the alternative hypothesis is as follows:
Hypothesis 1: The impact of culture on the financial disclosure will disappear with the use of IFRS.
Disclosure index developed from the disclosure checklist is the dependent, and the Hofstede‟s (1991) cultural dimension scores are the main independent variables in the model (Table 2). Furthermore, legal enforcement, market capitalization, size of the company, cross quotation and profitability are used as control variables at the country and firm level.
The legal enforcement by La Porta et al. (1998) is used as an institutional variable as a determinant of financial development. Legal enforcement for each country is measured as the mean score of five enforcement variables- Efficiency of Judicial System; Rule of Law; Corruption; Risk of Appropriation; Risk of Contract Repudiation, as presented by La Porta et al. (1998). Countries with high legal enforcement scores are expected to have high financial development; therefore, financial disclosure is also expected to be high in those countries. Legal Enforcement variable for each country in the sample is presented in Table 2.
Insert table (2) about here
Size of equity markets represented by the total market capitalization is also an indicator of market development. According to Adhikari and Tondkar (1992) and Jaggi and Low (2000), market size increases the disclosure requirements and the level of disclosure by the market participants. We used the mean score of total market capitalization as a percentage of GDP for the preceding three years of the disclosure index, as a control variable. Information on market capitalization as percentage of GDP is obtained from the World Development Indicators, World Bank and is presented in Table 3.
Insert table (3) about here
Size of the company, cross quotation and profitability are firm level control variables in the study. Large companies are expected to have higher agency costs thus they are expected to disclose more information so as to decrease such costs; and they generally have more resources to supply more information. Wallace et al. (1994), Meek et al. (1995), Zarzeski (1996), Inchausti (1997), Ahmed and Courtis (1999), Hope (2003), Archambault and Archambault (2003) support this conjecture since they find positive relation between size of the firm and the level of disclosure. Wallace et al. (1994) also argue that small companies may avoid disclosing information in order not to lose their competitive edge.
According to Inchausti (1997), cross listed companies are expected to disclose more financial information in order to comply with the regulations of different exchanges and to decrease their cost of capital. Meek and Gray (1989) observe that Continental European companies listed in London Stock Exchange disclose more information than the national regulatory requirements. Hope (2003) studies disclosure practices in 39 countries and reports that cross listed companies significantly disclose more information. Inchausti (1997) and Archambault and Archambault (2003)‟s studies support these findings.
According to Agency Theory, management of profitable companies may disclose more information in order strengthen their position in the company (Inchausti, 1997). Furthermore, consistent with Signaling Theory when profitability is good, management would prefer to convey it with more information (Inchausti, 1997). However, research in this area provides mixed results. While, Ahmed and Courtis (1999) note that profitable companies have more voluntary disclosure, Wallace et al. (1994), Inchausti (1997) and Ahmed and Courtis (1999) do not find significant relation between financial disclosure and profitability.
To test our hypothesis, we developed the following disclosure model:
b bCulture bTA bPM bCQ bENF bMRKCAP b t bt
,
Disci t o 1 c 2 i,t 3 i,t 4 i,t 5 c 6 c,t 7 1 82
Disci,t = disclosure index of company i at time t,
Culturec = Cultural dimensions of country c defined as:
Ic = Individualism value for country c,
UAc = Uncertainty avoidance value of country c,
PDc = Power distance value of country c,
Mc = Masculinity value of country c,
TAi,t = Total assets of company i at time t,
PMi,t = Profit margin of company i at time t,
CQi,t = Cross quotation of company i at time t (coded 1 if cross quoted, coded 0 if not).
ENFc = Legal Enforcement value of country c
MRKCAPc,t = Market capitalization of country c at time t,
t1 = time dummy 1 (coded 0 for the years 2004 and 2006 and 1 for 2005)
t2 = time dummy 1 (coded 0 for the years 2004 and 2005 and 1 for 2006)
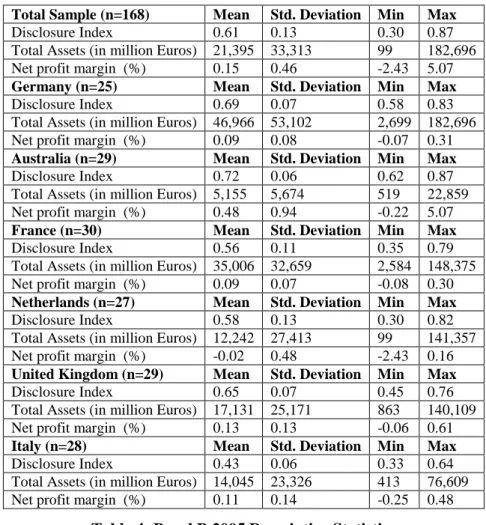
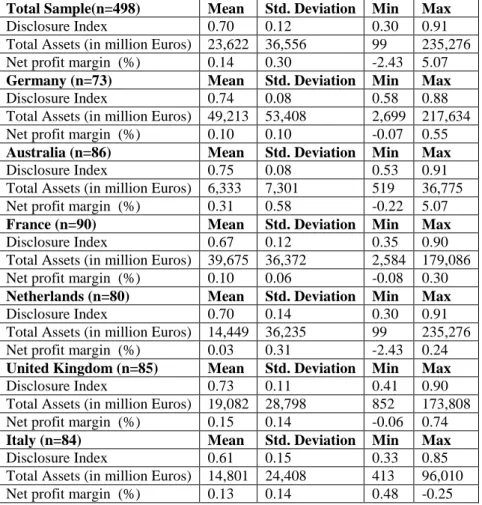
Size is measured as total assets of a company expressed in Euros. When the functional or reporting currency is not Euro, the figures are translated by using the year-end exchange rate. The natural logarithms of total assets are included in the model in order to avoid heterocedasticity problems. Net profit margin (net income to total sales) is used as a measure of profitability. The descriptive statistics are presented in Table 4 in Panel A, Panel B, Panel C, and Panel D for 2004, 2005, 2006 and for all years, respectively.
In 2004, the highest mean disclosure index belongs to Australian companies, followed by Germans, while Italians have the lowest. As expected there is an increase in the disclosure index from 2004 to 2006, since the use of IFRS increased over that period. In 2005, except for British and Australian companies all companies increased their mean score of disclosure index. The main reason is that some British and Australian companies don‟t start using IFRS in 2005, but the disclosure levels considerably increase for these countries in 2006 after they adopt IFRS. In terms of size, the average of total assets suggest that German and French companies are the largest, while, Australian companies are the smallest with the highest average net profit margin. Dutch companies on the other hand are midsized with the lowest average net profit margin.
4. Analysis and Results
The correlation among dependent and independent variables is presented in Table 5. Insert table (5) about here
There is significant correlation between the cultural dimensions and the disclosure index, except for masculinity. There is significant negative correlation between financial disclosure and uncertainty avoidance and power distance; and significant positive correlation between disclosure and individualism as previous literature suggest (Zarzeski, 1996; Jaggi and Low, 2000; Hope, 2003). There is also significant correlation among the cultural dimensions except for masculinity. Thus the regression analyses are performed by including only one cultural dimension at a time. There is significant positive correlation between disclosure index and total assets, suggesting that large companies disclose more information in their financial statements as suggested by previous research. Furthermore, the significant positive correlation between disclosure index and legal enforcement and market capitalization indicates that financial disclosure is higher in developed markets. The significant correlation with net profit margin and disclosure index also points out that, profitable companies disclose more information.
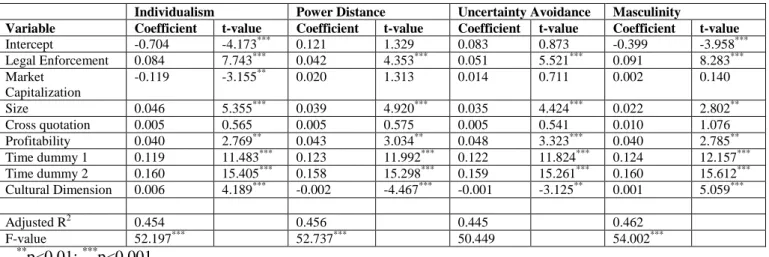
The ordinary least squares regression results are presented in Table 6. The disclosure model which includes the independent variables of legal enforcement, market capitalization, size of the company, cross quotation, net profit margin, time variables and the cultural dimensions, is significant (p<0.001). The adjusted R2 of the model ranges between 0.445 and 0.462 for the cultural dimensions of uncertainty avoidance, individualism, power distance and masculinity, where uncertainty avoidance is the least significant.
Insert table (6) about here
Individualism is expected to have positive effect on disclosure as demonstrated by Zarzeski (1996); Jaggi and Low (2000); Hope (2003) and Archambault and Archambault (2003). The findings of this study also demonstrate that the cultural dimension of individualism is significantly related with disclosure index of companies in all years. These results suggest that the use of IFRS does not eliminate the effect of individualism on the disclosure levels. The higher is the individualism value of country, the higher is the amount of disclosure. Gray (1988) states that lower power distance values are related with more disclosure. The previous results on power distance are not conclusive. Zarzeski (1996), Jaggi and Low (2000) and Hope (2003) report a significant positive relation between disclosure and power distance, but Archambault and Archambault (2003) report a negative relation. Results of this study reveal significant negative relation between power distance and disclosure as well.
A negative relation is determined between uncertainty avoidance and disclosure in previous research (Zarzeski, 1996; Jaggi and Low, 2000 and Hope 2003). Similar results are obtained in this study; disclosure level of companies is significantly affected by uncertainty avoidance. Companies belonging to countries with low uncertainty avoidance disclose more information on their financial statements. Different results are obtained on the effects of masculinity on the financial disclosure. Zarzeski (1996) and Jaggi and Low (2000) report positive relation, whereas Hope (2003) and Archambault and Archambault (2003) report negative relation. In this study, positive and significant relation is determined between disclosure and masculinity. The results are consistent with the view that, masculine societies are competitive and competition requires more information.
The regression results show that large companies disclose more information. Prior research on the effect of size on financial disclosure reports similar findings (Meek and Gray, 1989; Wallace et. al, 1994; Zarzeski, 1996; Inchausti, 1997; Ahmed and Courtis, 1999; Hope, 2003). Similar results are obtained when the natural logarithm of total sales is used as a measure of size, the results of which are not presented in this paper. Earlier research report contradictory findings regarding the effects of profitability and disclosure. The results of this study reveal a positive relation between disclosure and net profit margin; and hence they are consistent with the Signaling Theory that profitable companies convey their performance to investors by supplying more information.
Although listing in more than one stock exchange has been found to be a significant variable in explaining financial disclosure in previous studies (Meek and Gray, 1989; Inchausti, 1997; Hope, 2003 and Archambault and Archambault, 2003), cross listing does not display significant relation with the disclosure level in this study. This result is not surprising since the adoption of IFRS by various stock exchange regulations enhance convergence of disclosure requirements. Earlier research built up the expectation that disclosure will be higher in developed markets. The results of this study support the expectations as the legal enforcement value of a country is found to have significant positive relation with the financial disclosure. As previous literature suggests market size leads to an increase in the disclosure requirements and the level of disclosure by the companies (Adhikari and Tondkar, 1992 and Jaggi and Low, 2000). However, according to the results of our analysis, we find no significant relation between the market capitalization and financial disclosure, except for the model in which individualism is included as the cultural dimension variable, where it is found that market capitalization display a significant negative relation with disclosure. There is significant correlation between individualism and market capitalization, however, we conclude that there is no multicollinearity problem as the VIF value is less than 10 (Neter et al., 1989).
Both of the time dummy variables are positively and significantly related with the level of disclosure as expected. For fiscal 2004 only 10% of companies in the sample used IFRS to prepare their financial statements, while most companies reported according to IFRS in 2005 with the exception of some British and Australian companies that continued to use national standards. The majority of companies within the sample used IFRS as the basis of financial statement preparation for fiscal 2006. This development is observed in the increasing disclosure levels from 2004 to 2006. Although this study does not measure the quality of disclosure, the increase in the disclosure level from 2004 to 2006 is consistent with the results of Daske and Gebhardt (2006), who report a significant increase in the perceived disclosure quality upon the application of internationally recognized accounting standards in Germany, Switzerland and Austria. The independent variable- disclosure index is prepared by the use of a checklist constructed from IFRS. Since majority of the sample companies did not use IFRS for fiscal 2004, we repeated the analysis by excluding 2004 data from the sample. The disclosure model which includes the same independent variables, is significant (p<0.001). The adjusted R2 of the model ranges between 0.136 and 0.151 and except for masculinity; cultural dimensions are significantly related with the financial disclosure.
5. Conclusion
This study investigates whether culture still affect the amount of financial disclosure of companies after the use of IFRS effective from 1 January 2005. We use the cultural dimensions developed by Hofstede (1991) as a proxy of culture and analyze financial disclosure of companies for three years-2004, 2005 and 2006-, from Australia, France, Germany, Italy, Netherlands and United Kingdom. The results show that cultural dimensions- individualism; power distance; uncertainty avoidance; masculinity- significantly affect the level of financial disclosure of sample companies. The findings suggest that, although the disclosure in the financial statements improves after the use of IFRS, the impact of culture on the disclosure level continues to play an important role.
As Han at al. (2010) report in their study on the effects of national culture on earnings management, use of same accounting standards may not necessarily mean that similar reporting practices are followed. Tsakumis (2007) also reports that uniform accounting standards may not result in similar disclosure decisions and national culture plays a role in accountants‟ disclosure judgments. Our findings are also consistent with Street and Bryant (2000) and show that the urge to use standards does not necessarily mean that the standards are fully observed. On the other hand, our findings contradict with Inchausti‟s (1997) view that positive accounting theory is not sufficient to explain the disclosure of companies; instead the information to be disclosed should be regulated.
The study includes financial statements of mostly large companies from six countries for a period of three years. To have more conclusive results the study should be extended to include the financial statements of companies from other countries at different sizes. Furthermore, improved levels of disclosure over 2004-2006 suggests a future study to be conducted to include more recent financial statements and investigate the continuing effects of culture on financial disclosure.
Acknowledgements
A previous version of this paper was presented at European Accounting Association 32nd Annual Congress (Tampere, Finland 2009). The author thanks the participants at the congress for their suggestions. The author also acknowledges the suggestions and comments by Can Simga Mugan, Middle East Technical University.
REFERENCES
Adhikari, A., and R.H. Tondkar, „Environmental Factors Influencing Accounting Disclosure Requirements of Global Stock Exchanges‟, Journal of International Financial Management and Accounting, Vol. 4, No. 2, 1992.
Ahmed, K. and J.K. Courtis, „Associations between Corporate Characteristics and Disclosure Levels in Annual Reports: A Meta Analysis‟, British Accounting Review, Vol. 31, 1999.
Archambault, J.J. and M.E. Archambault, „A Multinational Test of Determinants of Corporate Disclosure‟, The
International Journal of Accounting, Vol. 38, 2003.
Barret, M.E., „Financial Reporting Practices: Disclosure and Comprehensiveness in an International Setting‟,
Journal of Accounting Research, Vol. 14, No. 1, 1976.
Choi, F.D.S., C.A Frost and G.K. Meek, International Accounting. Prentice Hall International Editions, 1999. Choi, F.D.S. , „Financial Disclosure and Entry to the European Capital Market‟, Journal of Accounting Research,
Vol. 11, No.2, 1973.
Chow, C. W. and A. Wong-Boren, „Voluntary Financial Disclosure by Mexican Corporations‟, The Accounting
Review, Vol. 62, No. 3, 1987.
Daske, H. and G. Gebhardt, „International Financial Reporting Standards and Experts‟ Perceptions of Disclosure Quality‟, ABACUS, Vol. 42, Nos. 3/4, 2006.
Delvaille, P., G. Ebbers and C. Saccon, „International Financial Reporting Convergence: Evidence from Three Continental European Countries‟, Accounting in Europe, Vol. 2, 2005.
Ding, Y, T. Jeanjean, and H. Stolowy, „Why do National GAAP differ from IAS? The Role of Culture‟, The
International Journal of Accounting, Vol. 40, 2005.
Doupnik, T.S. and H. Perera, International Accounting, McGraw Hill, 2007.
Doupnik, S.T. and S.B. Salter, „An Empirical Test of a Judgmental International Classification of Financial Reporting Practices‟, Journal of International Business Studies, First Quarter, 1993.
Financial Accounting Standards Board. 2010. International Convergence of Accounting Standards- A Brief History.
http://www.fasb.org. Accessed 9 April 2010.
Gray, S.J., „Towards a Theory of Cultural Influence on the Development of Accounting Systems Internationally‟,
ABACUS, Vol. 24, No. 1, 1988.
Gray, S.J., „The Impact of International Differences from a Security Analysis Perspective‟, Journal of Accounting
Research, Vol.18, No. 1, 1980.
Han, S., T. Kang, S. Salter, and Y.K. Yoo, „A Cross Country Study on the Effects of National Culture on Earnings Management‟, Journal of International Business Studies, Vol. 41, 2010.
Hofstede, G., Cultures and Organizations Software of the Mind, McGraw Hill, 1991.
Hofstede, G., „Cultural Dimensions in Management and Planning‟, Asia Pacific Journal of Management, 1984. Hope, O.K., „Firm-Level Disclosures and the Relative Roles of Culture and Legal Origin‟, Journal of International
Financial Management and Accounting, Vol. 14, No. 3, 2003.
Inchausti, B.G., „The Influence of Company Characteristics and Accounting Regulation on Information Disclosed by Spanish Firms‟, The European Accounting Review, Vol. 6, No. 1, 1997.
Jaggi, B. and P.Y. Low, „Impact of Culture, Market Forces, and Legal System on Financial Disclosures‟, The
International Journal of Accounting, Vol. 35, No. 4, 2000.
La Porta, R., F. Lopez-de-Silanes, and A. Shleifer, „Law and Finance‟, Journal of Political Economy, Vol. 106, No. 6, 1998.
Lainez, J.A. and M. Gasca, „Obstacles to the Harmonization process in the European Union: the Influence of Culture‟, International Journal of Accounting, Auditing and Performance Evaluation, Vol. 3, No. 1, 2006. Meek, G.K., C.B. Roberts, and S.J. Gray, „Factors Influencing Voluntary Annual Report Disclosures by US, UK
and Continental European Multinational Corporations‟, Journal of International Business Studies, Vol. 26, No. 3, 1995.
Meek, G.K. and S.T. Gray, „Globalization of Stock Markets and Foreign Listing Requirements: Voluntary Disclosures by European Companies Listed on the London Stock Exchange‟, Journal of International Business
Studies, Vol. 20, No. 2, 1989.
Nair, F.D. and G.F. Frank, „The Impact of Disclosure and Measurement Practices on International Accounting Classifications‟, The Accounting Review, Vol. LV, No. 3, 1980.
Nobes, C.W., „Judgmental International Classification of Financial Reporting Practices‟, Journal of Business
Finance and Accounting, Vol. 10, No. 1, 1983.
Saad C., „The Effects of Corporate and International Culture on Achieving and Maintaining Strong Corporate
Governence‟, http://digitalcommons.pace.edu/honorscollege_theses/28, 2006.
Salter S.B. and F. Niswander, „Cultural Influence on the Development of Accounting Systems Internationally: A Test of Gray‟s (1988) Theory‟, Journal of International Business Studies, Vol. 26, No. 2, 1995.
Singhvi, S.S. and H.B. Desai, „An Empirical Analysis of the Quality of Corporate Financial Disclosure‟, The
Accounting Review, Vol. 46, No. 19, 1971.
Street, D.L. and S.M. Bryant, „A Comparison of Companies with and Without U.S. Listings and Filings‟, The
International Journal of Accounting, Vol. 35, No. 3, 2000.
Tsakumis, G.T., „The Influence of Culture on Accountants‟‟ Application of Financial Reporting Rules‟, ABACUS, Vol. 43, No. 1, 2007.
Velayutham S. and M.H.B. Perera, „The Influence of Emotions and Culture on Accountability and Governance‟,
Corporate Governance, Vol. 4, No. 1, 2004.
Wallace, R.S., K. Naser, and A. Mora, „The Relationship between the Comprehensiveness of Corporate Annual Reports and Firm Characteristics in Spain‟, Accounting and Business Research, Vol. 97, 1994.
Webb, K. A., S.F. Cahan, and J. Sun, „The Effect of Globalization and Legal Environment on Voluntary Disclosure‟, The International Journal of Accounting, Vol. 43, 2008.
Zarzeski, M.T., „Spontaneous Harmonization Effects of Culture and Market Forces on Accounting Disclosure Practices‟, Accounting Horizons, Vol. 10, No. 1, 1996.
TABLES
Table 1- Accounting Standards Used
2004 2005 2006
Total Nation. IFRS Other Total Nation. IFRS Other Total Nation. IFRS Other
Germany 25 2 15 8 24 2 15 7 24 0 18 6 Australia 29 26 0 3 28 19 7 2 28 0 27 1 France 30 27 2 1 30 0 29 1 30 0 29 1 Netherlands 27 19 1 7 26 0 24 2 26 0 25 1 United Kingdom 29 28 0 1 29 12 16 1 27 1 25 1 Italy 28 27 0 1 28 0 27 1 28 0 27 1
Table 2- Country Cultural Dimension Scores (*) and Legal Enforcement Values (**)
Individualism Power Distance Uncertainty Avoidance Masculinity Legal Enforcement Germany 67 35 65 66 9.366 Australia 90 36 51 61 9.300 France 71 68 86 43 8.974 Netherlands 80 38 53 14 9.866 United Kingdom 89 35 35 66 9.402 Italy 76 50 75 70 7.946
(*) Source: Hofstede G., 1991, Cultures and Organizations, Software of the Mind. Mc Graw Hill: UK (**) Source: La Porta et al., (1998), p. 1142
Table 3- Market Capitalization as a Percentage of GDP (*)
2004 2005 2006 Germany 0.45 0.41 0.44 Australia 1.09 1.19 1.26 France 0.76 0.72 0.78 Netherlands 0.99 0.90 0.91 United Kingdom 1.34 1.28 1.34 Italy 0.42 0.42 0.44
Table 4- Panel A 2004 Descriptive Statistics
Total Sample (n=168) Mean Std. Deviation Min Max
Disclosure Index 0.61 0.13 0.30 0.87
Total Assets (in million Euros) 21,395 33,313 99 182,696
Net profit margin (%) 0.15 0.46 -2.43 5.07
Germany (n=25) Mean Std. Deviation Min Max
Disclosure Index 0.69 0.07 0.58 0.83
Total Assets (in million Euros) 46,966 53,102 2,699 182,696
Net profit margin (%) 0.09 0.08 -0.07 0.31
Australia (n=29) Mean Std. Deviation Min Max
Disclosure Index 0.72 0.06 0.62 0.87
Total Assets (in million Euros) 5,155 5,674 519 22,859
Net profit margin (%) 0.48 0.94 -0.22 5.07
France (n=30) Mean Std. Deviation Min Max
Disclosure Index 0.56 0.11 0.35 0.79
Total Assets (in million Euros) 35,006 32,659 2,584 148,375
Net profit margin (%) 0.09 0.07 -0.08 0.30
Netherlands (n=27) Mean Std. Deviation Min Max
Disclosure Index 0.58 0.13 0.30 0.82
Total Assets (in million Euros) 12,242 27,413 99 141,357
Net profit margin (%) -0.02 0.48 -2.43 0.16
United Kingdom (n=29) Mean Std. Deviation Min Max
Disclosure Index 0.65 0.07 0.45 0.76
Total Assets (in million Euros) 17,131 25,171 863 140,109
Net profit margin (%) 0.13 0.13 -0.06 0.61
Italy (n=28) Mean Std. Deviation Min Max
Disclosure Index 0.43 0.06 0.33 0.64
Total Assets (in million Euros) 14,045 23,326 413 76,609
Net profit margin (%) 0.11 0.14 -0.25 0.48
Table 4- Panel B 2005 Descriptive Statistics
Total Sample(n=167) Mean Std. Deviation Min Max
Disclosure Index 0.73 0.09 0.42 0.91
Total Assets (in million Euros) 23,925 37,033 170 201,632
Net profit margin (%) 0.13 0.14 -0.48 0.88
Germany (n=24) Mean Std. Deviation Min Max
Disclosure Index 0.76 0.08 0.62 0.88
Total Assets (in million Euros) 48,154 54,055 3,633 201,632
Net profit margin (%) 0.10 0.09 0.02 0.43
Australia (n=29) Mean Std. Deviation Min Max
Disclosure Index 0.72 0.09 0.53 0.89
Total Assets (in million Euros) 6,688 7,909 662 35,372
Net profit margin (%) 0.21 0.20 -0.17 0.88
France (n=30) Mean Std. Deviation Min Max
Disclosure Index 0.72 0.08 0.52 0.90
Total Assets (in million Euros) 41,596 38,624 3,026 170,914
Net profit margin (%) 0.10 0.06 0.01 0.22
Netherlands (n=27) Mean Std. Deviation Min Max
Disclosure Index 0.76 0.09 0.60 0.91
Total Assets (in million Euros) 14,359 34,961 170 181,873
Net profit margin (%) 0.06 0.12 -0.48 0.18
United Kingdom (n=29) Mean Std. Deviation Min Max
Disclosure Index 0.73 0.11 0.42 0.88
Total Assets (in million Euros) 19,807 31,421 852 173,808
Net profit margin (%) 0.16 0.13 0.01 0.63
Italy (n=28) Mean Std. Deviation Min Max
Disclosure Index 0.69 0.09 0.44 0.85
Total Assets (in million Euros) 14,953 25,615 573 96,010
Table 4- Panel C 2006 Descriptive Statistics
Total Sample(n=163) Mean Std. Deviation Min Max
Disclosure Index 0.77 0.08 0.41 0.91
Total Assets (in million Euros) 25,620 39,278 527 235,276
Net profit margin (%) 0.14 0.17 -0.74 1.10
Germany (n=24) Mean Std. Deviation Min Max
Disclosure Index 0.78 0.07 0.62 0.86
Total Assets (in million Euros) 52,612 55,193 6,340 217,634
Net profit margin (%) 0.11 0.14 0.04 0.55
Australia (n=28) Mean Std. Deviation Min Max
Disclosure Index 0.82 0.07 0.65 0.91
Total Assets (in million Euros) 7,229 8,246 527 36,775
Net profit margin (%) 0.24 0.27 -0.01 1.10
France (n=30) Mean Std. Deviation Min Max
Disclosure Index 0.73 0.07 0.59 0.85
Total Assets (in million Euros) 42,424 38,307 3,124 179,086
Net profit margin (%) 0.10 0.06 0.00 0.23
Netherlands (n=26) Mean Std. Deviation Min Max
Disclosure Index 0.78 0.08 0.63 0.90
Total Assets (in million Euros) 16,834 45,664 653 235,276
Net profit margin (%) 0.05 0.18 -0.74 0.24
United Kingdom (n=27) Mean Std. Deviation Min Max
Disclosure Index 0.80 0.09 0.41 0.90
Total Assets (in million Euros) 20,398 30,449 1,458 164,942
Net profit margin (%) 0.18 0.16 0.00 0.74
Italy (n=28) Mean Std. Deviation Min Max
Disclosure Index 0.71 0.08 0.50 0.84
Total Assets (in million Euros) 15,406 25,104 755 89,457
Net profit margin (%) 0.13 0.13 -0.18 0.48
Table 4- Panel D All Years Descriptive Statistics
Total Sample(n=498) Mean Std. Deviation Min Max
Disclosure Index 0.70 0.12 0.30 0.91
Total Assets (in million Euros) 23,622 36,556 99 235,276
Net profit margin (%) 0.14 0.30 -2.43 5.07
Germany (n=73) Mean Std. Deviation Min Max
Disclosure Index 0.74 0.08 0.58 0.88
Total Assets (in million Euros) 49,213 53,408 2,699 217,634
Net profit margin (%) 0.10 0.10 -0.07 0.55
Australia (n=86) Mean Std. Deviation Min Max
Disclosure Index 0.75 0.08 0.53 0.91
Total Assets (in million Euros) 6,333 7,301 519 36,775
Net profit margin (%) 0.31 0.58 -0.22 5.07
France (n=90) Mean Std. Deviation Min Max
Disclosure Index 0.67 0.12 0.35 0.90
Total Assets (in million Euros) 39,675 36,372 2,584 179,086
Net profit margin (%) 0.10 0.06 -0.08 0.30
Netherlands (n=80) Mean Std. Deviation Min Max
Disclosure Index 0.70 0.14 0.30 0.91
Total Assets (in million Euros) 14,449 36,235 99 235,276
Net profit margin (%) 0.03 0.31 -2.43 0.24
United Kingdom (n=85) Mean Std. Deviation Min Max
Disclosure Index 0.73 0.11 0.41 0.90
Total Assets (in million Euros) 19,082 28,798 852 173,808
Net profit margin (%) 0.15 0.14 -0.06 0.74
Italy (n=84) Mean Std. Deviation Min Max
Disclosure Index 0.61 0.15 0.33 0.85
Total Assets (in million Euros) 14,801 24,408 413 96,010
Table 5 Correlation among Variables
*
p<0.05;**p<0.01; ***p<0.001
Table 6 Ordinary Least Squares Regression
Individualism Power Distance Uncertainty Avoidance Masculinity
Variable Coefficient t-value Coefficient t-value Coefficient t-value Coefficient t-value
Intercept -0.704 -4.173*** 0.121 1.329 0.083 0.873 -0.399 -3.958*** Legal Enforcement 0.084 7.743*** 0.042 4.353*** 0.051 5.521*** 0.091 8.283*** Market Capitalization -0.119 -3.155** 0.020 1.313 0.014 0.711 0.002 0.140 Size 0.046 5.355*** 0.039 4.920*** 0.035 4.424*** 0.022 2.802** Cross quotation 0.005 0.565 0.005 0.575 0.005 0.541 0.010 1.076 Profitability 0.040 2.769** 0.043 3.034** 0.048 3.323*** 0.040 2.785** Time dummy 1 0.119 11.483*** 0.123 11.992*** 0.122 11.824*** 0.124 12.157*** Time dummy 2 0.160 15.405*** 0.158 15.298*** 0.159 15.261*** 0.160 15.612*** Cultural Dimension 0.006 4.189*** -0.002 -4.467*** -0.001 -3.125** 0.001 5.059*** Adjusted R2 0.454 0.456 0.445 0.462 F-value 52.197*** 52.737*** 50.449 54.002*** ** p<0.01; ***p<0.001 Disclosur e Index Legal Enforcement Market Capitalization Total Assets Net Profit Margin Individualism Power Distance Uncertainty Avoidance Masculinity Disclosure Index 1.00 0.32 *** 0.22*** 0.15** 0.10* 0.15** -0.26*** -0.25*** -0.01 Legal Enforcement 1.00 0.56 *** 0.02 -0.03 0.26*** -0.48*** -0.57*** -0.56*** Market Capitalization 1.00 -0.22*** 0.11 * 0.87*** -0.37*** -0.76*** -0.13** Total Assets 1.00 -0.05 -0.34*** 0.15*** 0.21*** 0.03 Net Profit Margin 1.00 0.19 *** -0.08 -0.09* 0.16*** Individualism 1.00 -0.51*** -0.79*** 0.08 Power Distance 1.00 0.85 *** -0.15** Uncertainty Avoidance 1.00 -0.06 Masculinity 1.00