i
A STUDY ON THE PRIMARY COMPONENTS OF INCOME: A CASE OF TURKEY
A THESIS SUBMITTED TO
THE INSTITUTE OF SOCIAL SCIENCES OF
YILDIRIM BEYAZIT UNIVERSITY
BY
SERDAR TURAÇ
IN PARTIAL FULFILLMENT OF THE REQUIREMENTS FOR
THE DEGREE OF DOCTOR OF PHILOSOPHY IN
THE DEPARTMENT OF BANKING AND FINANCE
NOVEMBER 2014
iii
I hereby declare that all information in this thesis has been obtained and presented in accordance with academic rules and ethical conduct. I also declare that, as required by these rules and conduct, I have fully cited and referenced all material and results that are not original to this work; otherwise I accept all legal responsibility.
Name, Last Name: Serdar TURAÇ Signature:
iv ABSTRACT
A STUDY ON THE PRIMARY COMPONENTS OF INCOME: A CASE OF TURKEY
TURAÇ, Serdar
Ph.D., Department of Banking and Finance Supervisor: Assist. Prof. Erhan ÇANKAL
November 2014, 96 pages
The objective of this study is to analyze the effects of social, economic, and individual factors on individual earnings. This research study is motivated by Becker’s Human Capital Model and Mincer’s studies on wage models. The empirical analyses are conducted on a unique micro data set compiled by Turkish Statistical Institute’s (TURKSTAT) in 2011, named Household Budget Survey and Income Distribution. The data set covers an effective sample size of 9,918 households and 37,121 individuals who are interviewed by TURKSTAT periodically. First, basic wage models are studied and then, these models are enriched by adding a gender effect. The findings indicate that the males earn more than females with similar characteristics, which confirm the existence of gender wage gap among economically active Turkish population. Moreover, vocational high school graduates perform economically better than other high school graduates. The study reveals other significant relationships between the earnings of economically active population and the primary determinants of income that are included in the models.
v ÖZET
GELİRİN TEMEL BİLEŞENLERİ ÜZERİNE BİR ÇALIŞMA: TÜRKİYE ÖRNEĞİ
TURAÇ, Serdar
Doktora, Bankacılık ve Finans Bölümü Tez Yöneticisi: Yrd. Doç. Dr. Erhan ÇANKAL
KASIM 2014, 96 Sayfa
Bu çalışmanın amacı bireysel kazançlar üzerinde sosyal, ekonomik ve bireysel faktörlerin etkilerini analiz etmektir. Bu araştırma çalışması Becker’in Beşeri Sermaye Modeli ve Mincer’in ücret modelleri üzerindeki çalışmalarına dayanarak ortaya çıkmıştır. Çalışmadaki ampirik analizlerde Türkiye İstatistik Kurumu (TÜİK)’in 2011 yılı için yayınladığı Hane halkı Bütçe Harcamaları ve Gelir Dağılımı anket verileri kullanmaktadır. Kullanılan veri seti TÜİK tarafından anket yöntemi ile elde edilen 9,918 hane halkı ve 37,121 bireyi kapsamaktadır. Çalışılan modeller cinsiyet etkisini daha ayrıntılı incelemek amacıyla geliştirilmiştir. Analiz sonuçlarına göre, karakteristik özellikler aynı iken erkeklerin ortalama kazançlarının kadınlarınkinden yüksek olduğu görülmüştür. Bu durum ekonomik olarak faal nüfus içinde kazançlar arasında cinsiyet temelinde erkekler lehine bir farklılığın olduğuna işaret etmektedir. Yine, çalışmanın önemli bulgularından biri, meslek lisesi mezunlarının diğer lise mezunlarına göre ekonomik olarak daha avantajlı olduğudur. Analizler sonuçları, ekonomik olarak faal nüfusun bireysel kazançları ile modellerde kullanılan başlıca gelir bileşenleri arasındaki ilişkiler hakkında da önemli bilgiler vermektedir.
vi
DEDICATION
vii
ACKNOWLEDGMENTS
The author wishes to express his deepest gratitude to his supervisor Assist. Prof. Erhan ÇANKAL for his guidance, advice, criticism, encouragements and insight throughout the research.
The author would also like to extend his gratitude to Prof. Dr. Nildağ Başak CEYLAN, Prof. Dr. Dilek DEMİRBAŞ, Assoc. Prof. Ayhan KAPUSUZOĞLU, and Assoc. Prof. Atilla GÖKÇE for their suggestions and comments.
The author expresses his highest appreciation to Mr. Ahmet ERTÜRK and Prof. Dr. Türker SUSMUŞ for their encouragement to pursue doctorate studies and academic research. The technical assistance of Assist. Prof. Cenk Cevat KARAHAN, Dr. Mustafa KILINÇ and Mr. Mehmet Akif EKER are gratefully acknowledged.
The author owes a debt of gratitude to his wife, Hacer TURAÇ for her patience and emotional support as well as her technical assistance throughout the academic program. This study was supperted by Yıldırım Beyazıt University Grant No: BAP-1584
viii TABLE OF CONTENTS PLAGIARISM ... iii ABSTRACT ... iv ÖZET ... v DEDICATION ... ivi ACKNOWLEDGMENTS ... vii
TABLE OF CONTENTS ... viii
LIST OF TABLES ... x
LIST OF FIGURES ... xii
CHAPTER 1. INTRODUCTION ... 1 2. LITERATURE REVIEW ... 3 2.1 Education/ Training ... 9 2.1.1 Education ... 9 2.1.2 Training ... 13 2.2 Gender ... 16 2.3 Age ... 17 2.4 Marital Status ... 18 2.5 Industry Types ... 18 2.6 Occupation Types ... 19 2.7 Experience... 21
2.8 Organization Type (Public/Private Sector) ... 21
ix
3. DESCRIPTION OF VARIABLES AND DATA... 25
3.1 Introduction ... 25 3.2 Description of Variables ... 26 3.2.1 Explanatory variables ... 26 3.2.2 Dependent Variables... 30 3.3 SUMMARY STATISTICS ... 31 3.3.1 Gender ... 31 3.3.2 Age ... 32 3.3.3 Marital Status ... 33 3.3.4 Education ... 36 3.3.5 Industry Types ... 38 3.3.6 Occupation ... 45 3.3.7 Experience ... 46
3.3.8 Organization Types of the Employers ... 47
3.3.9 Unionization ... 48
3.3.10 Income ... 49
4. MODEL AND EMPIRICAL RESULTS ... 65
4.1 Base Semi-logarithmic Regression Model... 65
4.1.1 Empirical Results ... 67
4.2 Semi-logarithmic Regression Model Interacted with Gender ... 73
5. CONCLUSION and DIRECTION FOR FUTURE STUDIES ... 80
REFERENCES ... 83
APPENDICES A-TURKISH SUMMARY ... 87
x
LIST OF TABLES
Table 1- Quintiles ordered by equalized household disposable income ... 4
Table 2-Income Quintile’s share from total Income (%) ... 5
Table 3-Gender Distribution of the Sample ... 31
Table 4-Age Distribution of Sample ... 32
Table 5-Marital Status ... 33
Table 6- Marital Status Groups ... 34
Table 7- Education Levels of the Sample ... 36
Table 8-Industry Types of the Sample ... 39
Table 9-Industry Type and Education Level Distribution ... 44
Table 10-Occupation Types of the Sample ... 45
Table 11-Total Years of Experience ... 46
Table 12-Organization Types ... 47
Table 13-Unionization of Private and Public Sector ... 48
Table 14-Average Incomes of the Sample ... 49
Table 15-Industry Based Average Income for Male and Female Samples ... 50
Table 16-- Industry Based Average Income for the Whole Sample ... 53
Table 17-Occupation-based Average Income for Genders ... 55
Table 18-Average Income of the Entire Sample based on Occupation ... 58
xi
Table 20-Average Income of the Entire Sample based on Education ... 63
Table 21- Base Semi-logarithmic Regression Model ... 70
Table 22-Regression Summary of the Base Model ... 72
Table 23- Semi-logarithmic Regression Model Interacted with MALE ... 75
xii
LIST OF FIGURES
Figure 1-Supply and Demand Curves for Human Capital Investment ... 8
Figure 2-Stylized Age-earnings Profiles ... 12
Figure 3- Mechanism and the contribution of training over income ... 16
Figure 4- Relationship between annual earnings and age for differently trained groups .... 20
Figure 5-Pay profiles by skill: Public and private sector ... 23
Figure 6-Gender Distribution of the Sample ... 31
Figure 7- Age Distribution of the Sample ... 33
Figure 8- Marital Status Frequency ... 34
Figure 9-Grouped Marital Status ... 35
Figure 10- Education Levels ... 37
Figure 11- Industry Types ... 40
Figure 12- Education Level Distribution (%) ... 44
Figure 13- Occupation Types ... 45
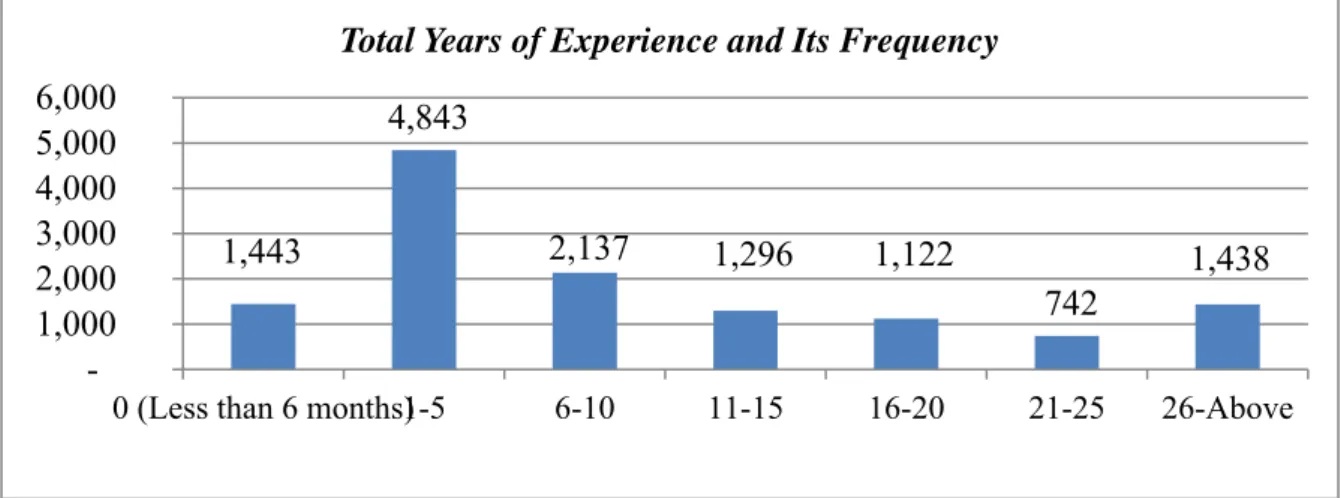
Figure 14- Total Years of Experience ... 46
Figure 15- Organization Types ... 47
Figure 16- Unionization Distribution ... 48
Figure 17- Average Incomes by Gender... 49
Figure 18- Industry Based Average Income for Male Samples ... 51
xiii
Figure 20- Industry Based Average Income for the Whole Sample ... 54
Figure 21- Occupation-based Male Incomes ... 56
Figure 22- Occupation-based Average Income for Females ... 57
Figure 23- Average Income of the Entire Sample based on Occupation ... 59
Figure 24- Education-based Average Incomes of Males... 61
Figure 25- Education-based Average Incomes of Females ... 62
1
1. INTRODUCTION
Income and related issues have been main areas of interest for local and global economies alike, because earnings and income distribution related problems create significant challenges for countries on their way to economic prosperity. Economic policy makers usually struggle in their efforts to smooth out the relationship between earnings and the primary factors that have impact on earnings. This study has attempted to understand these primary determinants of earnings and their effects on individual earnings in Turkey. For this purpose, the analyses in this study focus on explaining the factors that are affecting the income and its distribution. Although the relationship between the labor market and socio-economic factors has been extensively investigated by previous studies; in this study, three different types of income depending on primary factors such as age, gender, education level, occupation, industry, and some other personal and labor characteristics have been studied with a unique data set within the scope of Turkish case. This study consists of five sections; the theoretical exposition is presented in the first two sections, with the introduction of the theoretical model and the results of the analyses are revealed in the subsequent chapters. The discussion of the findings is presented in the following two sections. The research study has been concluded along with the direction for related future research studies is proposed in the last section.
The first section of the study introduces the previous studies focusing on the conventional earning functions and discusses their findings. The literature on human capital models is summarized with the impact of formal education and on-the-job training separated from each other. The relationships between experience and income as well as education and income have been demonstrated in detail with the aid of graphical presentations.
The second section introduces the econometric model and identifies the explanatory and dependent variables of the model. TURKSTAT’s micro-data set of 2011 Household
2
Budget Survey (conducted on 1,104 sample households) was utilized in this research study. The number of households was altered for each month adding up to 13,248 sample households in a year between 1 January – 31 December 2011 (the effective sample size was 9,918 households and 37,121 individuals).
The basic empirical analyses of the sample group in the survey have been documented in the following section in terms of each variable. This section provides clear information on descriptive statistics regarding the variables included in studied models, such as gender, age, marital status, education, type of industry, occupation, and unionization with the aid of graphical representations.
The fourth section outlines the development process of the model and presents the semi-logarithmic wage model. The study presents the measures on the effects of socio-economic and individual factors such as gender, age, marital status, education level, type of industry, occupation and unionization on the income of individuals. The discussion addresses the results of the analyses the effect of each factor on the types of individual earnings. STATA (version.10) is employed in conducting statistical and econometric analyses presented in this section.
Furthermore, in an effort to document the gender effect explicitly, the study estimates male-interacted wage models. The discussion of this additional model and its results puts emphasis on the impact of gender on income levels and distribution.
The last section concludes the study by summarizing the significant findings and offering extensions for possible future studies in the field.
3
2. LITERATURE REVIEW
One of the most vexing concerns of the developing economies like Turkey is the wage gap. This problem may sometimes stem from inefficient market mechanisms. It may also be due to different levels of human capital investments among individuals, each with their own reasons (Çelik & Selim, 2013). Human capital investment has a great impact on income, thus scholars have extensively studied the functioning and dynamics of income. Another way that wage gap issue manifests itself is income disparity. Income disparity, along with the income levels, is determined by myriad of factors that are intertwined with each other. Below is a discussion of income distribution in Turkey, which is comprised of income levels of the population.
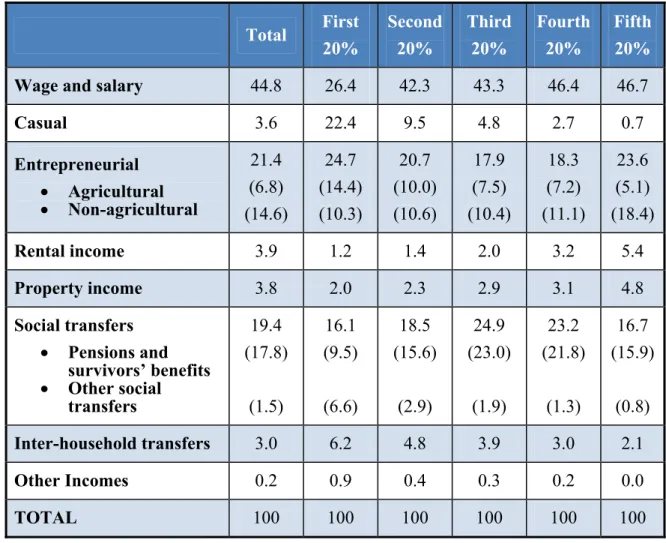
Turkey’s quintile based distribution of annual incomes by types of income is given in Table 1. First quintile has the minimum earnings whereas fifth quintile has the maximum. Wage and salary constitutes about 26% of earnings in the first quintile. On the other hand, this ratio increases dramatically to 46.7% in the fifth quintile. Besides, agricultural based entrepreneurial earnings are 14.4% in the first quintile but this ratio decreases gradually for all quintiles and ends up with 5.1% in the fifth quintile. Social transfers have the maximum value within third and fourth quintiles, 24.9% and 23.2% respectively. These differences are signs of major structural dissimilarities between high-earning and low-earning groups
4
Table 1- Quintiles ordered by equalized household disposable income and distribution of annual incomes by types of income
Total First 20% Second 20% Third 20% Fourth 20% Fifth 20% Wage and salary 44.8 26.4 42.3 43.3 46.4 46.7
Casual 3.6 22.4 9.5 4.8 2.7 0.7 Entrepreneurial Agricultural Non-agricultural 21.4 (6.8) (14.6) 24.7 (14.4) (10.3) 20.7 (10.0) (10.6) 17.9 (7.5) (10.4) 18.3 (7.2) (11.1) 23.6 (5.1) (18.4) Rental income 3.9 1.2 1.4 2.0 3.2 5.4 Property income 3.8 2.0 2.3 2.9 3.1 4.8 Social transfers Pensions and survivors’ benefits Other social transfers 19.4 (17.8) (1.5) 16.1 (9.5) (6.6) 18.5 (15.6) (2.9) 24.9 (23.0) (1.9) 23.2 (21.8) (1.3) 16.7 (15.9) (0.8) Inter-household transfers 3.0 6.2 4.8 3.9 3.0 2.1 Other Incomes 0.2 0.9 0.4 0.3 0.2 0.0 TOTAL 100 100 100 100 100 100
Source: TURKSTAT, www.tuik.gov.tr
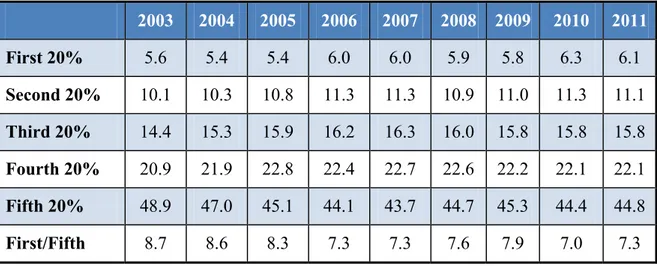
A snapshot of Turkey’s income inequality is presented in Table 2 with each quintile’s share of total income. Also in this table quintiles are ordered with respect to their income levels; the first quintile has the minimum earnings whereas the fifth quintile has the maximum. For 2003, the first quintile is getting the 5.6% of total share and it increases gradually to 48.9% for the fifth quintile. This means that the fifth quintile’s share is 8.7 times more than the first quintile’s. Although there is a slight improvement over time as the income gap between the highest earning group and the least earning group is decreasing, there is still a striking difference within groups. In 2011, first quintile’s share has increased from 5.6% to 6.1% and the fifth quintile’s share has decreased from 48.9% to 44.8%.
5
Table 2-Income Quintile’s share from total Income (%)
2003 2004 2005 2006 2007 2008 2009 2010 2011 First 20% 5.6 5.4 5.4 6.0 6.0 5.9 5.8 6.3 6.1 Second 20% 10.1 10.3 10.8 11.3 11.3 10.9 11.0 11.3 11.1 Third 20% 14.4 15.3 15.9 16.2 16.3 16.0 15.8 15.8 15.8 Fourth 20% 20.9 21.9 22.8 22.4 22.7 22.6 22.2 22.1 22.1 Fifth 20% 48.9 47.0 45.1 44.1 43.7 44.7 45.3 44.4 44.8 First/Fifth 8.7 8.6 8.3 7.3 7.3 7.6 7.9 7.0 7.3 Source: TUSIAD, 2014, p.77
Most academic studies use the human capital theory to explain the dynamics of income disparity. From a macroeconomic point of view, total human capital of the society helps to explain the economic growth while personal human capital helps to understand the wage structure from a microeconomic perspective. (Mincer, 1996)
There have been numerous studies and theories outlining the importance of human capital improvements. The fact that underdeveloped countries observe
Low literacy rate,
Unplanned rapid population growth
Malnutrition and unhealthy sheltering due to income disparities High rate of workplace accidents
Low efficiency
Falling behind the technological developments
could explain the importance of human capital investments. (Altay & Pazarlıoğlu, 2007, p.99)
6
Becker (1962, p.10) has outlined the empirical phenomena of human capital as follows:
Earnings typically increase with age at a decreasing rate. Both the rate of increase and the rate of retardation tend to be positively related to the level of skill.
Unemployment rates tend to be negatively related to the level of skill.
Firms in underdeveloped countries appear to be more "paternalistic" toward employees than those in developed countries.
Younger persons change jobs more frequently and receive more schooling and on-the-job training than older persons do.
The distribution of earnings is positively skewed, especially among professional and other skilled workers.
Abler persons receive more education and other kinds of training than others. The division of labor is limited by the extent of the market. Since this set of actions could be treated as an investment, the investor has to make the decision of the optimum investment amount based on cost/profit balance. However, it is not crystal clear as to what types of investments are human capital investments. Five categories of human capital investments have been listed in the literature:
On-the-job training,
Education at the primary, secondary, and higher education levels, Extensions and study programs for grown-ups especially in agriculture,
Health facilities and services that improves job performance and life expectancy, Relocation of families and individuals due to job changes (Schultz, 1961, p.9). Human capital investments yield efficiency improvements as well. Expenses such as nourishment, sheltering, etc. that help improve the efficiency and performance of an individual are treated as human capital investments. (Tunç, 1998)
Differences in the human capital levels of individuals result in a wide spectrum of income levels, which is also a result of their differing levels of productivity. Expectedly, firms and employers tend to compensate their more productive workers more generously. Individuals, therefore, choose to invest on human capital in order to maximize their expected future income, up to the point that marginal cost of the investment doesn’t exceed the marginal the investment return. (Ünal, 1980)
7
Becker & Chiswick (1966) explain the supply and demand for investment in human capital with the Figure-1below. There is a challenge in funding human capital investments due to lack of available funds. It is usually financed by family members or help from relatives or friends. Individuals may also use bank loans and simply borrow to finance his/her human capital investment. The financial support that young individuals get from their families varies substantially with the income level of the household and parents’ educational background. Therefore, each individual has various choices and chances to find financial support with differing supply curves. The figure below presents three different supply curves for various sources. All three curves have positive slopes because when investment amount increases, risk will increase and the possibility of finding funds from that particular source will decrease. Demand curve of human capital, on the other hand, has a negative slope due to diminishing marginal benefit from adding more capital to an individual that has its own limits of improvement. Also it is an investment for lifetime earnings and when an individual keeps investing, marginal rate of return decreases due to finite lifetime of “harvesting” his investment. Demand curves may differ due to ability level of an individual as well, because as discussed before, the rate of return on an individual with higher level of skill is higher than that of lower skilled individual. Therefore, they demand more funds and demand curve shifts to the right. Furthermore, individual choices may lead to shifts in demand curve as well.
In practice, it is difficult to measure an individual’s ability to determine his/her potential income. It is deductively accepted that who makes more money also has more ability (Becker, 1962).
Intersection points of supply and demand curves give us the optimum amount of human capital investments.
8
Figure 1-Supply and Demand Curves for Human Capital Investment
(Becker & Chiswick, 1966, p. 360)
At first glance, occupation seems to be the determining factor of income level. On the other hand, education level plays a significant role on occupation. Therefore, income is strongly dependent on education background. The impact of human capital over income distribution is observed by several interrelated factors such as the occupational decision making process and the education level of parents that is highly correlated with education level of the kids.
The academic literature has also documented the impact of more fundamental factors on income distribution. Among the most important factors, gender, talent and age of the individuals play a significant role (Yumuşak & Bilen, 2000). Ilkkaracan and Selim (2007) pointed out in a recent study that there exist a wage gap based on occupational, industrial segregation as well as gender and unionization. The investment on personal education reveals itself as highly productive and talented workforce which leads to income increases. (Altay & Pazarlıoğlu, 2007).
9
Return on educational differences has a major effect on personal income distribution inequality. The cause of such inequality is not only limited to education but also ability, gender, age, marital status, industry types, occupation type and other social and economic factors (Tunç, 1998). The main subject of this study is to determine the influence of each of these factors on income level of an individual. The following section will cover the opinions and approach of other scholars on these factors and cover the literature on the topic to serve as the foundation of the model that will be developed later.
2.1 Education/ Training
Individuals make optimal choices to how much consume and how much invest in financial economics. But there are some activities such as education which can be considered consumption and investment at the same time. Education consists of paid services, physical equipment and materials which help it considered consumption. On the other hand, those expenses increase the expected income of individuals. Therefore, it can be considered as investment.
2.1.1 Education
According to Yumuşak & Bilen (2000), insufficient human capital investment leads to disparities in income. Due to an uneven distribution of population over education levels, income is not evenly distributed in Turkey. In order to paint the dramatic situation in education levels, consider that within the Turkish workforce, university graduates make up 7.3%, vocational school graduates 8.5% and high school graduates 15.5%. Remaining 70% of the workers are either primary school graduates or people with no formal schooling at all.
It is not a coincidence to find out that main explanatory variables are usually education and experience, namely human capital. Education level and income level is directly proportional and therefore one claim that education increases the economic growth. (Altay & Pazarlıoğlu, 2007)
10
Human capital model of MINCER, studies the contribution of education (schooling) and experience (on the job training or after-school education) on net present value of life-long earnings (income distribution as well) (Tunç, 1998).
ln ln
Mincer equation above, relates the logarithm of hourly earnings to years of schooling, years of work experience and years of work experience squared. It is one of the most frequently estimated relationships in labor economics. There are several reasons for its fame. The most important one is possibly the practical use of results from human-capital theory to derive an estimating wage equation (Bjorklund & Kjellstrom, 2002).
This investment is surely related with the income level of the individual or household. Moreover; urbanization and demographic structure also has influence on the decision process of education investments. Return of the human capital investment is higher in urban than rural. Thus, people that live in the cities invest more on human capital. Demographic transition can reveal itself as decline in infant mortality rate and having longer and healthier life. This makes human capital investments more attractive because people can get the return of their human capital investments for longer periods. Families started to invest on their children (by education, health...etc.) more. However, since they have limited budget; they hesitate to bear more children. Therefore, birth rates dropped which means substitution of quality for quantity of children. This made it possible to invest more on children (Mincer, 1996).
As stated above demographic structure and urbanization caused individuals’ invest in human capital in different amounts. Also average life expectancy is increasing in Turkey. According to World Bank data, life expectancy was 66 years on average in 1994 and it increased to 75 by 2012. This difference means that individuals as investors will enjoy that return nine more years which makes human capital investments more profitable and
11
appealing. Hence it is expected to see an increase in human capital investment in Turkey. However, even individuals with similar environments might invest diverse amounts on human capital. Growing market makes individuals more skilled. This is caused not only by practice but also because of division of labor (Becker, 1962). Again according to World Bank data, Turkey’s GDP in 1994 was around 130 Billion $ and it increased to 820 Billion $ in 2013. At this point, Turkish economy is expecting more skilled employees in order to keep growing.
In literature, education’s return is calculated with two common methods. First one is
full/elaborate type which is used by T.W. Schultz and G. Becker. In this method; cost and
earning distribution is determined based on age and education level. Second method is
basic earnings function method which is used by J. Mincer. This method studies the
contribution of additional each annual education to the personal income (Yumuşak, 2003, p.5).
12
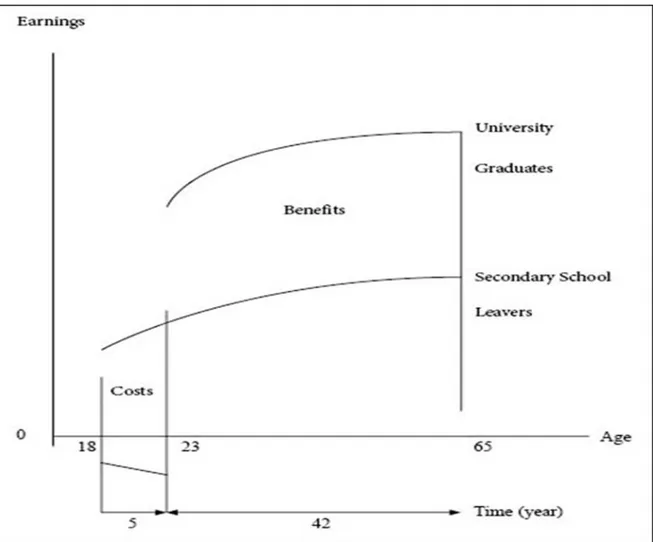
Figure 2-Stylized Age-earnings Profiles
(Psacharopoulos, 1995, p.3)
The cost/benefit trade-off can be depicted in another diagram, showing the income trends through ages. As seen in the diagram, a university graduate start to make money at the age of 23, while a high school graduate can start earning as early as 18. Although there is an advantage of summing up the earnings 5 years longer for a high school graduate, a university graduate will compensate that gap rapidly due to wage structure and human capital investment. Here, human capital investment consists of 5 years foregone earnings and educational equipment costs (Psacharopoulos, 1995).
Besides, studies show that age earnings profiles are likely to be steeper among more skilled and educated persons (Becker, 1962).
13
Here, Psacharopoulos (1994) points out another important issue which is the quality rather quantity of education. That is a vital factor of return to education. For instance, when student size drops to 25 from 30 per classroom, it is found that it leads to a 0.4 percent increase in the returns to education.
Return is affected by family status and health of individual as well. Better family status and better health conditions results better education performance (Psacharopoulos, 1994).
Schooling ratio has an influence on income and unemployment. Educational attainment and unemployment is inversely proportional. It is already discussed that human capital investments are likely to increase expected earnings. When earnings are increased, individual’s opportunity cost of leisure time increases. Hence, individual’s choices will change and his/her working hours will rise. There is a positive relation between working hours and education due to wage rates. It is pointed out that education increases earnings by two factors: increased wage rates and high working hours. Schooling reduces the unemployed periods while experience reduces already unemployed individual’s unemployed duration. Indeed, it does not mean that education level decreases the aggregated unemployment. It only redistributes the vacant employment positions among individuals (Ashenfelter & Ham, 1979).
2.1.2 Training
According to Mincer (1997), Yoram's model addresses differences across periods of life cycle. Among his several suggestions for interpersonal variations in human capital investments, 4 of them are listed below:
Individuals with more schooling keen to invest in more on job training.
Training will likely to re-occur in individual’s life cycle if he/she is heavily involved in the first one.
14
If the cost-effectiveness of schooling and job training increases, demand of human capital will rise in the short run. Eventually, rates of schooling and job training will increase. (Mincer, 1997)
As it is known, human labor force is a factor of production. Therefore, it has to be improved along with the real capital. Otherwise, the gain will not be as much as desired. Technological improvements cannot be a solution to bypass the bottle-neck of a production line, unless professionally handled by educated labor force. Therefore, human capital investment and improvement is one and only vital to effectively utilize real capital.
Investments usually produce assets which will eventually makes individuals live better off. Hence, they would like to optimize their investments due to limited budget. Similarly, training investment would have a return of "price change" which will allow them to sell their labor force with a higher price. Moreover, the added value of their time will force them to work more than uneducated work force due to higher opportunity cost of leisure time. Individuals, intuitively, expect to have a higher profit increase compared to their human capital investments after the price change. That change will affect all of their consumer behaviors as well. This altered consumption style will force them to spend more time working. Thus, increase of income is not only by the wage price but also longer working time (Lindsay, 1971)
It is observed that formal education is not sufficient enough for a successful job performance. On the other hand, if on-the-job training behaviors are studied carefully; the formal education can be treated as a preparation step to real on-the-job training which is going to increase the occupational skills of the workers. This training has different types most of which are related to experience. Some believe that formal school and on-the-job training are not complementary to each other. They are rather alternative to each other. According to them, school duration has to be shortened and on-the-job training has to be extended for a better occupational performance (Mincer, 1962)
Some individuals improve their efficiency by attaining new skills while others bring their skills to perfection. On-the-job training is different than formal school education due to
15
the fact that its aim is to improve efficiency. There is an opportunity cost involved in this type of education since they choose to be educated instead of producing. Besides, there might be equipment cost added. The duration of on-the-job training will change based on the job. If the job would not have lasted long, this training would have been pointless because it aims for improving the future productivity. Firms find this type of training investments beneficial because of expected increase of earnings or lessened expenditures over time.
On-the-job training is known to have two types: Specific on-the-job training and General on-the-job training. General training is not only useful for that particular firm providing the training but in any other firm as well. If the employee chooses to resign and choose another employer, training provider will lose that investment while the employee and new company will still benefit. Then, what is the motivation of the company behind this decision of providing training? The company would choose to provide the training if and only if the employee funds this general on-the-job training. Individuals are willing to fund it because they believe that their wage will be increased accordingly whether or not they keep working for the same employer. In other words, their salaries will be below the opportunity marginal product by the cost of education (Becker, 1962)
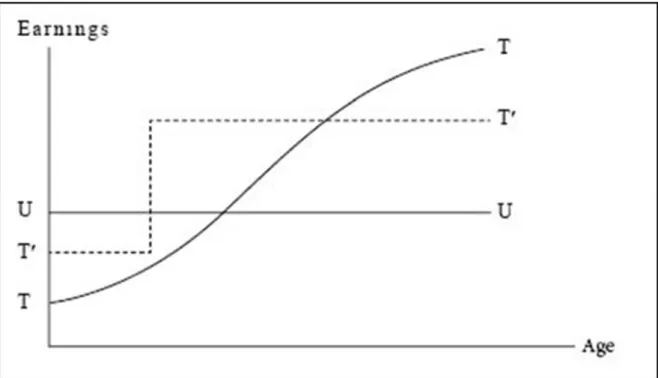
Becker (1962, p.15) pointed out the mechanism and the contribution of training over income in the figure below. As it is depicted by TT, age earnings curve of trained persons is steeper than that of untrained persons, shown by UU line. However, the difference between these two lines has a lot to do with the cost of training, ages of persons, etc… In an extreme case scenario, when an extreme concavity appears like T’T’; the income will be boosted immediately as soon as training period is over, in less extreme cases the principle would be the same and the concavity more continuous.
16
Figure 3- Mechanism and the contribution of training over income
(Becker, 1962, p.15)
2.2 Gender
Most of the models that explain the determinants of wage employ gender and age in the first place. In context there are several studies analyzing the gender effect on wage. In current economic system, high real wages trigger the growth of female labor force due to the opportunity cost of unemployment. Therefore, women tend to spend less time for household duties and spend more on their paid jobs (Mincer, 1996). This trend has a side effect which leads to drop of birth-rate in order to avoid additional household duties. Life expectancy and living standards of women tend to increase with elevated annual working hours. Thus, expected return of human capital investments such as education and on-the-job training increases (Mincer, 1996).
Although there are some measures taken to diminish the wage gap between males and females, there is a huge wage gap at the industry level between genders. Besides, female employees (especially part time workers) concentrate in the low-wage industries compared to males. At this point, those actions that are expected to close the wage gap do not solve
17
the problem and significant wage gap between males and females across industries is still a fact (Caju, Lamo, Poelhekke, Katay, & Nicolitsas, 2010).
It is also observed that education, training and experience variables contribute much more to an income of a woman than man in private sector. Therefore, it is crucial to educate women and keep track of female schooling in order to make sure that they have higher income and better status. Moreover, governments should apply policies to punish if they fail to send their daughters to school (Çelik & Selim, 2014).
Akhmedjonov and Izgi (2012) point out a similar fact with a little difference. According to their study, return of education is more profitable for women in public and private sectors. Women with an undergraduate education have a higher return than men.
As it can be deducted from the studies mentioned above, private sector appreciates more when it comes to more educated and experienced workers. On the other hand female are better off if they work in public sector for lower deciles where the public sector is more “fair employer” (Lucifora & Meurs, 2004)
2.3 Age
As it is described above, education expenses show the characteristics of an investment. When an individual invest on personal improvement, he/she gives up the present income and opportunity cost of his time. On the other hand, that low income level replaces with a higher one in the close future when the investment starts to pay off. The reason why young individuals tend to invest more on human capital is that they can “harvest” longer periods (Porath, 1967).That is why it is more logical to get educated/trained as early as possible. Otherwise, the return of the investment will be lower due to shortened career left. In addition, the opportunity cost of the time spent on education/training will be much more. By its nature, wage profile is upward at a decreasing rate. Wage rise is also related to life cycle and mobility of individuals. Furthermore, wage increase slows down by age due limits of human capacity and mobility decrease as people get older (Mincer, 1997)
18
According to Jovanovic and Lokshin (2004), private sector employees have higher income averages for all ages considering any particular education level.
2.4 Marital Status
Marital status is also another factor that affects income levels. Although there are several studies measuring the impact of age and education, marital status studies are limited comparatively. Toutkoushian's (1998, p.526) study reveals that single men earn between 4% and 9% less than married men. One of the reasons could be revealed by a study conducted by Çelik and Selim (2014); that married men have more extra working hours and weekend shifts in order to keep up with the needs of the family and increase their household income. The same fact is emphasized in another study showing that having a child triggers higher work effort and men’s productivity increase in order to have a well ordered life style (Petersen, Penner, & Hogsnes, 2011). Nonetheless, marital status has limited effect on female groups according to the study. Namely, married women earn only about 4% more than single women (Toutkoushian, 1998, p.521).
There are notable differences in wage gap among different races and ethnic group. Therefore income differentials change across these groups as well. Considering the marital status, there is a higher income level for married men than single men. Contrary, studies do not testify the same fact for married women's salary premiums (Toutkoushian, 1998).
2.5 Industry Types
Although marital status has different effects on males and females, studies show that industry wage differentials are no different for both genders. There is a large variation between industry types and expected incomes. In other words, there is an irrefutable correlation between industry types and average income for both genders (Thaler, 1989). To illustrate, there is a tendency to migrate from rural areas to city centers for a higher income expectations. Agriculture sector is not as fruitful as of those service sectors of the urban regions. Since each industry requires different education level and human capital
19
investment, it makes sense to have varying average incomes. For instance, technology-involved sectors such as IT, would require a solid background on communication and computer technologies, therefore the employees would expect to earn more.
The same fact holds true for Eastern and Western European Countries. Among the sectors, computer industries, financial, chemical and energy sectors are the highest paying industries in the hierarchy. Contrary, traditional sector wages such as textile, clothing and leather industry, wood and cork industry, retailing, hotels and restaurants are in the lowest decile (Magda, Rycx, Tojerow, & Valsamis, 2011). In another study on EU states, inter-industry wage differentials are found to be significant. (Caju, Lamo, Poelhekke, Katay, & Nicolitsas, 2010).
2.6 Occupation Types
Although most individuals would love to get the highest hierarchical level in an institution, what they end up with is the position that their potential would allow. The occupation type is a combined result of individuals experience, training, education, gender, etc… Therefore its impact on income level is stronger than other variables that are subjects of this study. In other words, each individual will get a position in the hierarchical ladder based on their education level, training and experience. People with different education levels and training will be likely to choose or likely to be chosen for different positions (Mincer, 1958).
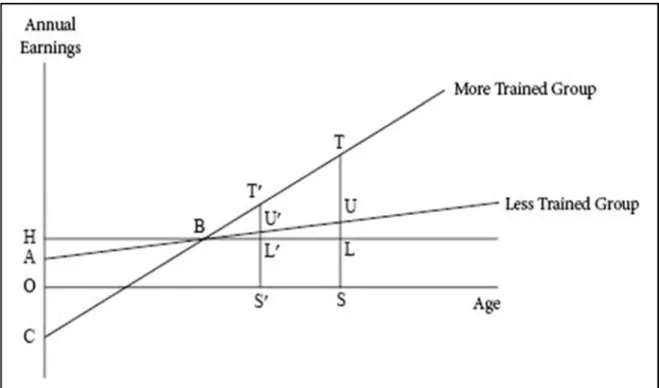
Although occupation types are mentioned to be a function of training and education, these factors do not give identical results for all the sectors. To illustrate; if annual earnings/age graphs are considered, some sectors have steeper lines compared to others. That implies higher return of training and education over years via higher occupational positions. In other words, the higher education investments, higher expected earnings and steeper the life path of earnings (Mincer, 1958). Figure below reflects the relationship between annual earnings and age for differently trained groups. Less trained groups have more flat relationship compared to more trained group with steeper slope. More trained group has a
20
greater initial investment on training and starts with level C whereas less trained group starts at level A. Over years, more trained group’s annual earnings surpasses less trained group at point B and annual earning gap keeps increasing rapidly. Since the slopes are different, the earnings gap will result in higher income disparities for higher ages. At point B it is in its minimum value.
Figure 4- Relationship between annual earnings and age for differently trained groups
(Mincer, 1958, p.289)
On the other hand, intra-occupational differentials are a function of age only. Among highly trained groups, annual income difference will be much more for chosen two ages compared to less trained groups. It is also a result of that steeper slope of annual earnings for highly trained group. It should also be kept in mind that it is almost impossible to move from one group to another after the training period is over due to several reasons including the opportunity cost of starting over again (Mincer, 1958).
21 2.7 Experience
As mentioned above, The Mincer equation, which relates the logarithm of hourly earnings to years of schooling, years of work experience and years of work experience squared, is one of the most commonly estimated relationships in labor economics (Bjorklund & Kjellstrom, 2002).
A farmer has to tolerate to earn less than other employees of the same age and gender if he decides to give up farming and work for that employer. It is mainly because of the educational and training backgrounds, human capital investments in short. Schooling, health condition, skills and ability has control over income. Therefore, younger generations have comparative advantage over older generations due to average education duration (Schultz, 1961)
Education and experience is occupied to explain the determinants of individual earnings. It is obvious that earnings increase with experience but its mechanism is not that obvious. According to Duncan & Hoffman (1979) the most commonly accepted explanation of the relationship between income and experience is that of the human capital model, which considers years of job experience as a proxy for unobservable investment in on-the-job training.
Ilkkaracan and Selim (2007) stated that work experience is the most important determinant of the wage gap and relatively the most important factor among all factors. Besides, that statement is pointed out by Akhmedjonov and Izgi (2012) in another article which shows that experience have a positive effect on wage for both public and private sectors. However, experience pays more for private sector than public as mentioned earlier.
2.8 Organization Type (Public/Private Sector)
Turkey has a relatively bigger public sector which forms a huge chunk of the employees market. There are lots of studies that try to outline the effectiveness of this sector, but there are not many of those studies to show the income disparities compared to private
22
sector. In this study, public/private sector comparison is also one of the subjects of the research. Moreover, worker characteristics and choice aspect of the sector selection is going to be discussed (Tansel, 2005).
It is mandatory to analyze the job market of the public sector in order to understand the characteristics of aggregate labor market due to the size of public sector. Public sector workers’ wages has the biggest share in the government budget. Therefore, that is also the first item to be revised during the crisis period. It has important differences, compared to public sector; such as its control mechanisms, nature of output, etc… On the other hand, private sector is profit oriented that moves with the market mechanism. While private sector wages settle down on a demand curve at some point, public sector could be anywhere around that curve. It may be higher, lower or the same as the private sector wages. Normally, public sector also has a principle of minimizing the cost. However, sometimes, government’s employment and distributional goals may necessitate the expansion of public employment beyond efficient levels. Hence, it is not always wise to expect the same criteria for both public and private sectors. The wages in public sector is being determined by non-market processes and increase with education level, experience, etc… There is a certain increase for the following years as well. It is relatively harder to get fired compared to private sector (Tansel, 2005).
According to study conducted by Tansel (2005), public sector wages are higher than private sector. Moreover, gender wage gap is lower in public sector due to wage determination characteristics mentioned above.
Jovanovic and Lokshin’s (2004) study compares public and private sector wages with statistics of Moscow by Russian Labor Force Survey. According to the results, there is a significant difference between public and private sector wages. The gap is around 14% for men and 18% for women. In addition, men earn 24% more than women in private sector. In contrast to the findings of other scholars, Jovanovic and Lokshin (2004), states that gender wage gap is higher than private sector with 33% difference between men and women. Although it is expected to earn more over years, that holds true for only public
23
sector. Women have no return to tenure in private sector. Only men’s wage increase over years in private sector.
When Turkey’s job market is considered, both genders get higher returns of education in private sector than public. For both sectors, female workers get higher returns of education investment than men. Similar to findings above, public sector returns of experience and education are lower than private sector which leads to a cluster of skilled labor force in public sector. Therefore non-skilled workers tend to group in public sector (Akhmedjonov & Izgi, 2012)
This tendency can be seen in the graph below. Low skilled/Low Pay Jobs are better off in public sector with higher hourly wages. On the other hand, high skilled/high pay jobs have higher wage in private sector. Public sector fails to attract, hold and motivate high skilled workers (Lucifora & Meurs, 2004).
Figure 5-Pay profiles by skill: Public and private sector (Lucifora & Meurs, 2004, p.6)
24 2.9 Unionization
The nature of unionization requires defending of its members interests such as monetary benefits. Therefore its members tend to earn more than non-unionized employees and stay above the poverty line. (Çankal & Sekmen, 2008)
Unionization effect on wage tends to be lower on educated work force. It can be deducted from this fact that union differentials used to be higher in the past due to the portion of less-educated employees. Nowadays that differential is declining. (Blackburn, 2008). Moreover, the trend of declining unionization differentials will eventually lead to a further fall due to the weakened bargaining power of unions. Besides, union wage may show changes according to some variables such as gender, education and industry. (Blackburn, 2008).
25
3. DESCRIPTION OF VARIABLES AND DATA
In this section, variables and the data will be described. The data was generated by TURKSTAT (Turkish Statistical Institute).
3.1 Introduction
TURKSTAT is the official government agency that produces statistical data in Turkey. Among several data that they collect, the Institute administers Household Budget Survey each year. In this study, 2011 survey results were used. Although 2012 was available at the time, there were several missing variables that intended to be utilized in the model such as public/private sector differentiation and unionization.
According to TURKSTAT, the estimation level of 2011 Household Budget Survey covers whole Turkey. It’s not possible to make estimations on regional basis by using this particular data because of sampling design of the survey.
Micro data set of 2011 Household Budget Survey was applied on 1,104 sample households. The number of households was increased every month to a total of 13,248 sample households in a year between 1 January – 31 December 2011 (the effective sample size was 9,918 households and 37,121 individuals).
In this study, the definition of income has a major role throughout the analysis. Therefore, the safest way to surpass any possible confusion, the official income definition of TURKSTAT was considered to be valid. TURKSTAT’s statistics manual states that
… income is the total value of goods and services produced in a specified period of time, usually in one year, in a national economy. This is called national income or total output. As for a household or an individual, income can be defined as total of the sums earned in return of the contributions made to productions in a specified period of time. Income of a household may be as wage or salary, land rent (rent), capital income (interest) or entrepreneurial income (profit).
26
In this study, Mincerian Wage Model will be employed with a couple of adjustments. For instance, three different income types will be analyzed. Besides, the basic model consists of the natural logarithm of earnings as dependent variable where education, experience and experience-squared are the explanatory variables.
ln ln
(Mincer, 1974) Variable ln represents the log of expected earnings of individuals whereas ln reflects the level of earnings of individuals with no education and experience). The model is enhanced by several socio-economic factors that may determine the expected income of an individual. These variables will be introduced below.
3.2 Description of Variables
In this section, explanatory and dependent variables are defined and described below. Dedicated notation for each variable is also shown.
3.2.1 Explanatory variables
Gender
MALE: 1 for males and 0 for females
Age
AGE: Completed age of individual AGESQ: Square of age
27
Education Levels
EDU1: Illiterate
EDU2: Literate – not completed a school or graduated from Primary school or graduated from Primary education
EDU3: Secondary School Graduates
EDU4: Junior Vocational High School Graduates EDU5: High School Graduates
EDU6: Senior Vocational High School Graduates EDU7: 2-3 year-College Graduates
EDU8: 4-year-College or University Graduates EDU9: Post Graduate/PhD.
Marital Status
MAR: Married
Industry Types
IND1: Agriculture, forestry, fishery IND2: Mining and quarry
IND3: Manufacturing Industry IND4: Electricity, gas and water
28 IND5: Construction and public works
IND6: Wholesale and retail business, motor vehicles, repair of motorcycles, appliances
IND7: Hotel and restaurants
IND8: Transportation and storage services IND9: Information and Communication IND10: Financial brokerage services
IND11: Real estate agency, rentals and business activities
IND12: Public management and defense, mandatory social security IND13: Administrative and support service activities
IND14: Public administration and defense, compulsory social security IND15: Education
IND16: Human health and social work activities IND17: Arts, entertainment and recreation
IND18: Other social, community and personal service activities
Occupation Types
OCU1: Legislators and senior officials OCU2: Professionals
OCU3: Associate professionals
29 OCU5: Service and sales workers
OCU6: Skilled agricultural, animal producers, forestry and fishery workers OCU7: Craft and related trades workers
OCU8: Plant and machine operators and assemblers OCU9: Unskilled labor
Experience
EXP: Number of years of employment. If duration of employment is less than half a year (6 months) the variable is taken as “0”.
EXPSQ: Square of EXP
Annual Working Hours
AWHR: Annual total working hours
Organization Type (Public/Private Sector)
PUB: 1 for Public institutions and 0 (zero) for private institutions
Unionization
30 3.2.2 Dependent Variables
Labor Income (Variable LINC)
LINC: According to TURKSTAT, this income includes considerations paid to persons as wage, salary or daily-fee, excludes pension, social insurance contributions and taxes, and is the net income that that person earns in a year. The sum of income earned as bonus that is paid during certain periods of the year (3 months, 6 months, etc.) and the other income such as premium, gratuities, Christmas or holiday pay to the regular or casual employees are covered. Tips and premiums paid to motivate the employers and to increase sales, and education allowances paid to teachers once in a year are covered with this variable. Received premium and incomes earned from additional duties and such income components as expertise charges, consultancy fees, tips and service charges are not included in salary, wage and daily-fee incomes and these components are covered under this variable.
Labor Income with In-Kind Income (Variable LINC_IK)
LINC_IK: This variable is the annual sum of labor income and total in-kind income components received by an individual as an employee. Goods and services (discount in transportation, mass transportation, utility bills, and in travel services, dinner, kinder garden fees, cloth, food, drinks etc.) received by a household individual in the last 12 months is included in income in-kind.
Total Income (Variable TOTAL_INC)
TOTAL_INC: Annual sum of all types of incomes such as wage, investment income, government transfers, veteran pension and disability pay and sickness benefits, widow pension, orphan pension, interest on bank deposits, real estate (rental) income etc...
31 3.3 SUMMARY STATISTICS
TURKSTAT’s micro-data set of 2011 Household Budget Survey (conducted on 1,104 sample households) was utilized in this research study. The total number of households is 13,248 sample households in a year between 1 January – 31 December 2011 (the effective sample size was 9,918 households and 37,121 individuals).
3.3.1 Gender
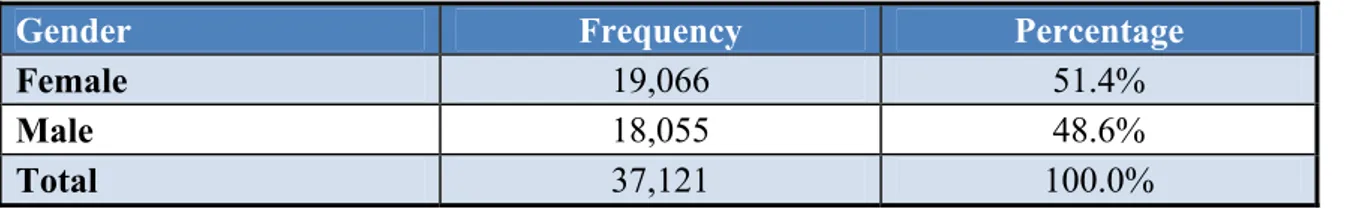
37,121 individuals are included in the survey. 51.4% are female and 48.6% are male. Table 3-Gender Distribution of the Sample
Gender Frequency Percentage
Female 19,066 51.4%
Male 18,055 48.6%
Total 37,121 100.0%
In the survey 19,066 female and 18,055 male participated. This ratio is a good reflection of the actual gender ratio of Turkish population.
Figure 6-Gender Distribution of the Sample
19,066 51% 18,055
49%
Gender Distribution of the Sample
Female Male
32 3.3.2 Age
The age distribution of the individuals in the survey is as follows: 27% of the individuals are below age of 15; 15.4% of sample is between ages of 15-24; 15.7% of sample is between 25-34; 14.3% of sample is between 35-44; 12.1% of sample is between 45-54; 7.9% are at age 55-64; and 7.6% of sample is 65 and above respectively.
Table 4-Age Distribution of Sample
Age Interval Total Male Female Percent
Below 15 10,036 4,983 5,053 27.0% 15-24 5,724 2,730 2,994 15.4% 25-34 5,827 2,757 3,070 15.7% 35-44 5,294 2,622 2,672 14.3% 45-54 4,499 2,224 2,275 12.1% 55-64 2,933 1,454 1,479 7.9% 65 and above 2,808 1,285 1,523 7.6% Total 37,121 18,055 19,066 100.0%
In the survey, 10,036 individuals are below 15 years of age; 5,724 individuals are between ages of 15-24; 5,827 individuals are between ages of 25-34; 5,294 individuals are between ages of 35-44; 4,499 individuals are between ages of 45-54; 2,933 individuals are between ages of 55-64 and 2,808 individuals are above age of 65 respectively. (Below 15 individuals are almost twice as much as the closest group).
33 Figure 7- Age Distribution of the Sample
3.3.3 Marital Status
Non-married portion of the sample is 17.9% of the total; 49.7% are married; 4.0% are widowed; 1.4% are divorced and 27.0% are younger than 15.
Table 5-Marital Status
Marital Status Frequency Percent
Never Married 6,653 17.9%
Married 18,432 49.7%
Widowed 1,470 4.0%
Divorced 530 1.4%
Younger than 15 years of age 10,036 27.0%
Total 37,121 100.0% 10,036 5,724 5,827 5,294 4,499 2,933 2,808 0 2,000 4,000 6,000 8,000 10,000 12,000 Below 15 15-24 25-34 35-44 45-54 55-64 65 and above Total Male Female
34
In the survey 6,653 individuals are never married; 18,432 individuals are married; 1,470 individuals are widowed; 530 individuals are divorced and 10,036 individuals are younger than 15.
Figure 8- Marital Status Frequency
In the survey excluding the individuals younger than 15, 18,432 individuals are married and 8,653 individuals are non-married.
Table 6- Marital Status Groups
Marital Status Frequency
Married 18,432 Non-Married 8,653 6,653 18,432 1,470 530 10,036
Never Married Married Widowed Divorced Younger Than 15 0 2,000 4,000 6,000 8,000 10,000 12,000 14,000 16,000 18,000 20,000
Marital Status Frequency*
35
In the survey excluding the individuals younger than 15, 68% of the individuals are married and 32% non-married.
Figure 9-Grouped Marital Status
18,432 68% 8,653
32%
Marital Status of 15 years and older
Married Non-Married
36 3.3.4 Education
In the survey 9.49% of the individuals are Illiterate (EDU1) consisting of 3,522 persons (738 male and 2,755 female), 55.94% are Literate-Graduate of Primary education at max (EDU2) consisting of 20,766 persons (10,065 male and 10,701 female); 4.69% are Secondary School Graduates (EDU3) consisting of 1,742 persons (1,128 male and 614 female); 0.11% are Junior Vocational High School Graduates (EDU4) consisting of 41 persons (25 male and 16 female); 7.35% are High School Graduates (EDU5) consisting of 2,406 persons (1,525 male and 1,204 female); 5.30% are Senior Vocational High School Graduates (EDU6) consisting of 1,967 persons (1,198 male and 769 female); 2.69% are 2-3 year-College Graduates (EDU7) consisting of 998 persons (574 male and 424 female); 4.27% are 4-year-College or University Graduates (EDU8) consisting of 1,584 persons (916 male and 668 female); 0.55% are Post Graduate/PhD (EDU9) consisting of 204 persons (123 male and 81 female) and 9.61% are below 6 years old consisting of 3,568 persons (1,763 male and 1,805 female).
Table 7- Education Levels of the Sample
Edu. Level Total Male Female Percent Variable Explanation
EDU1 3,522 738 2,784 9.49% Illiterate
EDU2 20,766 10,065 10,701 55.94% Literate – Graduate of Primary education at max EDU3 1,742 1,128 614 4.69% Secondary School Graduates EDU4 41 25 16 0.11% Junior Vocational High School Graduates EDU5 2,729 1,525 1,204 7.35% High School Graduates EDU6 1,967 1,198 769 5.30% Senior Vocational High School Graduates EDU7 998 574 424 2.69% 2-3 year-College Graduates EDU8 1,584 916 668 4.27% 4-year-College or University Graduates
EDU9 204 123 81 0.55% Post Graduate/PhD.
N/A 3,568 1,763 1,805 9.61% Below 6 years old
37
EDU2 (Literate – not completed a school or graduated from Primary school or graduated from Primary education) is the most dominant group with more than twenty thousand individuals whereas EDU4 (Junior Vocational High School Graduates) is the least represented group with only 41 individuals. Although most of the education groups have nearly equal gender distribution, when illiterate ones are considered, EDU1 (Illiterate) has more than 2,700 women participants which are approximately 4 times as much as male individuals.
Figure 10- Education Levels 3,522 20,766 1,742 41 2,729 1,967 998 1,584 204 0 5,000 10,000 15,000 20,000 25,000
EDU1 EDU2 EDU3 EDU4 EDU5 EDU6 EDU7 EDU8 EDU9 Total Male Female
38 3.3.5 Industry Types
In the survey 25.4% of the individuals are working in agriculture, forestry, fishery industry (IND1) consisting of 3,301 persons (1,650 male and 1,651 female); 0.5% are working in mining and quarry industry (IND2) consisting of 64 persons (59 male and 5 female); 16.4% are working in manufacturing industry (IND3) consisting of 2,139 persons (1,565 male and 574 female); 0.8% are working in electricity, gas and water industry (IND4) consisting of 105 persons (100 male and 5 female); 7.6% are working in construction and public works industry (IND5) consisting of 991 persons (964 male and 27 female); 14.4% are working in wholesale and retail business, motor vehicles, repair of motorcycles, personal and house appliances industry (IND6) consisting of 1,871 persons (1,471 male and 400 female); 4.9% are working in hotel and restaurants industry (IND7) consisting of 640 persons (603 male and 37 female); 4.8% are working in transportation and storage services industry (IND8) consisting of 624 persons (492 male and 132 female) and 1.0% are working in information and communication industry (IND9) consisting of 125 persons (96 male and 29 female); 0.9% are working in financial brokerage services industry (IND10) consisting of 123 persons (78 male and 45 female); 0.7% are working in real estate agency, rentals and business activities industry (IND11) consisting of 88 persons (75 male and 13 female); 1.9% are working in the public management and defense, mandatory social security industry (IND12) consisting of 248 persons (170 male and 78 female); 3.2% are working in administrative and support service activities industry (IND13) consisting of 416 persons consisting of (281 male and 135 female); 5.3% are working in public administration and defense, compulsory social security industry (IND14) consisting of 693 persons (598 male and 95 female); 4.9% are working in education industry (IND15) consisting of 642 (324 male and 318 female); 2.6% are working in human health and social work activities industry (IND16) consisting of 336 (141 male and 195 female); 0.4% are working in arts, entertainment and recreation industry (IND17) consisting of 336 persons (141 male and 195 female); 4.3% are working in other social, community and personal service activities industry (IND18) consisting of 560 persons (263 male and 297 female). In total 13 021 individuals are working within below listed industry types.
39 Table 8-Industry Types of the Sample
Industry
Type Total Percent Male Female Explanation of the Variables IND1 3,301 25.4% 1,650 1,651 Agriculture, forestry, fishery
IND2 64 0.5% 59 5 Mining and quarry
IND3 2,139 16.4% 1,565 574 Manufacturing Industry IND4 105 0.8% 100 5 Electricity, gas and water IND5 991 7.6% 964 27 Construction and public works
IND6 1,871 14.4% 1471 400
Wholesale and retail business, motor vehicles, repair of motorcycles, personal and house appliances
IND7 640 4.9% 603 37 Hotel and restaurants
IND8 624 4.8% 492 132 Transportation and storage services IND9 125 1.0% 96 29 Information and Communication IND10 123 0.9% 78 45 Financial brokerage services
IND11 88 0.7% 75 13 Real estate agency, rentals and business activities IND12 248 1.9% 170 78 Public management and defense, mandatory social security IND13 416 3.2% 281 135 Administrative and support service activities IND14 693 5.3% 598 95 Public administration and defense, compulsory social security IND15 642 4.9% 324 318 Education
IND16 336 2.6% 141 195 Human health and social work activities IND17 55 0.4% 41 14 Arts, entertainment and recreation IND18 560 4.3% 263 297 Other social, community and personal service activities TOTAL 13,021 100.0% 8,971 4,050
40
The most frequent 3 industries; IND1 (Agriculture, forestry, fishery), IND3 (Manufacturing Industry) and IND6 (Wholesale and retail business, motor vehicles, repair of motorcycles, appliances) add up to 56% of the total individuals represented in this study although there are 18 industry groups defined. On the other hand least populated industries are: IND17 (Arts, entertainment and recreation), IND2 (Mining and quarry), IND11 (Real estate agency, rentals and business activities) which have less than 100 participants.
Figure 11- Industry Types 3,301 64 2,139 105 991 1,871 640 624 125 123 88 248 416 693 642 336 55 560 0 500 1,000 1,500 2,000 2,500 3,000 3,500 Total Male Female