EVAlUATING AND COMPARING THE PROCESS OF
DEVELOPMENT IN EGYPT AND TURKEY
Yrd, Doç, Dr, Kemal Baş
Mersin Üniversitesı iktisadi ve idari Bilimler Fakültesi
•
• •
Mısır ve Türkiye'de Kalınnma Sürecinin Karşılıklı Olarak
Değerlendirilmesi
Özet
Bu çal11mada Mısır ve Türkiye'nın kalkıııma süreçleri karşıla1tırılarak de~erlendirılmektedir. BırleşnH1 Milletlerırı Insani Gelışme Erıdeksi dahilolmak üzere, kalkınmanın çeşitli boyutları göz önurıde bulundunılmuştur. Bu urısurlar: do~uşta yaşam beklentisi. yeti1kin okur-yazarlığı. gelir ve yoksulluk. gelir dağılımındaki eşitsızlık ilc emeğin ve toprağın verimliliğidır.13u unsurlar 1')(i()'lı yıllardan itibaren gürıümüze kadar değcrlendırılmi1 ve iki ülkenin ne oranda başarılı oldukları karşılaştırılarak belirtilmiştir. Yakın geçmişteki tecriibe, Tlırkıye'nın doğuşta yaşam beklentısi ve yetişkin okur-yazarlığı hususunda Mısır'a göre daha başarılı oldugunu göstermektedir. Yoksulluğun çe1ııli iilçünılerı. hu konuda iki ülkenin de aşağı yukarı aynı konumda olduklanııı göstermekıedır. Ancak, uluslararası karşilaştırmalar. Mısır'da yoksulluğun Türkıye'dekınden daha fazla olduğurıu göstermektedır. Türkıye'de gelir dağılımmdaki eşitsizliğııı Mısır'dakine göre dalıa fazla olduğu gÖrL,lnıektedir. Toprak verimliliğı hususuııda, yakın geçmişte yapılan çeşıtlı ölçiimler Mısır'ın Türkiye'ye kıyasla daha başarılı olduğunu göstermektedir. Yakın geçmişte. endüstrıde emeğın verımliliğınin de Mısır'da Türkiye'ye göre daha yüksek olduğu giirlllmektedil'.
Anahtar Kelimeler: Kalkınma süreci, yoksulluk, yaşam beklentisı, okur-yazarlik, üretkenlik.
Abstract
This artil'le evaluates and compares the process of development in Egypt and Turkey. Various dimensions of development are considered including the ones deelared by the /Iuman Development Index of the United Nations. These dımensions are lıfe expectancy at hirth, adult literaey, income and poverty, ınequality in ıncome dlStrıbution and productıvity of lahor and larıd. The achıevements of the two eountries, Egypt and Turkey, ın eaclı of ılıesc dımenSlons are evaluated sınce the i')60s to tlıe present and compared lo eaclı other. The reeent experience ındicates [hat Turkey perfarmed betler than Egypt in terms of life expectancy al binh and adult Iiteracy The various measures of po\'eny indicated ıhat the !evel of "overt)' is ahout the same in the ıwo counırıcs. !-Inwcv"r, thc interııational comparıson ındicated a higher !evel of poverty in Egypt ıhan in Turkcy. Incoıııe distrihution is nıare unequal in Turkey than in Egypt. Vari"us measures of producııvity of land ındıcated higher levels arc aehieved recenıll' in Egypı than in rurkey. Reeeııt Iabor producti\'it)' in industry was alsa higher in Egl'pı than in Turkey.
2
eAnkara Unıversılesi SBF Dergısı e59-4Evaluating and Comparing the Process of
Development
in
Egypt and Turkey
1. Introduction
The concept of "Development" has different meanings in different economİc, social and eultural conditions. People of developing countries associate this term with a rise in income whereas the people of developed countries consider it as a rise in general standards of !iving. Therefore, the concept of development is rather difficult to define. In general terms it may me an heing able to reach a high level of economic, social and cultural values. Many economists assume that development of a country involves not only inereasing incomes but also improving health and nutrition of the population, improving access to education, inereasing quality of resources, improving the equality in distribution of resourees, reducing poverty, and improving human rights. The United Nations Development Program developed the concept of Human Development Index (HDl). According to the HDl, "Buman development is a process of enlarging people's choices. In principle, these choices can be infinite and change over time. But, at all levels of development, the three essential ones are for people to lead a long and healthy life, to acguire knowledge and to have access to resources needed for adecent standard of !iving."
In arecent study Adams (2000) compares Egypfs developmental record with that of forty other developing countries. He uses the three dimensions of development deelared by the HDl, as in the above quotation. He -further includes a measure of the degree of inequality in access to resources and productivity of land and labor. The dimensions of development that are considered in this artiele are the same as the ones in Adams' artiele. Many developing countries ineluding Egypt and Turkey report measurable data on all dimensions of the development considercd.
Kemal Baş _ EvalLJating and Comparıng the Process of Development in Egypt and Turkey _
3
This article assesses and compares the development process in Egypt and Turkey. The various dimensions of development that are eonsidered include life expectaney at birth, adult literacy, income and poveı1y. inequality in income distribution and produetivity of labor and land. The aehievements of the two eountries Egypt and Turkey, in eaeh of the se dimensions are evaluated sinee the 1960s to the present and compared to each other. The comparison of the development process in Egypt and Turkey !ed to mixed results. The experiences in the Iate 1990s indieate that the life expeetancy at birth and adult literaey rates are higher in Turkey than in Egypt. Various measures of poverty indieated that the level of poverty is about the same in the two eountries. However, the international comparison indieated a higher level of poverty in Egypt than in Turkey. Income distribution is more unequal in Turkey than in Egypt. Reeently, higher levels of land produetivity were achieved in Egypt than in Turkey by various measures. Recent tabor produetivity was also higher in Egypt than in Turkey.
This paper proeeeds as follows. Seetions 2 and 3 evaluate and compare the recent development records of Egypt and Turkey in terms of life expeetaney at birth and adult liıeraey rates respeetively. Section 4 examines the development s in poverty in the two countries. Section 5 evaluates the income distribution in Egypt and Turkey. Section 6 eoneentrates on land and labor produetivity in the two eountries. Finally, a summary and conclusions appear in section 7.
2. Life Expectancy
In the Human Development Report, life expeetancy at birth is defined as " the number of years a newbom infant would live if prevailing patterns of mortality at the time birth were to stay the same throughout the ehild's life" (United Nations Development Program, 199R:219). Life expeetaney at birth is a measure of longevity. it is an outeome of the improvements in the health system and fertility levels in the eountry. Its major shortcoming is that it is a quant'itati've measure with no indication about the quality of life that is lived.
Table 1 gives the life expeetaney at birth in Egypt and Turkey during 1960-1997. Life expectancy at birth improved signifieantly in both Egypt and Turkey. It increased from a low of
46 years in 1960 to 68 in 2001 in Egypt. It increased from 51 in 1960 to 70 in 2001 in Turkey. During this period Egypt's average rate of improvement in life expeetaney exceeded that of Turkey although in 2001 Turkey's life expectaney at hirth is signifieantly higher than that of Egypt.
4
eAnkara Universitesı SBF Dergisie59.4Tahle
1:
Life expectancy at hirt/ı.1960 -
2001: Egypt versus Turke_\!%:Av.Ann. Years
1960
1970
1975
1980
1985 1990
1995
2000
2001
Change"
Eg):pt
fcmale n.a. .'i2 55 57 61 M 67 69 70
ı.
12Male n.a. .'iO 52 54 58 61 M 66 67 1.09
Total 46 .'il 53 56 59 63 65 6R 68 I.l6
Turkey
Fcmale n.3. 59 62 64 66 68 71 72 72
0.71
Male n.a. 55 57 59 61 64 66 67 67 0.70
Total SI 57 59 61 63 66 68 70 70 0.91
aA verage wl/ıual rates of chwıxe art' ıveixlıted by poplılatirJll. Sourel': World Bank, 2002.
In most developing countries such as Egypt and Turkey the trends and differentials in life expectancy at birth are mainly influenced by the trends and differentials in infantı and child2 mortality rates (United Nations Development Program, 1990: 19). One of the reasons behind this improvement in life expectancy at birth is the dramatic decline in child mortality rates both in Egypt and Turkey. The mortality rate in Egypt for children younger than five years declined from 235 İn 1970 to 41 in 2001 (World Bank, 2002). The mortality rate in Turkey for children younger than five years declined from 201 in 1970 to 43 İn 2001 (World Bank, 2002), The second reason is the significant İncrease in the supply of doctors in the both countries, The public health expenditure as percent of Gross Domestic Product (GOP) in Egypt was 1.6 in
1995 and increased to 1.8 İn 2000. The same percentages in Turkey were 2.4 in 1995 and increased to 3.5 in 2000. During this period the Egyptian government has done much to increase the numbers of public health clinics and to i!nprove the public access to safe water and sanitation facilities. Similarly, in Turkey health conditions especially those sUffounding pregnancy and birth in urban as well as rural areas improved significantly. The Ministry of Health established
i Infant mortality rate is the number of İnfants who die hefore reachiııg aııe year of agc cxprcsscd per aııe thousane! livc binhs İn a gİven year.
2 Child monality rate refers to the al1llUal number of deaths in the agc group 1-4 years per oııe thousane!live binhs iıı a given year.
Kemal Baş eEvaluat!~g and Comparing the Process of Development in Egypt and Turkey e
5
the General Directorate of ;'v10thcr and Child Health and Family Planning in
1965.
This has contributed to the significant declines in infant and child mortality. A number of other factors have been important for the drop in the infant mortality rates. These faetors included the increases in the level of incomes (World Bank,1998-1999: 17)
and the improvements in the education of women. Subbarao and Raney(1995)
found that the secondary !evel of schooling of women when interacted with family-planning programs significantly reduees the fertility and infant mortality rates. The significant improvements in the level of ineames and the schooling of women both in Egypt and Turkey eontributed to reducing fertility and İnfant moıtality rates and thereby increasing the life expectaney at birth.3. Aduıt Literacy
Adult literacy rate of a country is another widely used indicator of development. Although it has same limitations it is elosely related to development through its effect on the produetivity of land, labor and capitaL. There is international evidence that more and better educated people can use resources effectively and therefore have higher levels of productivity than the uneducated ones, survey evidence from group of low income countries indicate that average edueation of four years of primary schooling enhanees farm output by 8.7 percent (HADDAD,
1990).
Further, educatian significantly influences choice of crops and utilization of modern production techniques and inputs as well as non-farm activities such as utilization of credi! (TILAK,1989:24).
Adult literaey is measured by "the percentage of people aged
15
and above who can, with understanding, both re ad and write a short, simple statement on their daily life" (United Nations Development Program, 1998:219).
Table2
shows the adult literacy rates in Egypt and Turkey in1960
and2000.
The adult literacy rat es were rather low in both Egypt and Turkey in1960.
There were signifieant improvements over time in both countries. However, in2000,
Turkey's adult literacy rat e was about85
percent while that of Egypt was only about55
percent. Over this period the rate of improvement has been much faster in Turkey than in Egypt:3.10
percent versus2.24
percent respeetively. To achieve literacy may require more effort in Egypt than İn Turkey. In Egypt the written and spoken languages are different whereas in Turkey theyare the same. Therefore, it takes longer for a person to be literate in the written language in Egypt than in Turkey.6
eAnkara Ünıversites: SBF Dergısı e59-4Table 2: Adult literac.,>"1960 - 2000, Egypt and Tl/rke:•.
Literac)" Rate
Years
1960
1970
1980
1990
2000
Egypt ,29 43
44
47
55
Turkey 38
50
65.6
75
R5Source: UNDP !!umaıı Development. WinoliS yeıırs.
o/cAv. Ann. Change
1960-2000
2.24 3.10
Literacy,
especially
female
literacy
is a prohlem
both in Egypt
and in
Turkey.
Both countrİcs
share an Islamic tradition.
Islamic tradition
has not been
favorable
for the education
of girls. In particular
in the rural areas conservative
fami!ies are reluctant
to send girls to the same school s as with hoys. In
i998 the
kmale
!iteracy
rates are only 42 percent
in Egypt and 75 percent
in Turkey
(Tansel, 2002: 23). Further in the rural areas the drop-out
rates are higher than in
the urhan areas in both Egypt and Turkey. In the rural areas parents do not want to
loose time by educating
their children. Therefore
children leave school to work on
the family farm or husiness.
Literacy,
especially
female litcracy, is significantly
higher in Turkey than in
Egypt. The
single, most important
factor behind this difference
is that primary
level of schooling
has been compulsory
for both boy s and girls in Turkey
while
this was not the case in Egypt
3.One of the factors hehind
the low rate of the
literacy
is the low priority
given to primary
schoo!ing
in both countries.
Both
countrics
spend significantly
larger sums of money to tertiary education
than to
primary schooling
(ADAMS,
2000:260; TANSEL / KAZEMI,I 995: 14). However,
people leam to read and write during basic education.
For this reason morc public
funds need to be allocated to the basic education.
The primary schooling
enmllment
ratio
4is higher in Turkey than in Egypt.
In Turkey.
this ratio
is over.IOO percent according
to World Bank sources,
and
1 Unıil
ı
907 the school system in Turkey included five years of conıpulsory prımary school ing, three years of nıiddle school, three years of high school (four years in the case of vocational high schools) and ıertiary levels of schooling. Since 1997 the coınpulsory level of schooling is extcnded from five to cight years covcring the middle schooL.4 Enrollmcnt ratio defined as the enrollment at a school level of children who are of the officially -designated age for that level, expressed as a percentage of the age group populaıion corresponding to that school level.
Kemal Baş eEvaluating and Comparing the Process of Development in Egypt and Turkey e
7
illiterate people older than primary school age have been taught in literacy classes and beeame literate (KEPENEK / YENTÜRK,2000:390-391). In Turkey the primary school emollment ratio increased from 75 percent (58 percent for females) in the i960s to 100 percent for both males and females in the 1993. In the following years in Turkey the Iiteracy rate (espeeially female literacy) and schooling in general will increase further because of the increase in the parental level of edueation, school availabiIity and industrialization (TANSEL, 2002). Although primary school emollment ratio is low in Egypt, the secondary school emollment ratio is fairly high because of the policy of guaranteed public employment poIicy followed by the government of Egypt for many years (AOAMS, 2000). In both countries enrollment rates in urban areas are higher than those in rural areas.
4. Income and Poverty
Income is an important indicator of development. However, by itself, it is not a good measure of welfare. The level of real GNP and its growth rate are important but they do not take into account the distribution of income among the population. Income distribution is an important determinant of the Icvel and structure of poverty (OANSUK. 1997). Therefore, this section will consider the issue of poverty and the next section will address the issue of inequality in income distribution, in order to evaluate the access to resources in Egypt and Turkey ..
GOP per capita has increased significantly in both Egypt and Turkey over time. GOP per capita in Egypt was 478 dollars (in 1995 US dollars) in
1970 and increased to 1229 (in 1995 US dollars) in 2001. This represents 3.9 percent al1llUal average increase. GOP per capita in Turkey was 1654 dollars (in i995 US dollars) in 1970 and increased to 2873 (in i995 GS dollars) in 200
ı.
This represents 3.5 percent annual average increase. Thus, GOP per capita is higher in Turkey than in Egypt. On the other hand, bat h countries are classified among lower middle income countries by the World Bank's World Development Report (WOR 2000/2001: 335).Poverty may be defined as the inability to eam enough income to satisfy the basic human economic and social needs. In general, 40 percent of total households with lowest income are generally accepted as pOOL Tables 3 and 4 show the income share of the poorest 40 percent of the houscholds in Egypt and Turkey respectively. Table 3 shows that the income share of the poorest 40 percent of the households has been around 10- IS percent and did not change much from the mid i960s to the mid 1990s. The poorest 40 percent received the highest share of about 15 percent in 1987. Table 3 shows the income shares of
8
eAnkara Universilesi SBF Derg:si e59.4the poorest 40 percent in rural and urban Egypt. The poorest 40 percent of the rural households recei ved the highest shares of around
25
percent in19R
ı
-82
and
1995-96.
The poorest40
percent of the urban households receiyed the highest shares of around20
percent in i9~ i-82,
i990-9
ı
and1995-96.
This share declined inı
997 in hoth rural and urban Egypt indicating an increase in poveı1y. In general, in Egypt the shares of rural households were larger than that of the urban households. The tables make it clear that the income shares of the poorest 40 percent of the households are larger in Egypt than in Turkey. It is in this sense that payerty in Egypt is lower than İn Turkey.Tahle
3:
Total per Capita Expenditure Accruing to poorest40%
of House/wEdsEgypt
Poorest 40o/c of 1964 1974 1981-82 1990-91 1995-96 1997 Households
Rural 19 17.1 24.6 19.7 25.7 17.7
lJrban 16.5 IS.3 21 20.3 20.4 14.8
Soıırce: For /1)64.1974 years, B. l1(/)lsen,(/991). For1981.1997 years, R.11.Adams, (2()()U).
TaNe
4:
Income Accruing to poorest 400/0 of hoııseholdsTurkey 1963 1968 1973 1986 1987 1994 Poorest 40% of
Households 13 10 11.5 12.3 14.85 13.5
Source: Ineome Distribution and Po/icies .. )'('venthAııllIwl Development Plun, Spl'cial Etpert Commission Report (iıı Turkish), SP0, Ankara 1994.
The second approach used in measuıing paverty is has ed on minimum food calarie intake requirements of adults. Using this, poverty line in terms of minimum food expenditure is computed. Hauseholds whose income is less than this level are considered poar. Table S shows the percent of households whose incomes are below the minimum food expenditure. The table shows adeeline in this percent of households in Turkey from
ı
973 toı
994
indicating a deciine in poverty in Turkeyover time. Further, poverty is higher in the in the rural than in the urban Turkey. A comparable tablc does not exist for Egypt. Howeyer, Table 6 and 7 show the percent of households belaw the food and non- food expenditure line in Egypt and Turkey respectively. Table 6 indicates a slight decline in poverty in Egypt and not much dillerence between urban and rural poverty in1996.
Further, the percentage of hoııseholds be/ow the minimumKemal Baş e Evaluatıng and Comparıng the Process of Development ın Egypt and Turkey e
9
food and non- food cxpcnditure lincs in Egypt (in 1995-96) and Turkey (in 1994) are about the same. Thus, wc can talk about a convergence in poverty in Egypt and Turkey in the rnid 1990s.
TaNe
5:
ok ofhouseholds he/ow mininıııınfood expenditure line in Turkey...
_--_
.._--_._._
.._-- -_. Years 1973" 1978" 1983" 1987" 1994< Turkey Rural Urban 32.01 49.SS 1290 24.98 42.45 29.98 5i.25 12.16 15.16 21.97 9.n2 11.0 i4.n 7.na M.Ce/asulı. (/989), ;,E.Daıısuk. (/997). ' SiS. l..ahor Market Ana/ysi.ı. (1999).
Source: Co/umııs I. 2. 3 und 4from E. Dwısıık. (1997). Tahle 16. p.55. Co/umıı 5ji'om
sis.
(1999). Table 5.3.p.25. 1964 1974 198-82 i990-9 i 1995-96 24 65 16.1 2S.6 23.3 n.a35
IS.2 20.3 22.5 ._---_. UrbanTahle
6:
% of households be/m'\! minimum food and llonJood expendİture lİlle inEgypt
Egypt Rural
Source: For 1964.1974 years. H. {-{w/SOL. (1991). For 19?i2.1996 years. R.. H Adaıııs. (200U).
Tahle
7:
% of household.\' belm..., minİmul71.food and non-.food expenditure line in Turkev in 1994 Turkey Rural Urban % of households 24.30 25.40 21.73Poverty Gap Ratio " 0.297
0.307
O.2S2
Source: SiS. (1999). Tnhl" 6.9.p. 3ci. "Cn/cu/ateri br Şeııgiil, Sedu. (2001) .
A third approach to measuring poverty is referred to as the international Standard. In this approach purchasing power parity is used to compute the percent of the population eaming below one doııar or t\Vo dollars a day. Such people are accepted as internationaııy pOOL Table R sho\Vs the international
10
eAnkara ÜGıversitesi SBF Dergısı e 59-4poverty standards for Egypt and Turkey. This tahk indicates that 2.4 percent of
the population
in Turkey (in
1994)was living bela\\' one dallar income aday.
While the same ratio was
3.1percent in Egypt (in
1995).The percentage
of
population
living below two dollars income aday
was IR in Turkeyand
52 in
Egypt. Thus, more than half of the population
in Egypt earns less than two
dollars a day. This indicates that the extent of poverty in Egypt is much higher
than in Turkey by international
poverty standards.
Poverty gap is a measure of severityol'
poverty. As Tablc R makes clear.
in Turkey in
1994.poverty gap at one dollar aday
was lower than in Egypt in
1990
hut higher than in Egypt in
1995.However,
both in
1990and
1995the
pO\'erty gap at two dollars
aday
were three times higher
in Egypt than in
Turkey
in
1994.This implies
that poverty
in Egypt is more severe
than in
Turkey_5
rable 8: International Poverı)' Standards
% of Povcrt)' gap % of Poverty gap Population at Population at
below $1 aday bclow $2 aday $1 aday $2 aday
Egypt (1990) 7.(, 1.1 51.9 15.3 Egypt (1995) 3.i 0.3 52.3 11.4
Turkey (1994) 2.4 0.5 LS 5
Source: World Rwzk, World Developmeııt Report 2000/01 i20(0), Table4.p. /80-/8/.
5. Income Inequality
Ginİ eoefficient
is the most commonly
used measure
of inequality
in
İncome distribution.
it shows the eumulative
proportions
of İncome reccived by
the eumulative
proportions
of reeipients.
The Gini coeffieient
takes
values
between
zero and one. A value of zero means
that income
distribution
is
perf'eetly equal while a value of one means on the contrary, income distribution
is perfeetly
unequal.
Table 9 and
iO show the Ginİ coeffieients
for rural and
urban Egypt respectively.
Table II shows the Gini cocfficients
for Turkey.
5Tablc 7 also gives the poverty gap ratio for Turkey İn i994. The poverty gap ratİo İntlİcates that the rcquired rate of İncrease İn İncome of the households İn Turkey İs
Kemal Baş eEvaluatıng and Comparıng the Process of Development in Egyp! and T urkey e
11
We observe that the Gini coefficient in Turkey has been dedining over time since 1968 until the Iate 1980s implying an improvement in income distribution. However, as sho\'in in Table 9, there is an increase in the Gini coefficicnt since 1987. This indicates that, in the recent years, there is some deterioration in the distribution of income in Turkey. The highly unequa1 distribution of income in Turkey could be due to recent high rat es of unemployment and inflation. Almost a quarter of the total population is below
15
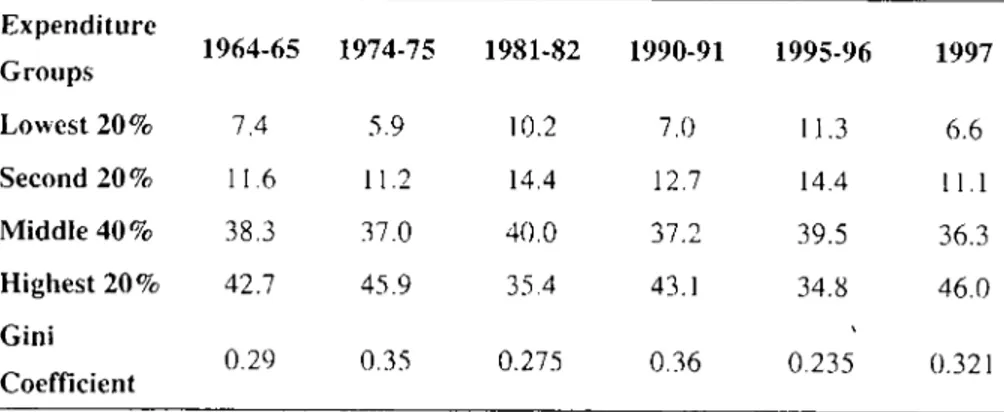
years of age. Unemployment rate of the young is very high. The annual growth rates of the economy have not provided the necessary employment opportunities for its labor forcc. Af ter the mid -1980s the share of the indirect taxes in the total tax revenues has increased significantly. This was one of the factors that contributed to unequal income distribution. Further, it is well known that the tax rates on wage eamers in Turkeyare one of the highest in Europe. This also contributes to the deterioration in income distribution. There is evidence that income distribution has deteriorated further after the February 2001 crisis. GNP declined by 9.5 percent in 2001. Real wages and the minimum wage declined by 11.1 and 13.5 percent respectively. The unemployment rate increased from 6.6 percent in 2000 to 9.9 percent in 2001.Table 9: Income Distribution in Ruml Egypt between 1964 and 1997
Expenditurc 1964-65 1974-75 1981-82 1990-91 1995.96 1997 Groııps Lowcst 20% 7.4 5.9 10.2 7.0 11.3 6.6 Second 20% 11.6 11.2 14.4 12.7 14.4
ılı
Middle 40% 38.3 37.0 40.0 37.2 39.5 36.3 Highest 20% 42.7 45.9 35.4 43.1 34.l:\ 46.0 Gini 0.29 0.35 0.275 0.36 0.235 0.321 eoeffıeientSource: ForI964-1!J75. B. Hal/sen. (1991) . For 1981-1997. R. ii.Adams, (2000).
12 _
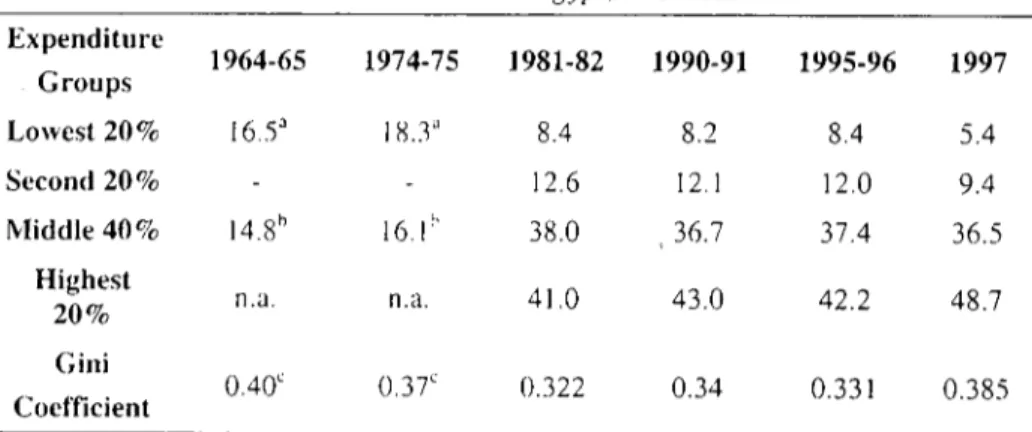
Ankara Üniversıtesi SBF Dergisi _ 59-4Tab/e 10: Income Distribution in Urban Egypt, 1964-1997
Expenditurc 1964-65 1974-75 1981-82 1990-91 1995-96 1997 Groups Lawest 20% 16.S'
ı
~.l" 8.4 8.2 8.4 5.4 Second 20% 12.6 12.1 12.0 9.4 Middlc 40% 14.8" 16.1" 38.0 36.7 37.4 36.5 Highcst n.a. n.a. 41.0 43.0 42.2 48.7 20% Cini 0.40' 0.37' (U 22 0.34 0.33i 0.385 Coefficienta SUIII ot' rhe jirsr and rhe second quımile. " Only rhird quınlile ıs avaılable. ' Taken from rhe survey done by Hansen (/99/ L.Source. For /964-/975, B. Hwıseıı, (/99/). For /98/-/997, R.
f!. Adams. OO()O).
Table ll: l11col71edistribution in Turkey,I
963 -1994
1963" 1973" 1986" 1987" 1994' 1. 20% 4.5 3.5 3.9 5.2 4.9 2.20% 8.5 8.0 8.4 9.6 8.6 3.20% 11.5 12.5 12.6 14.1 12.6 4.20% 18.5 19.5 19.2 21.2 19.0 5.20% 57.0 56.0 55.9 49.9 549 Cini Coefficient 0.55 0.51 0.50 0.43 0.49
,',ource: Han. Ergül (/999). "Sraıe Plannıng Organızarioıı, " Turkish /ndusırıal Busıness Assoclaıion aııd Slale !lısrirule o(Slarisıics.
As Tables 9 and LO show, the Gini eoeffieient in rural and urban Egypt has fluetuated over time. We observe a more equal distribution of ineome in rural as compared to urban Egypt. Table II shows income distribution and Gini eoeflicients for several years İn Turkey. These tables indicate that Turkey's Gini coeflieicnts are higher than those of Egypt implying a higher inequality in ıneome distribution of Turkey than in Egypt. This result is corroborated by the
Kemal Baş _ Evaiuating and Comparıng the Process of Development in Egypt and Turkey _
13
percent of hauseholds with lawest and highest ineames as shown in Tables 9,
LO
andIL.
The tables are based on household surveys.6Table 9 and iO indicate that in 1964-65, the 20 percent of households with lowest income received 7.4 percent of the total income in rural Egypt and 16.5 percent of the total income in urban Egypt. In 1997, this ratio declined to 6.6- percent İn rural Egypt and to 5.4 percent in urban Egypt. The proportion of income received by the 20 percent of households with the highest income increased from about 43 percent in 1964- 65 to 46 percent in 1997 in rural Egypt. The same percentage increased from 41 percent in 1981- 82 to about 49 percent in 1997.
Thus, we can say that income distribution worsened in 1997 in Egypt. The recent poor economic performance was the reason behind this development. During the second half of the 1990s the real GDP growth has declined considerably in Egypt (ADAMS, 2000: 264).
6. Land and Labor Productivity
Inereasing the returns to factors of production is one of the crucial ways of improving the people's access to food and other resources. Land productivity increases in rural areas and labor productivity increases in urban are as are vital steps in the development process. In this section, producti vities of land and labor in Egypt and Turkey will be evaluated and compared to each other and to those of a group of develaping countries.
Productivity of land will be evaluated with three related measures. These measures are average annual growth rates in total cereal production, average annual growth rates in irrigation of arable lands and the average annual growth raıes in agricultural outpuı per hectare. The Egyptian agriculture is mostly under irrigation. Therefore, the land productivity may nol be totally comparablc.
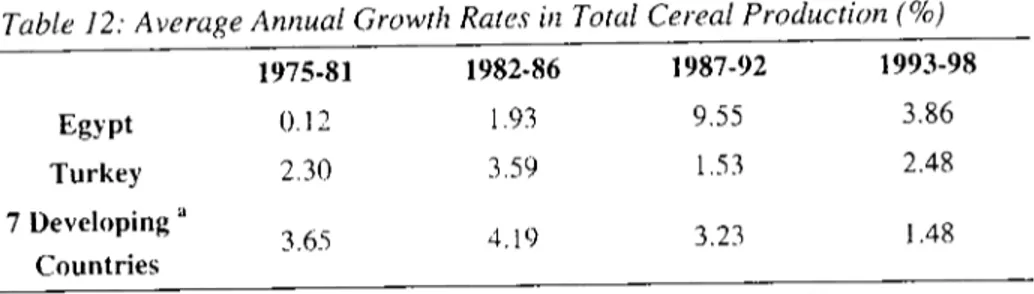
Table 12 shows the average annual growth rates in total cereal producıion for Egypt, Turkey, and seven other developing countries in four periods. During the 1975- 198 1 period, the growth rate in total cereal production in Turkey is higher than that in Egypt but lower than those in the seven other developing cauntries. However, af ter 1987 Egypt's annual growıh rates in total
6 However, household surveys in developing countries such as Egypt and Turkey do not yield a reliable picture of income distribution. This is bccause in many develaping countrics, the tax evasion as well as the self-employıncnt and unpaid family labor are \vidc-spread (CELASUN, 1989).
14
eAnkara Üniversitesi SBF Dergisi e 59.4cereal produetion far exeeeded both of Turkey's and of the other seven developing eountries. The reason for the inerease in Egypt's eereal produetion af ter 1987 is the removal of the governmental marketing and produetion controls on wheat. "As the profitability of wheat inercased, Egyptian farmers responded with ever-increasing wheat yields"(AOAMS, 2000: 270).
Table 12: Average Annual Growıh Raıes in Total Cereal Producıion
(%)1975-81 1982-86 1987-92 1993-98 Egypt 0.12 1.93 9.55 3.86 Turkey 2.30 3.59 L53 2.48 7 Developing a 3.65 4.19 3.23 1.48 Countries
a7Develaping countries are: Argentina, Brazif, Mexieo, Ciııno, Greeec and Iran.
Source: United Nations Food and AgrieLlfıııre Orgmıization, ProdLletion Yearbook (varioLlS years).
As land beeomes searee and mechanization inereases, irrigation of land beeomes important. Tablc 13 gives information about average annual growth rates in irrigation of arablc land in Egypt, Turkeyand seven other developing countries. During the entire period of
J
970-J
997, Egypt had lower (initially negative) growth rates in the irrigation of arable land than Turkeyand the seven developing countries.Table 13: Average Annual Growıh Rale,\'in Irrigaıion of Arable Land
(%)1970-75 1976-80 1981-85 1986-90 1991-97 Turkey 2.0 1.12 0.97 15.96 1.72 Egypt -O.
ı
5 -3.35 0.40 1.35 4.33 7Developing 4.48 2.62 2.32 2.90 2.08 Countries aa 7Devefoping countries are: Argentina, Erozif, Mexico, ehlila, Circeec and Iran.
Source: United Nations Food and Agricufıııre Org(//ıization, Prodııetion Yearbook (various vcars).
During J 986- J 990 period. irrigation of arable land in Turkey annually grew, on average, by 15.96 percent, whieh is a great aehievement. Southeast Anatolian Project in the South East of Turkey started in'igation during this
Kemal Baş _ Evaluatıng and Comparıng the Process of Development in Egypl and Turkey _
15
period. However, during the i991-97 period the growth rate of irrigation was higher in Egypt than in Turkeyand seven other develaping countries.
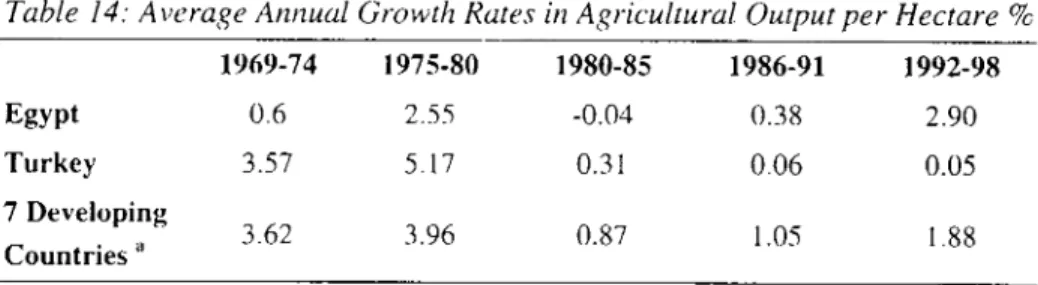
In Tablc 14, average annual growth rates in agricultural output per hectare are show n for Egypt, Turkeyand seven other develaping countries. After 1980, the annua! growth rates in agricultural output per hectare have continuous!y decreased in Turkey. During the 1975-80, the growth rate of the agricultural output per hectare was highest in Turkey. During 1992-98 the growth rate of the agricultural output per hectare was higher in Egypt than in Turkeyand seven other develaping countries.
Table l4: Average Annual Growth Rates İn Agricultural Output per Hectare
%1969-74 1975-80 1980-85 1986-91 1992-98 Egypt 0.6 2.55 -0.04 0.38 2.90 Turkey 3.57 5.17 0.31 0.06 0.05 7 Develuping 3.62 3.96 0.87 1.05 1.88 Countries II
a 7Other Developiııg COll1ltries: ArgelllUw, Brazil, Mexiro, Ch/na, Iızdia, Grccee and Iraız. Source: United Nations Foo" and Agricııltııre Orgrıııization, Prodııetüm Yearhook(varioııs
years).
Tahle 15: Average Annual Growth Rate ofLabor Productivity
(%)Egypt 1960-70 1970-77 1980-90 Industrial Value Added II 5.4 7.2 5.2 Industrial Employment h 3.9 4.2 2.7 Lahor productivity in +13 + 4.0 + 2.5 Industry c
Source: IIFor the 1960-77 years, World Bank, World Development Report,
ı
980, p. 112. For the1980- 2000 years, , World l3ank, World Development Report, 2000/200 L, p.294. h ['or the
ı
960-70 years. International Labor Organization (ILO). Yearhoak of Statistics, (1945-89), p.134, (1981). p.194; for 1970.77 years International Labor Organization (ILO), Yearbaok of Statistics, (1986). p. 309 (This row is complItcd by the authol'.
16 _
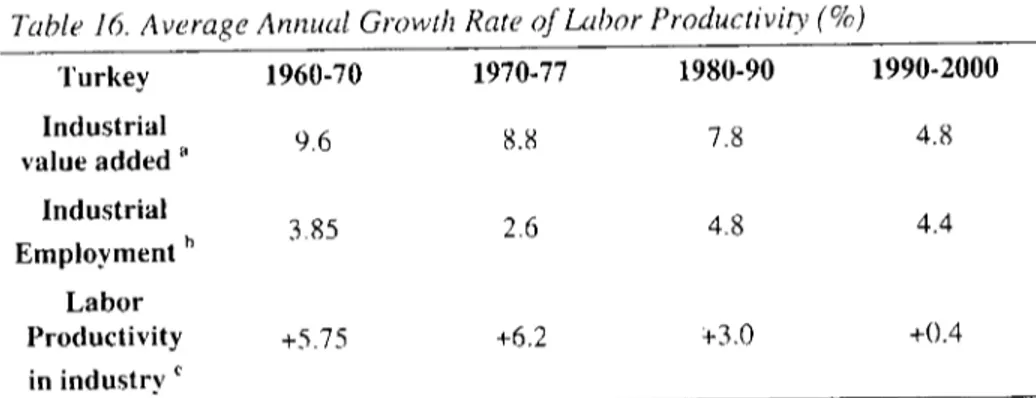
Ankara Üniversıtesı SBF Dergısi _ 59-4Table J 6. Average Annual Growtlı Rate of Lahor Productivity (%)
Turkey 1960-70 1970-77 1980-90 1990-2000 Industrial
9.6
8.8
7.8
4.8
value added a Industrial4.8
4.4
Employment h 3.852.6
Labor Productivity+5.75
+6.2
+3.0+0.4
in industry c8ource: " For ıhe 1960-77 years. World Bank, World Development Reporı, 1980, p. 112. For ılıe 191\0- 2000 years, . World Bank, World Developmeııı Report, 2000f2001, p.294. b For ılıe
1960-1970 and 1970-1977, OIXD, Labor Foree Sıaıisıics, 1985, p.426; 1992, p.436. For ıhe
1980-1990 and 1990-2()OO,SPO. Main Economic Indicators, 1989. p.87; 1995, p.133. c This row
is compuıed by ıhe aUlhor.
Table 15 and 16 show the changes in the average annual growth rate in labor productivity in Egypt and in Turkey respectively from 1960 to 1990. Average annua! growth rate of industrial value added in Egypt is lower than in Turkey in all three decades. Labor productivity growth rate declined considerably over time in Turkey from 5.75 percent in 1960-1970 to 0.4 percent İn 1990-2000. In Egypt it first increased from 1960-70 to 1970-77 then declined in 1980-90. The relatively low !evel of productivity in both Egypt and Turkey can be attributed to the slow progress in privatization.
Table 16 shows the changes in the average annual growth rate in labor productivity İn Turkey from 1960 to 2000. As can be seen from the table, average annual growth rate of industrial value added in Turkey has deereased over the years. On the other hand, industrial employment has increased slightly from the beginning of the 1960s to the end of the 1990s. In that sense, average am1Ual growth rate of labor productivity in the industrial sector for Turkey decreased from 5.75 percent in the 1960s to 0.4 percent in the 1990s.
7. Summary and Conclusions
This article evaluated and compared the development records of Egypt and Turkey. Five indicators of development are used in this process. These are life expectancy at birth, adult Iiteracy rate, income and poverty, inequality in income distribution and finally, land and labor productivity.
Both Egypt and Turkey experienced significant improvements in life expectancy at birth since the 1960s. During the period 1960 to 1997, the
Kemal Baş e Evaluatıng and Comparing the Process of Development in Egypt and Turkey e
11
average rate of improvement in life expectaney in Egypt exeeeded that of Turkey. However, in 1997, the life expectancy at birth in Egypt is considerably below that in Turkey. Over time, Turkey has shown faster improvements in the adult !iteracy rate than Egypt. This is due to the law of compulsory primary schooling in Turkey sİnce the early years of the Repub!ic of Turkey. As a result, the current adult literacy rate in Turkey is much higher than that in Egypt.
In terms of poverty, one of the measures considered is the income share of the poorest households. This share has been lower in Turkey than in Egypt during the period of 1963-1997 indicating that the poverty in Turkey has been higher than that in Egypt. Further, while the income share of the poorest 40 percent of the households has remained more or less constant in Turkey, this share has increased considerably in Egypt over the period 1964-1995. However, there was a drop in this share in 1997 İn Egypt. This indicates that while poverty level did not change much in Turkey, there were significant improvements in poverty in Egypt since the 1960s. As a second measure of poverty the percent of households belaw the minimum food and non-food expenditure line is used. In the I990s the percent of households below the minimum food and non-food expenditure line was about the same in Egypt and Turkey. In bat h countries, in terms of this measure the rural poverty was found to be higher than the urban poverty. The third measure of poverty used was the population belaw one or two dollars aday. In the 1990s the percent of population below one dollar aday was abaut the same in Egypt and Turkey. Howevcr, the percent of population belmı.,' two dollars aday was about three times more İn Egypt than in Turkey.
Next, the inequa!ity in income distribution is considered. In order to assess the inequality in income distribution one of the measures used was the Gini coefficient. The Gini coefficient İn Turkey has shown adeclining trend, indicating improvements in income distribution since the 1960s. The Gini coefficient in Egypt has fluctuated over time since the 1960s, indicating improvements in income distribution in same years and worsening in income distribution in other years. However, as shown in the Tables 10 and
ı
1, calculated Gini coefficients for all the time periods indicate that the Gini coefficient in Turkey is much highcr than that in Egypt. Therefore, income distribution is more unequal in Turkey than that in Egypt.In order to evaluate the productivity of land, three measures are used. These measures are average annual growth rat e in cereal production, average annual growth rate in irrigation of arable land and average annual growth rate İn agricultural output per hectare. Average annual growth rate in ccreal production in the 1990 was higher in Egypt than in Turkeyand seven other developi ng
18
eAnkaraÜnıversitesiSBF Dergisie 59-4countries. Again in the 1990s the average annual growth rate in irrigation of arable land was higher in Egypt than in Turkeyand in the seven other developing countries. However, Turkey experienced the highest average annual growth rate in this respect during the second half of the 1980s. In the 1990s average annual growth rate in agricultural output per heetare was higher in Egypt than in Turkeyand seven other developing eountries. Thus, we can conclude that, recently, the productivity of land was higher in Egypt than in Turkeyand in the seven other developing counties by the three measures considered. The last concept considered was the lahor productivity. Due to data limitations. labor produetivity was considered only in the industry. In Turkey the average annual growth rate of labor produetivity in industry declined considerably over time since the 1960s while it increased considerably in Egypt over the same period.
In eonclusion we can say that whilc Turkey is ahead of Egypt in terms of so me development indicators such as the life expectancy at birth and the literacy rate, Turkey is behind Egypt in term of other development indieators. Inequality in the distribution of income is higher in Turkey than in Egypt Poverty may be considered to be about the same in two countries depending on the measure used. Further, rceently, the productivity of land and labor are both higher in Egypt than in Turkey. Higher productivity of land and labor in Egypt may imply better prospects of development for Egypt than in Turkey. However, Egypt needs to focus on improving investment in human capitaL.
Refences
ADAMS, Richard H. (2000). "Evaiuating the Process of Development in Egypt, 1980-97,"
International Journal of Middle East Studies, 32: 255.275.
CELASUN, Merih (1989). "Income Distribution and Employment Aspects of Turkey's Post- 1980 Adjustment," METU Studies in Development, 1613-4: 1-31.
DANSUK, Ercan (1997). "Measurement of Poverty in Turkeyand Its Relation to Socio- economical Structures," (in Turkish) (Ankara: SPO).
ESMER, Y. / FişEK, H. / KALAYCIOGLU, E. (1986), Research Series on Social and Economic Priorities Vol. 2, (in Turkish) (istanbul: TÜSiAD).
HADDAD, W. D.[et al] (1990). Education and Development: Evidence for New Priorities, No. 95 (Washington, D.C.: World Bank Discussion Paper).
HAN, Ergül (1999), Income Distribution in Turkey (in Turkish). ÖZER, Mustafa (Ed.) (Açıköğretim Fakültesi Yayınları NO.608).
HANSEN, B. (1992), The political Ecanomy of Poverty, Equity and Growth: Egypt and Turkey
(New York: Oxford University Press).
KEPENEKY. / YENTÜRK N. (2000). Turkish Economy (in Turkish) (11'h Edition): 390-391. SUBBARAO, K. / RANEY, L. (1995). "Social Gains from Female Education: ACross-National Study,"
Economic Development and Cultural Change, 44/1 (October): 105-16.
TANSEL, Aysıt (2002), "Determınants of School Attainment of Boys and Girls in Turkey: Individual, Household and Community Factors," Economics of Educotion Review, 21: 455-470.
!
Kemal Baş e Evaluating and Comparrng the Process of Development ın Egypt and Turkey e
19
TANSEL, A. / KAZEMI, A. (2000) "Educational Expenditures in the Middle East and North Africa,"
Middle Eastem Studies, 36/4: 75-98.
TiLAK, Jandhyala B. G. (1989), Education and Its Relation to Economic Growth, Poverty, and Income Distribution (Washington, D.C.: World Bank Discussion Papers): 24.
ŞENGÜL, Seda (2001), Poverty Profile and Food Demand According to Income Groups in Turkey (in
Turkish) (Adana: Unpublished Ph.D. thesis, Çukurova Üniversitesi).
STATE PLANING ORGANiZATION (SPO) (1976), Research on Income Distribution (in Turkish) . (Ankara.: SPO).
STATE PLANING ORGANiZATION (SPO), (1994), "Income Distribution and Policies," Seventh Annual Development Plon, Special Expert Commission Report (in Turkish) (Ankara: SPO, Table: 63,84).
STATE INSTITUTE OF STATISTICS (5/5) (1990), Income Distribution in 1987 (in Turkish) (Ankara).
UNDP, Human Development Report (1990), Oxford University Press. UNDP, Human Development Report (1998), Oxford University Press. THE WORLD BANK, Development Report (1990), Washington, D.C. THE WORLD BANK, Development Report (1998), Washington, D.C. THE WORLD BANK, Development Report (2000/2001), Washington, D.C. THE WORLD BANK, Development Report ( 2002), Washington, D.C. THE WORLD BANK, Development Report (1998-1999), Washington, D.C.