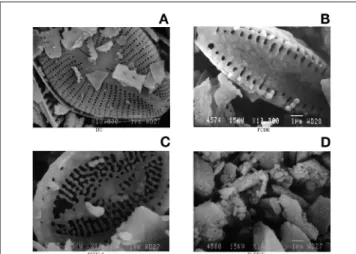
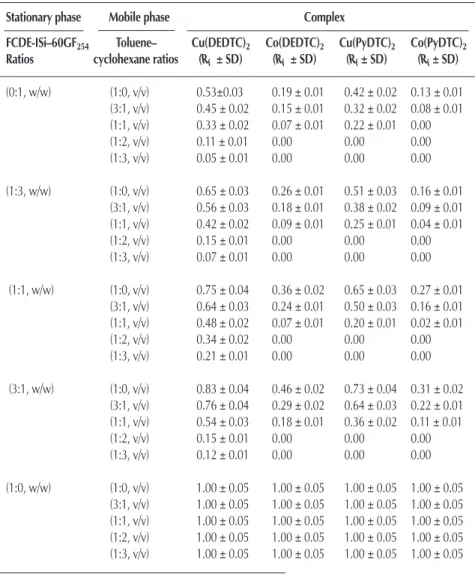
Natural diatomaceous earth (DE) is modified by flux calcination and refluxing with acid. To characterize natural DE,modified DE’s [flux calcinated (FC)DE and FCDE-I] and silica gel 60GF254 (Si-60GF254) are analyzed microscopically, physically, and chemically by various techniques. FCDE-I and Si-60GF254are investigated for their usefulness in the stationary phase of thin layer chromatography (TLC) both individually and in composition. Sodium diethyldithiocarbamate (DEDTC) and ammonium pyrrolidinedithiocarbamate (PyDTC) are prepared as Co or Cu (M) complexes [M(DEDTC)2and M(PyDTC)2, respectively]. These complexes and their mixtures are run on thin layers of Si-60GF254 and FCDE-I individually, and on various FCDE-I and Si-60GF254 mixtures. Pure toluene and various toluene–cyclohexane mixtures (3:1, 1:1, 1:2, 1:3, v/v) are used as mobile phases for the running the complexes. The best analytical separations of both M(DEDTC)2 and M(PyDTC)2complexes are obtained when using pure toluene and toluene–cyclohexane (3:1, 1:1, v/v) as mobile phases on FCDE-I–Si-60GF254(1:3, 1:1, w/w) layers as stationary phases. This study shows that it is possible to qualitatively analyze and to
satisfactorily separate a mixture Cu2+and Co2+cations on cited chromatographic systems.
Introduction
A number of minerals have previously been used as thin layer chromatography (TLC) adsorbents, including activated ben-tonite (1), kaolinite (2), china clay (3), activated bleaching earth (4), modified perlite (5), and modified diatomaceous earth (6). Natural diatomaceous earth (DE) is a biogenic sedimentary min-eral and originates from the deposition of hard frustules of siliceous algaes (diatoms), which lived in fresh or seawater in the Miocene and Pliocene periods. It is composed of amorphous SiO2, a variety of inorganic compounds based on metals (such as iron, aluminium, alkaline metals, and earth alkaline metals), and
a number of organic compounds (6,7). To characterize DE, it is necessary to analyze it microscopically, physically, and chemi-cally (8,9).
Chromatography is one of the most important analytical tech-niques used to separate components of mixtures. Thin layer chro-matography (TLC) is a quick, easy, and simple separation method extensively used for organic species but rarely used for inorganic cations. While TLC is not common for inorganic cations, in the literature, some researchers have recently revealed that its utility is also valid for inorganic samples (9–24). Additionally, the chro-matographic behaviors of M(DEDTC)2and M(PyDTC)2(M: Cu or Co) complexes on activated and non-activated thin layers of silica gel 60GF254(Si-60GF254) using two different mobile phases are discussed in the context of the variation of stationary phase acti-vation, mobile phase polarity, separation mechanisms, and the nature of the metal, ligand, and complexes (25).
Effective separation by TLC depends on the properties of the sample, mobile phase, and stationary phase. The best representa-tion of the interrelarepresenta-tionship between properties of the sample, mobile phase, and stationary phase is given by Stahl’s diagram in Figure 1 (6,26). In the diagram, the angles of the triangle corre-spond to the properties of the sample, stationary phase, and mobile phase. The appropriate conditions for a good separation are determined by rotating the triangle (6,26). The outstanding characteristics of the stationary phase are physical parameters such as particle size and distribution, particle shape, pore size
Abstract
Acid Modified Diatomaceous Earth-A Sorbent Material
for Thin Layer Chromatography
Soner Ergül1,* and S¸ahin Savas¸cı2
1Department of Science Education, Faculty of Education, Ondokuz Mayıs University 55200, Atakum Yerleskesi-Samsun, Turkey and 2Department of Chemistry, Faculty of Science and Literature, Balikesir University, 10100 Balıkesir, Turkey.
* Author to whom correspondence should be addressed: email sergul@omu.edu.tr and diatomite2003d@yahoo.com.
Figure 1. Stahl’s diagram for choosing experimental conditions for TLC.
and distribution, specific surface area (as), and chemical
param-eters such as surface hydroxyl group density [αOH(s)] (5,6,9). The
chromatographic behaviors of components of commercial ink samples were investigated to give a comprehensive under-standing of the systematic effects of stationary phase properties such as asandαOH(s), and also those of the mobile phase such as
polarity and acidity, onRfvalues and separability of the
compo-nents (6).
In practice, the optimal separation conditions are investigated by changing the properties of the mobile phase. Stationary phase properties are not investigated because sorbents with varying activity are not available. In this context, the chromatographic behaviors of commercial red and blue ink components, which are soluble in water (6), were investigated, but the chromato-graphic behaviors of M(DEDTC)2and M(PyDTC)2complexes,
which are not soluble in water were not investigated. Therefore, in this study, the utility of DE was investigated by modifying it through flux calcinations (FC) and refluxing with acid processes. Acid modified FCDE (FCDE-I) was used to systematically change stationary phase activity by mixing with Si-60GF254. The
reten-tion factors (Rf), theoretical plate number (N) values, and
sepa-rability of complex mixtures were examined and are discussed in the context of the variation of the stationary and mobile phase properties, retention mechanism, and the nature of the metal, ligand, and complexes.
Experimental
Chemicals, reagents and materials
DE was sourced from the Afyon-Tinaztepe district in Anatolia (Afyon, Turkey). Toluene, cyclohexane, Si-60GF254, NaDEDTC,
NH4PyDTC, Cu(NO3)2, Co(NO3)2, Na2SO4, HCl, CHCl3,
CH3COOH, and CH3COONa were purchased from Merck
(Darmstadt, Germany).
Cu(DEDTC)2, Co(DEDTC)2, Cu(PyDTC)2, and Co(PyDTC)2
complexes were prepared by the reactions of NaDEDTC and NH4PyDTC with Cu(NO3)2and Co(NO3)2. Pure toluene and
toluene–cyclohexane mixtures (3:1, 1:1, 1:2, 1:3 v/v) were used as the mobile phases.
Si-60GF254and FCDE-I individually, and three
FCDE-I–Si-60GF254(1:3, 1:1, 3:1, w/w) mixtures were used as the stationary
phases. The plates were prepared using a Loughborough, Griffin & George, TLC Unikit (Leicestershire, U.K.). All chemicals were of analytical grade.
Modification of natural DE
DE was ground, sized with a 50 µm sieve, and calcinated with Na2CO3as the flux reagent at 900–1000°C. The product was
named flux calcinated (FC)DE. FCDE (100 g, < 50 µm particle size) was then refluxed with 500 mL of 3 mol/L HCl at 100–110°C for 3 h. After cooling to room temperature, the mixture was fil-tered and washed until the filtrate gave a negative reaction for Cl–. The product was dried at 110°C for 24 h and then sized with
a 50 µm sieve. The product, acid modified FCDE, was named FCDE-I. FCDE-I was used as the principal stationary phase com-ponent for TLC applications.
Scanning electron microscopy
DE, FCDE, FCDE-I, and Si-60GF254were characterized by using a scanning electron microscope (JEOL-JMS840, Instruments, Tokyo, Japan). The micrographs are shown in Figure 2.
Infrared spectroscopy
The IR spectra of DE, FCDE, FCDE-I, and Si-60GF254were investigated with a BX-II model Fourier-transform (FT) IR spec-trometer from Perkin Elmer (Beaconsfield-Buckinghamshire, U.K.). The DE, FCDE, FCDE-I, and Si-60GF254were first dried at 110°C overnight. They were then accurately weighed and 3.5 mg of dried sample was mixed with 350 mg of KBr, ground in an agate mortar, and pelletted under vacuum with an applied pres-sure of 10 tons/m2. The transmittance spectra of samples in the
region of 4000–400 cm–1are given in Figure 3. Particle size analysis
Particle size was analyzed with a Series 2600 particle size ana-lyzer from Malvern Instruments (Worcestershire, U.K.), in com-bination with a computer. The particle size analysis data for FCDE-I and Si-60GF254are shown in Table I, and their particle size distributions are shown in Figures 4 and 5, respectively.
In Table I, span is the measurement of the range of the particle
Figure 2. Scanning electron micrographs of DE (A), FCDE (B), FCDE-I (C), and Si-60GF254(D) with 10.000× magnification.
Figure 3. Transmittance spectra of DE, FCDE, FCDE-I, and Si-60GF254in the
region 4000–400 cm–1.
size distribution. It was calculated using the following equation:
Span =________________D[v,0.9] – D[v, 0.1] Eq 1 D[v,0.5]
Span is a dimensionless number, which indicates whether the distribution is narrow or wide; 90% of the distribution is below the value D [v, 0.9]; 10% of the distribution is below the value D [v, 0.1]; and 50% of the distribution is above and 50% below the value D [v, 0.5]. The volume median diameter, D [v, 0.5], should not be confused with the diameter, D [4, 3]. It divides the distri-bution exactly in half. In Table I, the parameter D [4, 3] refers to the arithmetically derived volume mean diameter. It is the diam-eter of a sphere having the same values as the real particle. D [3, 2] refers to the surface area mean diameter. It is the diameter of a sphere having the same surface area as the real particle (5,6). Table I shows that the average particle diameters for FCDE-I and Si-60GF254are 11.95 and 24.24 µm, respectively.
Determination of specific surface area
The specific surface areas of FCDE-I and Si-60GF254were
determined by using a Brunauer-Emmet-Teller (B.E.T.) analyzer from Quantachrome (Syosset, NY), combined with a computer at TUBITAK in Turkey. Specific surface areas of FCDE-I and Si-60GF254were 1.39 m2/g and 306 m2/g, respectively. The
repro-ducibility of specific surface area values was± 5%.
Surface hydroxyl group density
The method applied by Chertov et al. (27) for the determina-tion of surface hydroxyl group density [αOH(s)], based on the ion exchange of surface hydrogen for Ca2+in Ca(OH)
2solution, was
used. TheαOH(s)values for FCDE-I and Si-60GF254were 0.00 and 4.84 µmol/m2, respectively. Experimental data for specific
sur-face area and sursur-face hydroxyl group density parameters of FCDE-I and Si-60GF254are given in Table II.
Determination of pore size
The pore size analyses of FCDE-I and Si-60GF254were carried out using an Autopore 9220 mercury porosimeter from Micromeritics Instrument Corp. (Norcross, GA). Pore diameter and pore volume data are given in Table III.
Preparation of thin layer plates
Slurries of Si-60GF254in water (1:2, w/v) were spread with the spreader kit on clean glass plates measuring 7.5× 15 cm, with a thickness of 250 µm. Non-activated plates were obtained by storing the plates at room temperature for 12 h. They were then activated by heating in an oven at 110°C for 2 h. For TLC appli-cations, activated plates were used.
Other activated layers were prepared using different FCDE-I and FCDE-I–Si-60GF254 (1:3, 1:1, 3:1, w/w) mixtures. The water–FCDE-I–Si-60GF254ratio required to prepare slurries was approximately 2:1 (v/w) and that of water–FCDE-I was approxi-mately 3:1 (v/w).
Synthesis of M(DEDTC)2and M(PyDTC)2complexes
Prepared were 0.1 mol/L solutions of metal nitrates [Cu(NO3)2, and Co(NO3)2] at pH 5.5–6.0 (adjusted by acetic acid-sodium acetate buffer). From these solutions, a 1.0-mL aliquot was poured into a beaker and 1.0 mL of 0.1 mol/L NaDEDTC (or NH4PyDTC) solution was added to it and then was shaken. Four milileters of pure chloroform was added to the beaker and was shaken for 1 min. This mixture was tranfered into a separatory funnel and shaken. The phases were allowed to separate for 5 min. The aqueous phase was separated from the chloroform phase and discarded. Subsequently, the chloroform phase con-taining the complex was dried by treating with anhydrous Na2SO4. The dried phase was used as sample for TLC applica-tions.
TLC applications
Two microliter aliquots from each of the complex solutions and their mixtures were spotted with micropipettes on the starting line, which was 2 cm from the bottom of the five acti-vated Si-60GF254plates. The original spots on layers were dried at room temperature for 3 min. A pencil line was marked 5.5 cm above the starting line of each plate. Five developing chambers with 10× 50 × 20 cm dimensions were used for running. Sixty milliliters of pure toluene and toluene–cyclohexane mixtures (3:1, 1:1, 1:2, 1:3, v/v) were poured into each developing chamber individually. The lids of the chambers were closed, and the cham-bers were allowed to stand for 15 min to ensure that saturation of the air in each chamber with solvent vapors occurred. The plates containing the spotted samples were then carefully immersed in the developing chambers. When the solvent fronts Table I. Particle Size Analysis Data of FCDE-I and
Si-60GF254
Adsorbent D[4,3] D[3,2] D[v,0.9] D[v,0.1] D[v,0.5] Span
FCDE-I 11.95 5.10 22.32 3.15 10.86 1.80 Si-60GF254 24.24 8.03 63.81 3.59 21.47 2.00
Table II. Physical and Chemical Parameters of FCDE, FCDE-I, and Si-60GF254
Specific Surface hydroxyl Adsorbent surface area (ααs) group density (ααOH(s))
FCDE 1.55 0.00
FCDE-I 1.39 0.00
Si-60GF254 306.0 4.84
Table III. Pore Diameter and Volume of FCDE-I and Si-60GF254
Adsorbent Pore diameter (µm) Pore volume (mL/g)
FCDE-I 6.9432 2.7859
Si-60GF254 0.0066 1.2999
reached 5.5 cm above the starting line of each plate, the plates were removed and dried. The migration distances of the solvent (Zf) and of each spot (Zx), as well as their width (W), were
mea-sured. Rf(from Rf= Zx/Zf) and N [from N = 16(Zx/Wx)2] were
cal-culated (22,25). The same procedure was also applied to FCDE-I individually, and three FCDE-I–Si-60GF254(1:3, 1:1, 3:1, w/w)
layers.
Results and Discussion
Samples from different natural and synthetic sources contain various compounds as major and minor components. Many of these compounds may have very similar physical and chemical properties. In such cases, sample components generate mutual interference spectra in qualitative, quantitative, and structural analyses. Therefore, in analytical operations, interfering com-pounds with similar properties have to be well separated.
Successful TLC separation depends on the properties of the sample and also those of the mobile and stationary phases. Finding a suitable resolution for a TLC application usually involves changing the properties of the mobile phase only. It does not involve changing the properties of stationary phase, although it is possible that a sorbent exists to change the proper-ties of the stationary phase (6,9). Activated layers with low activity are usually not investigated because of the assumption that the components cannot be successfully separated because of low activity. In this study, the chromatographic behaviors of M(DEDTC)2and M(PyDTC)2complexes were investigated to give
a comprehensive understanding of the systematic effects of sta-tionary phase properties such as asand αOH(s), and also those of
the mobile phase such as polarity on Rfvalues, N values, and
sep-arability of these complexes.
TLC applications for M(DEDTC)2and M(PyDTC)2complexes
were carried out on various combinations of stationary and mobile phases. These complexes are colored and can be easily visualized in the chromatograms. In addition, the spots of the complexes and their mixtures were developed without any tailing or decomposition and were successfully separated into components. DE was modified by FC and refluxing with acid and FCDE-I was used to systematically change the stationary phase
properties for normal phase TLC applications. Si-60GF254,
FCDE-I, and their mixtures were used as stationary phases. Because M(DEDTC)2and M(PyDTC)2complexes are soluble in
toluene and toluene–cyclohexane mixture, pure toluene and toluene–cyclohexane mixtures were used as mobile phases.
To prevent interference, the organic compounds in DE were ignited by the FC process and, thus, removed volatile compounds such as CO2and H2O. Reacting and interfering inorganic
com-pounds were converted to soluble salts and removed from DE by successive FC and refluxing with acid processes, but the SiO2
remained unchanged. Through the modification process, the color of the DE changed from dirty white to white, and the color of the HCl solution during successive refluxing with acid changed from colorless to yellow-green. These qualitative indi-cators suggested that some interfering organic and inorganic compounds had been successfully removed.
Diatomic frustules were among the first objects examined in early electron microscopic studies. They are divided into two main categories (8,9): centric (discoid) and pennate (elongated), shown in Figures 2A–2C. As shown in the figures, the pennate structure of diatomic frustules was not changed by FC and refluxing with acid processes, whereas the texture of frustules was partially broken down because of heating and mixing during the modification processes. Likewise, the structure was also found to have decreased specific surface area and increased diameter of its pores. Data concerned with the latter are shown in Tables II and III. The increased pore diameter and volume was because of the removal of organic and inorganic compounds from voids within the SiO2framework. Because most chemicals,
except HF and concentrated NaOH solution, do not react with amorphous SiO2(6,9), it appears that HCl did not react with the
SiO2of DE.
Because DE is principally amorphous silica (SiO2nH2O) with
free surface silanol (Si-OH) and siloxane (Si-O-Si) groups, it was expected that FCDE and FCDE-I would also have these groups, as well as some kristobolite phase. This expectation was con-firmed by observation. The DE, FCDE, and FCDE-I in Figure 3 show spectral bands appearing at 3695–3400, 1101, 1031 and 912 cm–1. The bands between 3695 and 3400 cm–1 are because of
the free surface silanol group (Si-OH), the bands at 1101 and 1031 cm–1are mainly because of siloxane (Si-O-Si) stretching,
and the band at 912 cm–1is due to (Si-O) stretching of the silanol
group (6,9). The intensity of the band between 3695 and 3400
Figure 4. Particle size distribution of FCDE-I. Figure 5. Particle size distribution of Si-60GF254.
cm–1was significantly decreased because of the removal of the
surface silanol groups by modification of DE, while the band intensities at 1031 cm–1 and 912 cm–1 were significantly
increased. The IR spectra and all other indicators suggest that DE was successfully modified. When the O-H band intensities of Si-60GF254and FCDE-I between 3695 and 3400 cm–1 were
com-pared, the O-H band intensity of Si-60GF254was higher. Thus, it
can be said that Si-60GF254has more surface silanol groups than
FCDE-I. Also, αOH(s)values in Table II support this view.
For adsorbents to have optimal chromatographic properties, they must exhibit a particle size distribution as narrow as pos-sible for a given particle size. A D[v,0.9]/D[v,0.1] ratio between 1.5 and 2.0 is preferred, or the span should be > 1.0 (28). In Figures 4 and 5, the particle size distributions of FCDE-I and Si-60GF254exhibit a Gaussian curve. The spans for FCDE-I and
Si-60GF254are 1.80 and 2.00, respectively, as shown in Table I. The
D [v, 0.1] values of FCDE-I and Si-60GF254are 3.15 and 3.59 µm,
respectively, indicating rather fine particles. This reveals that FCDE-I and Si-60GF254 and their mixtures are appropriate for
TLC applications, with regard to particle size and size distribu-tion.
Experimental asand αOH(s)values of
adsor-bents in Table II show that Si-60GF254has an
asof 306 m2/g and an αOH(s)of 4.84 µmol/m2.
FCDE-I has an asof 1.39 m2/g and an αOH(s) of
0.00 µmol/m2. Compared with FCDE-I,
Si-60GF254has much higher asand αOH(s)values.
Thus, the activity of Si-60GF254layers was
expected to be higher than the activity of FCDE-I layers in normal phase TLC applica-tions. Accordingly, as the ratio of FCDE-I in the stationary phase increased, the asand
αOH(s) values of layers prepared from
Si-60GF254–FCDE-I mixtures decreased.
Consequently, the polarities or activities of any prepared TLC layers are also lowered. It is, therefore, easy to understand the systematic effects of stationary phase properties such as as and αOH(s)on Rf, N values, and separability
of the complexes. For the best separation, it may be necessary to prepare the layers from Si-60GF254–FCDE-I mixtures systematically.
On the other hand, Stahl’s diagram sug-gests that the Si-60GF254layer has the highest
polarity (corresponding to activity V), but the FCDE-I layer has the lowest polarity (corre-sponding to activity I), and the layers of var-ious ratios have intermediate polarities (corresponding to activities II–IV).
In this study, to investigate the chromato-graphic behaviors of complexes, M(DEDTC)2,
M(PyDTC)2, and their mixtures were run on
the selected stationary phase with toluene and toluene–cyclohexane mixtures. In all Si-60GF254and Si-60GF254–FCDE-I layers, the
complex mixtures were successfully separated into components when solvent front values were 5.5 cm. The red and blue in components,
which are soluble in water, were separated successfully on the layers of Si-60GF254–FCDE-I mixtures (6). This study indicates
that M(DEDTC)2, M(PyDTC)2, and their mixtures can be also
sep-arated successfully on the layers of Si-60GF254–FCDE-I
mix-tures. The Rfand N values for these complexes are given in Table
IV and V, respectively.
As seen from Table IV, the Rf values of these complexes
increase when Si-60GF254 is replaced by FCDE-I–Si-60GF254(3:1,
w/w), when using the same mobile phase. An FCDE-I–Si-60GF254(3:1, w/w) layer has lower asand αOH(s)values than an
Si-60GF254layer because the corresponding values of FCDE-I are
lower than for Si-60GF254. Hence, the activity of an
FCDE-I–Si-60GF254(3:1, w/w) layer is also lower. In this context, it follows
that the increase of Rfvalues stems from weakening of the
inter-actions responsible for retention of complex components because of the decrease in activity of the layer. When a similar comparision was done for other mobile phases, the same result was seen. In summary, the chromatographic behavior of com-plex components is susceptible to changing asand αOH(s)
param-eters in the stationary phase.
Rfvalues of complex components on the FCDE-I layers in all
Table IV. RfValues of M(DEDTC)2and M(PyDTC)2(M: Cu and Co) Complexes*
Stationary phase Mobile phase Complex
FCDE-ISi–60GF254 Toluene– Cu(DEDTC)2 Co(DEDTC)2 Cu(PyDTC)2 Co(PyDTC)2 Ratios cyclohexane ratios (Rf ± SD) (Rf ± SD) (Rf± SD) (Rf± SD)
(0:1, w/w) (1:0, v/v) 0.53±0.03 0.19 ± 0.01 0.42 ± 0.02 0.13 ± 0.01 (3:1, v/v) 0.45 ± 0.02 0.15 ± 0.01 0.32 ± 0.02 0.08 ± 0.01 (1:1, v/v) 0.33 ± 0.02 0.07 ± 0.01 0.22 ± 0.01 0.00 (1:2, v/v) 0.11 ± 0.01 0.00 0.00 0.00 (1:3, v/v) 0.05 ± 0.01 0.00 0.00 0.00 (1:3, w/w) (1:0, v/v) 0.65 ± 0.03 0.26 ± 0.01 0.51 ± 0.03 0.16 ± 0.01 (3:1, v/v) 0.56 ± 0.03 0.18 ± 0.01 0.38 ± 0.02 0.09 ± 0.01 (1:1, v/v) 0.42 ± 0.02 0.09 ± 0.01 0.25 ± 0.01 0.04 ± 0.01 (1:2, v/v) 0.15 ± 0.01 0.00 0.00 0.00 (1:3, v/v) 0.07 ± 0.01 0.00 0.00 0.00 (1:1, w/w) (1:0, v/v) 0.75 ± 0.04 0.36 ± 0.02 0.65 ± 0.03 0.27 ± 0.01 (3:1, v/v) 0.64 ± 0.03 0.24 ± 0.01 0.50 ± 0.03 0.16 ± 0.01 (1:1, v/v) 0.48 ± 0.02 0.07 ± 0.01 0.20 ± 0.01 0.02 ± 0.01 (1:2, v/v) 0.34 ± 0.02 0.00 0.00 0.00 (1:3, v/v) 0.21 ± 0.01 0.00 0.00 0.00 (3:1, w/w) (1:0, v/v) 0.83 ± 0.04 0.46 ± 0.02 0.73 ± 0.04 0.31 ± 0.02 (3:1, v/v) 0.76 ± 0.04 0.29 ± 0.02 0.64 ± 0.03 0.22 ± 0.01 (1:1, v/v) 0.54 ± 0.03 0.18 ± 0.01 0.36 ± 0.02 0.11 ± 0.01 (1:2, v/v) 0.15 ± 0.01 0.00 0.00 0.00 (1:3, v/v) 0.12 ± 0.01 0.00 0.00 0.00 (1:0, w/w) (1:0, v/v) 1.00 ± 0.05 1.00 ± 0.05 1.00 ± 0.05 1.00 ± 0.05 (3:1, v/v) 1.00 ± 0.05 1.00 ± 0.05 1.00 ± 0.05 1.00 ± 0.05 (1:1, v/v) 1.00 ± 0.05 1.00 ± 0.05 1.00 ± 0.05 1.00 ± 0.05 (1:2, v/v) 1.00 ± 0.05 1.00 ± 0.05 1.00 ± 0.05 1.00 ± 0.05 (1:3, v/v) 1.00 ± 0.05 1.00 ± 0.05 1.00 ± 0.05 1.00 ± 0.05
* Number of repeated runs: 3.
of mobile phases were 1.00 ± 0.05, as shown in Tables IV. The complex components on these TLC layers moved simultane-ously, with these mobile phases showing no separation. This result is not surprising because the activity of FCDE-I is poor because of its low asand αOH(s)values. This result can be explained by Stahl’s diagram in Figure 1. According to this dia-gram, the separability of polar substances by a polar solvent on an FCDE-I layer with poor activity should not be high. In fact, FCDE-I is not a good sorbent for normal-phase TLC, at least for separating complex mixtures. However, layers of FCDE-I and Si-60GF254mixtures were quite suitable for separating complex mixtures, as well as the Si-60GF254by itself. Although it is not common practice to change the polarity of the stationary phase by adding other sorbents in normal phase TLC applications, this study indicates that activity of the stationary phase can be changed systematically by adding FCDE-I to Si-60GF254. As a result, FCDE-I can be used to optimize the stationary phase properties for chromatographic purposes.
As seen from Table V, the N values of M(DEDTC)2 and
M(PyDTC)2complexes increase when the Si-60GF254 layer is
replaced by FCDE-I–Si-60GF254(3:1, w/w) layer, when using the same mobile phase. Although the activity of an FCDE-I–Si-60GF254(3:1, w/w) layer is also lower than that of a Si-60GF254 layer, an FCDE-I–Si-60GF254(3:1, w/w) layer has higher N values of complexes than a Si-60GF254layer. When a similar compari-sion was done for other mobile phases, the same result was seen. An FCDE-I–Si-60GF254(3:1, w/w) layer has lower asand αOH(s) values than a Si-60GF254layer because the corresponding values of FCDE-I are lower than for Si-60GF254. Hence, the activity of an FCDE-I–Si-60GF254(3:1, w/w) layer is also lower. In summary, the chromatographic behavior of complex components was sus-ceptible to the changing of the activity of the stationary phase, and the FCDE-I–Si-60GF254layers were more successful in sepa-ration than the Si-60GF254layers because of the higher N values. The original spots of the mixtures on the FCDE-I–Si-60GF254 layers were separated better than on the Si-60GF254 layers because of the lower activity of the FCDE-I–Si-60GF254layers and poor polarity of the complexes. Therefore, the spots expand less on the FCDE-I–Si-60GF254layers. This means that the overall effects of Eddy diffusion, longitudinal diffusion, and mass transfer on the FCDE-I–Si-60GF254layers were smaller than on the Si-60GF254layers.
As seen in Tables IV and V, the Rfand N
values of the M(DEDTC)2and M(PyDTC)2 complexes decreased when pure toluene was replaced by the toluene–cyclohexane mix-ture (3:1, v/v), using the same stationary phase. In this context, it follows that the decreases in the Rf values stem from
decreasing the mobile phase polarity. This can be explained in the following way: the polarity of toluene is higher than that of cyclohexane because of its π-electron system. Consequently, when the percentage of toluene decreases, the polarity of the solvent system, the interaction of the complex molecules with the mobile phase, and Rfalso
decreases. On the other hand, pure toluene as the mobile phase was more successful than the toluene–cyclohexane mixture (3:1, v/v) because of the higher N values of the complexes. In addition, the best analytical separations of both M(DEDTC)2 and M(PyDTC)2complexes were obtained when using pure toluene and toluene–cyclohexane (3:1, 1:1, v/v) as mobile phases on FCDE-I–Si-60GF254(1:3, 1:1, w/w) layers as sta-tionary phases.
In a chromatographic application, the retention mechanism depends on the liquid preadsorbed on the layer’s surface, the nature of the mobile phase, and the proper-ties of the sample components (25). In this context, the surfaces of the activated Si-60GF254and other layers were not covered by water or another solvent and adsorption equilibriums were established between the stationary and mobile phases, as in Table V. N Values of M(DEDTC)2and M(PyDTC)2(M: Cu and Co) Complexes*
Stationary phase Mobile phase Complex
FCDE-1–Si-60GF254 Toluene– Cu(DEDTC)2 Co(DEDTC)2 Cu(PyDTC)2 Co(PyDTC)2 Ratios cyclohexane ratios (N ± SD) (N ± SD) (N ± SD) (N ± SD)
(0:1, w/w) (1:0, v/v) 1061 ± 53 256 ± 13 529 ± 27 87 ± 4 (3:1, v/v) 752 ± 38 114 ± 6 306 ± 15 52 ± 3 (1:1, v/v) 324 ± 16 21 ± 1 51 ± 2.55 0 (1:2, v/v) 64 ± 3 0 0 0 (1:3, v/v) 16 ± 1 0 0 0 (1:3, w/w) (1:0, v/v) 2178 ± 109 502 ± 25 1394 ± 70 324 ± 16 (3:1, v/v) 1708 ± 86 256 ± 13 784 ± 39 100 ± 5 (1:1, v/v) 529 ± 27 44 ± 2 348 ± 18 16 ± 1 (1:2, v/v) 114 ± 6 0 0 0 (1:3, v/v) 28 ± 2 0 0 0 (1:1, w/w) (1:0, v/v) 1681 ± 84 711 ± 36 1296 ± 65 900 ± 45 (3:1, v/v) 2178 ± 109 300 ± 15 784 ± 39 324 ± 16 (1:1, v/v) 697 ± 35 28 ± 2 215 ± 11 4 ± 0.2 (1:2, v/v) 500 ± 25 0 0 0 (1:3, v/v) 260 ± 13 0 0 0 (3:1, w/w) (1:0, v/v) 1296 ± 65 625 ± 31 1600 ± 80 514 ± 26 (3:1, v/v) 1129 ± 57 256 ± 13 1225 ± 61 256 ± 13 (1:1, v/v) 576 ± 29 178 ± 9 711 ± 36 144 ± 7 (1:2, v/v) 64 ± 3 0 0 0 (1:3, v/v) 87 ± 4 0 0 0 (1:0, w/w) (1:0, v/v) – – – – (3:1, v/v) – – – – (1:1, v/v) – – – – (1:2, v/v) – – – – (1:3, v/v) – – – –
* Number of repeated runs: 3.
solid–liquid chromatography (SLC). Therefore, adsorption equilibriums are established, as in SLC, on the basis of the retention mechanisms of M(DEDTC)2and M(PyDTC)2
com-plexes on all layers of Si-60GF254and Si-60GF254mixtures.
As seen in Table IV, the Rfvalues of either group complexes
show significant difference when the ligands and the mobile and stationary phases are the same. This results from the difference in the electronic structures of the metal atoms. For example, the difference in the Rfvalues of the Cu(DEDTC)2and Cu(PyDTC)2
complexes on the activated Si-60GF254layer using pure toluene
was 0.11, whereas it was 0.34 for Cu(DEDTC)2and Co(DEDTC)2.
This shows that the metal in the complex had a greater effect than the ligand on the Rfvalue. Although the charges, radii, and
charge densities of Cu2+ and Co2+ in aqueous solutions were very
similar, their d7and d9electronic configurations lead to the
dif-ferent physical and chemical properties of the complexes. The wavelength values for maximum reflections of the Cu(DEDTC)2
and Co(DEDTC)2spots were 273 nm and 325 nm, respectively
(23). Thus, it followed that because of these d electron distribu-tions in the metal complexes with the same ligand, the extra sta-bilization energies decreased from Co2+to Cu2+. Hence, the
interactions of the corresponding complexes decreased with the stationary phase, though the interactions with the mobile phase increased in the same order. This relationship was also valid for these metals and their complexes in all the other chromato-graphic systems with layers of Si-60GF254–FCDE-I mixtures as
the stationary phase.
Conclusions
This work was carried out on mixtures of M(DEDTC)2and
M(PyDTC)2complexes in order to better understand the
system-atic effects of mobile phase polarity, stationary phase properties, such as asand αOH(s), and retention mechanisms, as well as the
effects of the metal, ligand and complexes on the chromato-graphic parameters (e.g. Rfand N ), and to determine the
separa-bility of cation mixtures.
As a first step, FCDE-I was prepared by flux calcination and refluxing with acid processes. As a second step, the asand αOH(s)
values of adsorbents were determined. As a third step, TLC layers were prepared with Si-60GF254, FCDE-I, and various mixtures of
these. As a fourth step, TLC applications were performed on var-ious combinations of stationary and mobile phases. In light of these studies, conclusions are as follows:
(i) Scanning electron micrographs and FTIR spectra showed
that modification has a physical basis.
(ii) As the ratio of FCDE-I in the stationary phase increased, as
and αOH(s)values of the layers prepared from Si-60GF254
–FCDE-I mixtures decreased. Thus, to understand the systematic effects of stationary phase properties such as as and αOH(s)on Rfvalues,
N values and the separability of complex components, it is nec-essary to prepare layers from Si-60GF254and FCDE-I mixtures at
systematically altered ratios.
(iii) Rfvalues of the complex components increased when
the Si-60GF254 layer was replaced with FCDE-I–Si-60GF254
layers, while the mobile phase was constant. When the
per-centage of FCDE-I in the layer increased, Rfvalues increased
because the interactions responsible for retention of complex components weakened because of the decrease in activity of the layers.
(iv) According to the diagram in Figure 1, the separability of
polar substances by a polar solvent on an FCDE-I layer with poor activity is not high. Thus, FCDE-I was not a good sorbent for normal-phase TLC, but layers of FCDE-I and Si-60GF254
mix-tures were quite suitable for separating the complex compo-nents. The activity of the stationary phase can be changed systematically by adding FCDE-I to Si-60GF254. Thus, the
chro-matographic properties of the adsorbent can be optimized by FCDE-I for the separation M(DEDTC)2 and M(PyDTC)2complex
mixtures.
(v) Si-60GF254–FCDE-I layers were used for separation of
com-mercial red and blue ink components which are soluble in water (6). In this study, these layers were also used for the separation of complex components which are not soluble in water. Thus, these layers can be used for separation of polar and non-polar compo-nents.
(vi) The Rfand N values of the complexes decrease when pure
toluene is replaced with toluene–cyclohexane mixture (3:1, 1:1, 1:2, 1:3, v/v) as the mobile phase, using the same stationary phase. It follows that the decrease of the Rfvalues stems from the
decrease of the mobile phase polarity.
(vii) The separation of M(DEDTC)2 and M(PyDTC)2 molecules
on the activated Si-60GF254and Si-60GF254–FCDE-I layers was
carried out via adsorption equilibriums, as in SLC, because there was no adsorbed liquid which was not miscible with pure toluene or toluene–cyclohexane mixture.
(viii) This study showed that it is possible to qualitatively
ana-lyze and satisfactorily separate a mixture of Cu2+and Co2+
cations using TLC following complexing of the cations with DEDTC or PyDTC ligands. In addition, the best analytical sepa-rations of both M(DEDTC)2and M(PyDTC)2complexes were
obtained when using pure toluene and toluene-cyclohexane (3:1, 1:1, v/v) as mobile phases on FCDE-I–Si-60GF254(1:3, 1:1, w/w)
layers as stationary phases.
(ix) Although the ligand and the mobile and stationary phases
were the same, the significant difference in the Rfvalues of the
two group complexes resulted from the difference in the elec-tronic structure of the metal atoms. The metal in the complex had a greater effect on the Rfvalue than the ligand. Although the
charges, radii, and charge densities of Cu2+and Co2+in aqueous
solutions are close to each other, their d9and d7electronic
con-figurations lead to the different physical and chemical properties of the complexes. Thus, when the extra stabilization energies of the metal complexes with the same ligand decrease from Co2+to
Cu2+, the interactions of the corresponding complexes with the
stationary phase decrease, though the interactions with the mobile phase increase in this order.
Acknowledgments
The authors thank Gregory T. Sullivan of Ondokuz Mayıs University for his editorial comments on this manuscript.
References
1. A. Popov and K. Steponov. Activated bentonite as an adsorbent in thin layer chromatography. Acad. Bulg. Sci.21: 673–75 (1968). 2. M. B. E. Fayez, G. Gad, I. Nasr, and A. S. Radvan. Sinai clay, a new
adsorbent for thin layer chromatography. J. Chem. U.A.R. 10: 49–54 (1967).
3. B. Sheen. Chine clay-A sorbent material for thin layer chromatog-raphy. J. Chromatogr. 60: 363–70 (1971)
4. A. Hashimoto, A. Hitorani, and K. Mukai. Separation of alcohols by thin layer chromatography on activated bleaching earth.
J. Chromatogr. 14: 343–47 (1965).
5. R. Karakas and U Yuksel. Modification of perlite for use as a thin layer chromatographic adsorbent. J. Chromatogr. Sci.36: 499–504 (1998).
6. S. Ergül, I˙. Kadan, S¸. Savas¸cı, and S. Ergül. Modified diatomaceous earth as a principal stationary phase component in TLC.
J. Chromatogr. Sci. 43: 394–400 (2005).
7. J. L. Stanley. Industrial Minerals and Rocks, 5th ed. Society of Mining Engineers of the American Institute of Mining, Metallurgical and Petroleum Engineers, New York, NY, 1983, p. 677.
8. S. Ergül and I˙. Açıkgöz, Türkiye’deki bazı diyatome toprag˘ı örnek-lerinin mikroskobik ve nitel analizi. XVII. Proceedings of the
National Chemistry Congress, I˙stanbul University, Turkey 2003,
AK-S9.
9. S. Ergül. Modification of diatomaceous earth and thin layer chro-matographic applications. Ph.D Thesis, University of Balikesir, Balikesir, Turkey, 2003.
10. A. Mohammad and H. Shahab. Use of micellar anionic surfactant solutions with added carbohydrates as mobile phases in thin-layer chromatography of heavy metal cations. Separation of mixtures of aluminium (III), manganese (II), and chromium (VI). Acta
Chromatographıca.15: 192–205 (2005).
11. A. Mohammad, V. Agrawal, and S. Hena. Adsorption studies of metal cations on a silica static flat bed using anionic micellar mobile-phase systems containing carboxylic acids: separation of co-existing iron (III), copper (II) and nickel (II) cations. Adsorption
Science & Technology. 22: 89–105 (2004).
12. A. Mohammad and N. Jabeen. Soil thin-layer chromatography of heavy metal cations with surfactant-modified mobile phases: mutual separation of zinc (II), cadmium (II), and mercury (II).
J. Planar Chromatogr.-Modern TLC.16: 137–143 (2003). 13. A. Mohammad and V. Agrawal. Use of cationic micellar mobile
phases in normal-phase TLC for enhanced selectivity in the separa-tion of transisepara-tion metal ions: simultaneous separasepara-tion of mixtures of zinc, nickel, mercury, and cadmium or manganese cations. Acta
Chromatographıca.12: 177–88 (2002).
14. A. Mohammad, E. Iraqi, and I. A. Khan. Use of nonionic poly(ethylene glycol) p-isooctyl-phenyl ether (triton x-100) surfac-tant mobile phases in the thin-layer chromatography of heavy-metal cations. J. Chromatogr. Sci.40: 162–69 (2002).
15. A. Mohammad and V. Agrawal. Applicability of surfactant-modified
mobile phases in thin-layer chromatography of transition metal cations: identification and separation of zinc (II), cadmium (II), and mercury (II) in their mixtures. J. Planar Chromatogr.-Modern TLC. 13: 210–16 (2000).
16. A. Mohammad. Thin-layer chromatographic methods for the iden-tification, estimation, and separation of toxic metals in environ-mental samples. J. Planar Chromatogr.-Modern TLC.10: 48–54 (1997).
17. A. Mohammad and Mam Khan. Thin-layer chromatographic-sepa-ration of zinc from Cd (II), Hg (II) and Ni (II) in environmental-sam-ples using impregnated silica layers. J. Chromatogr. Sci. 33: 531–35 (1995).
18. M. Ajmal, A. Mohammad, and N. Fatıma. Sodium molybdate impregnated silica-gel layers as stationary phase for chromato-graphic-separation of metal-ions. J. Indian Chem. Soc.66: 425–26 (1989).
19. M. Ajmal, A. Mohammad, N. Fatıma, and A. H. Khan. Determination of microquantities of mercury (II) with preliminary thin-layer chromatographic-separation from mercury (I), lead (II), nickel (II), and copper (II) on acid-treated silica-gel layers - recovery of mercury (II) from river waters and industrial wastewater.
Microchem. J.39: 361–71 (1989).
20. M. Ajmal, A. Mohammad, and N. Fatıma. Separation of microgram quantities of cadmium (II) from milligram quantities of zinc (II) and of copper (II) from nickel (II) and cobalt (II) wıth aqueous sodium formate halogen anion systems. Mıcrochem. J.37: 314–21 (1988). 21. A. Mohammad and N. Fatıma. Cation thin-layer chromatography in mixed organic-solvents containing s-butylamine - separation of Zn (II) from Cd (II) and Cu (II). Chromatographıa.,23: 653–56 (1987). 22. S. Ergül. Qualitative analysis of Cu2+, Co2+and Ni2+cations using
thin layer chromatography. J. Chromatogr. Sci.,42: 121–24 (2004). 23. S¸. Savas¸cı and M. Akçay. The determination of some heavy metal cations by TLC/Photodensitometry. Tr. J. Chem. TUB TAK, 20: 146–52 (1996).
24. R. Gürkan and S¸. Savas¸cı. Investigation of separation and identifica-tion possibilities of some metal-DEDTC complexes by sequential TLC-IR systems. J. Chromatogr. Sci., 43: 324–30 (2005).
25. S. Ergül. Investigation of thin-layer chromatography properties of some transition metal complexes based on ditiocarbamates.
J. Chromatogr. Sci.,44: 1–5 (2006).
26. A. A. Akhrem and A. I. Kuznetsova. Thin Layer Chromatography, A
Practical Laboratory Handbook, Israel Program for Scientific
Translations Ltd., Jerusalem, Israel 1965, p. 102–104.
27. V. M. Chertov, D. Dzambaeva, A. S. Plashinda, and I. E. Neimark. Surface and intraglobular silanol groups of silicagels obtained by hydrothermal treatment of hydrated gels. Zh. Fizk. Khim.40: 520–25 (1966).
28. H. E. Hauck and W. Jost. Packing and Stationary Phases in
Chromatographic Techniques. K. K. Unger, Ed. Marcel Dekker,
New York, NY, 1990, p. 251.
Manuscript received December 5, 2007; revision received January 25, 2008.