BAŞKENT UNIVERSITY
INSTITUTE OF SCIENCE AND ENGINEERING
OPTIMIZED WEIGHTED ENSEMBLE CLASSIFIER FOR
INTRUSION DETECTION APPLICATION
ATİLLA ÖZGÜR
PhD THESIS 2017
OPTIMIZED WEIGHTED ENSEMBLE
CLASSIFIER FOR INTRUSION DETECTION
APPLICATION
ENİYİLENMİŞ AĞIRLIKLI SINIFLANDIRICI
TOPLULUĞU İLE SALDIRI TESPİT
UYGULAMASI
Atilla ÖZGÜR
Thesis Submitted
in Partial Fulfillment of the Requirements For the Degree of Doctor of Philosophy
in Department of Electrical and Electronics Engineering at Başkent University
This thesis, titled: ”OPTIMIZED WEIGHTED ENSEMBLE CLASSIFIER FOR INTRUSION DETECTION APPLICATION”, has been approved in partial fulfillment of the requirements for the degree of DOCTOR OF PHILOSOPHY IN DEPARTMENT ELECTRICAL AND ELECTRONICS ENGINEERING, by our jury, on 11/05/2017
Chairman:
Associated Professor Hasan Şakir BİLGE
Member:
Associated Professor Mustafa DOĞAN
Member (Supervisor):
Associated Professor Hamit ERDEM
Member:
Assistant Professor Fatih NAR
Member:
Assistant Professor Mustafa SERT
APPROVAL ../../2017
Prof. Dr. Emin AKATA
BAŞKENT ÜNİVERSİTESİ FEN BİLİMLERİ ENSTİTÜSÜ YÜKSEK LİSANS / DOKTORA TEZ ÇALIŞMASI ORİJİNALLİK
RAPORU
Tarih:30 /05/ 2017 Öğrencinin Adı, Soyadı : Atilla Özgür
Öğrencinin Numarası :20820015
Anabilim Dalı : Elektrik Elektronik Mühendisliği Programı : Doktora
Danışmanın Unvanı/Adı, Soyadı : Doç. Dr. Hamit Erdem
Tez Başlığı : Eniyilenmiş Ağırlıklı Sınıflandırıcı Topluluğu ile Saldırı Tespit Uygulaması
Yukarıda başlığı belirtilen Doktora tez çalışmamın; Giriş, Ana Bölümler ve Sonuç Bölümünden oluşan, toplam 94 sayfalık kısmına ilişkin, 30 / 05/ 2017 tarihinde şahsım tarafından turnitin adlı intihal tespit programından aşağıda belirtilen filtrelemeler uygulanarak alınmış olan orijinallik raporuna göre, tezimin benzerlik oranı %4’tür.
Uygulanan filtrelemeler: 1. Kaynakça hariç 2. Alıntılar hariç
3. Beş (5) kelimeden daha az örtüşme içeren metin kısımları hariç
4. Tez çalışmasından çıkarılmış, yazarları (Atilla Özgür ve Hamit Erdem) olan preprint (https://peerj.com/preprints/1954/) hariç
“Başkent Üniversitesi Enstitüleri Tez Çalışması Orijinallik Raporu Alınması ve Kullanılması Usul ve Esaslarını” inceledim ve bu uygulama esaslarında belirtilen azami benzerlik oranlarına tez çalışmamın herhangi bir intihal içermediğini; aksinin tespit edileceği muhtemel durumda doğabilecek her türlü hukuki sorumluluğu kabul ettiğimi ve yukarıda vermiş olduğum bilgilerin doğru olduğunu beyan ederim.
Öğrenci İmzası:……….
Onay 30 /05 / 2017
ACKNOWLEDGMENTS
I would like to dedicate this thesis to my late grandmother Reyhane Dereli and my grandfather İbrahim Dereli. They taught me nothing is impossible if you put enough effort.
My heartfelt appreciation goes to my family: My wife Funda and my daughter Duru.
I would like to express my deepest gratitude to my thesis advisor Hamit Erdem for his guidance, advice, criticism, encouragement, and insight throughout the thesis.
ABSTRACT
OPTIMIZED WEIGHTED ENSEMBLE CLASSIFIER FOR INTRUSION DETECTION APPLICATION
Atilla ÖZGÜR
Başkent University
The Department of Electrical and Electronics Engineering
Computer and communication systems become the foundations of modern life. With the advances in the Internet, usage of these systems increases and intrusions against these systems increases too. Therefore, finding and preventing intrusions against these systems becomes more and more important. To protect these systems, Intrusion Detection Systems (IDS) are implemented. In recent years, machine learning and optimization techniques are increasingly used in IDS. New methods are implemented using KDD99 and its derivative NSL-KDD datasets based on intelligent IDS systems in this thesis study. First, a detailed review is made on studies that uses above mentioned datasets, and according to this review, detailed statistics are derived on usage of these datasets. Next, two different methods are proposed for IDS. These methods are based on principles of classifier ensemble and hybrid IDS. In the first method, genetic algorithms (GA) are used for feature selection (an important part for classification) and ensemble weight finding. The proposed method is named as Genetic Algorithms based Feature Selection and Weights Finding (GA-FS-WF). In the second method, hybrid ensemble classifier subject re-visited again. In this method, convex optimization techniques are used for finding weights for ensemble classifiers. Proposed method models weights finding in ensemble as a mathematical objective function and solves it as an optimization problem. In both proposed methods, full dataset NSL-KDD is used. Success of proposed methods are measured with classifier performance metrics and compared with similar methods in the literature.
KEYWORDS: Feature Selection, Classifier Fusion,Genetic Algorithms, Intrusion Detection Systems, Machine Learning, Convex Optimization, Convex Relaxation.
Advisor: Assoc Prof. Hamit ERDEM, Başkent University, Department of Electrical and Electronics Engineering.
ÖZ
ENİYİLENMİŞ AĞIRLIKLI SINIFLANDIRICI TOPLULUĞU İLE SALDIRI TESPİT UYGULAMASI
Atilla ÖZGÜR
Başkent Üniversitesi
Elektrik Elektronik Mühendisliği Anabilim Dalı
Bilgisayar ve iletişim sistemleri modern hayatın temellerini oluşturmaktadır. Internet ağının gelişmesiyle birlikte bu sistemlerin kullanımında büyük artışlar olmakta, ancak bu sistemlere yönelik saldırılar da aynı oranda artmaktadır. Bu yüzden, söz konusu sistemlerin saldırılara karşı korunması ve gelen saldırıların tespiti giderek önem kazanmış ve bu amaçla Saldırı Tespit Sistemleri (STS) geliştirilmiştir. Son yıllarda STS’lerde makine öğrenmesi ve eniyileme tekniklerinin kullanımı giderek artmaktadır. Bu tez çalışmasında özgün STS yöntemleri önerilmiş ve önerilen bu yöntemler KDD99 ve türevi NSL-KDD veri setleri kullanılarak doğrulanmıştır. STS çalışmaları üzerinde yapılan detaylı literatür taraması sonucuna göre, bu veri setlerinin makine öğrenmesi alanında kullanımına yönelik detaylı istatistikler çıkarılmıştır. Çalışmanın devamında, STS için iki farklı sınıflandırıcı füzyon yöntemi geliştirilmiştir. Genetik Algoritma tabanlı Nitelik Seçme ve Ağırlık Bulma (GA-NS-AB) olarak adlandırılan ilk yöntemde, sınıflandırıcı çalışmaları için önemli bir aşama olan nitelik çıkarma ve sınıflandırıcı füzyonu ağırlık bulma işlemleri, Genetik Algoritmalar (GA) kullanılarak gerçekleştirilmiştir. İkinci yöntemde ise sınıflandırıcı ağırlıklarını bulma problemi, eniyileme problemi olarak modellenmiş ve yeni bir maliyet fonksiyonu tanımlanmıştır. Bu fonksiyonun çözümü için dışbükey gevşetme ve dışbükey eniyileme yöntemleri kullanılmıştır. Geliştirilen her iki yöntemde de NSL-KDD veri setinin tamamı kullanılırken, yöntemlerin başarısı benzer yöntemlerle karşılaştırılmıştır.
ANAHTAR SÖZCÜKLER: Nitelik Seçme, Sınıflandırıcı Füzyonu, Genetik Algoritma, Saldırı Tespit Sistemleri, Makine Öğrenmesi, Dışbükey Eniyileme, Dışbükey Gevşeme.
Danışman: Doç. Dr. Hamit ERDEM, Başkent Üniversitesi, Elektrik Elektronik Mühendisliği Bölümü.
TABLE OF CONTENTS
Page
ABSTRACT i
ÖZ ii
TABLE OF CONTENTS iii
LIST OF FIGURES v
LIST OF TABLES vi
LIST OF ACRONYMS vii
1 INTRODUCTION 1
1.1 History of cyber attacks . . . 1
1.2 Why cyber attacks increase . . . 2
1.3 Intrusion detection systems . . . 2
1.4 Contributions of this thesis . . . 3
2 RELATED WORKS 6 2.1 Chapter introduction . . . 6
2.2 Related reviews about KDD99 and IDS . . . 10
2.3 How review articles are selected? . . . 12
2.4 Datasets: DARPA, KDD99, and NSL-KDD . . . 13
2.4.1 DARPA dataset . . . 14
2.4.2 KDD99 dataset . . . 14
2.4.3 NSL-KDD dataset . . . 15
2.5 General machine learning work flow using KDD99 . . . 17
2.6 KDD99 descriptive statistics . . . 18
2.6.1 Classification output Classes in the reviewed studies . . . 19
2.6.2 Training and testing dataset usage . . . 19
2.6.3 Cross validation . . . 20
2.6.4 Dataset sizes used in training and testing ML algorithms . . . . 20
2.6.5 Applied algorithms in proposed methods . . . 20
2.6.6 Classifiers used for comparison . . . 21
2.6.7 Software used in reviewed studies . . . 23
2.6.8 Different datasets used in reviewed studies . . . 23
2.6.10 Main IDS type according to reviewed Studies . . . 26
2.6.11 IDS vs not IDS studies . . . 26
2.7 Suggested checklist for avoiding common mistakes . . . 27
2.8 Chapter discussion . . . 28
3 GENETIC ALGORITHMS BASED FEATURE SELECTION AND CLASSIFIER ENSEMBLE 30 3.1 Chapter introduction . . . 30
3.2 Materials and methods . . . 33
3.2.1 NSL-KDD and KDD99 datasets . . . 33 3.2.2 Classifier performance . . . 34 3.2.3 Feature selection . . . 35 3.2.4 Classifier ensembles . . . 35 3.2.5 Genetic algorithms . . . 36 3.2.6 Proposed method . . . 36
3.3 Simulation study and results . . . 39
3.3.1 Comparison with literature . . . 42
3.4 Results and chapter discussion . . . 43
4 SPARSITY-DRIVEN WEIGHTED ENSEMBLE CLASSIFIER 45 4.1 Chapter Introduction . . . 45
4.1.1 Related works: ensembles that combine pre-trained classifiers 47 4.2 Sparsity-driven weighted ensemble classifier . . . 50
4.3 Experimental results . . . 59
4.3.1 Experimental results: sparsity . . . 59
4.3.2 Computational Complexity Analysis . . . 62
4.4 Chapter discussion . . . 63
5 CONCLUSION 64
LIST OF FIGURES
Page
Figure 1.1 CVE common vulnerabilities and exposures by year . . . . 2
Figure 1.2 Most common IDS structure in literature . . . 3
Figure 1.3 KDD99 dataset usage by years . . . 4
Figure 1.4 NSL-KDD dataset usage by years . . . 4
Figure 2.1 KDD99 dataset usage by years . . . 8
Figure 2.2 Word cloud generated from titles of reviewed . . . 8
Figure 2.3 The relation between main and extracted datasets . . . . 13
Figure 2.4 NSL-KDD dataset usage by years . . . 16
Figure 2.5 General machine learning flow chart . . . 16
Figure 2.6 KDD99 training usage sizes . . . 21
Figure 2.7 KDD99 testing usage sizes . . . 21
Figure 2.8 Article counts by methodology . . . 26
Figure 2.9 IDS and Not IDS articles in 2010–2017 . . . 27
Figure 3.1 IDS and ML articles counts published in SCI indexed journals 31 Figure 3.2 Multi classifier ensemble . . . 36
Figure 3.3 Proposed method flowchart . . . 37
Figure 3.4 Binary genome . . . 37
Figure 3.5 Fitness functions of example GA runs . . . 40
Figure 3.6 Accuracy of ensembles: classifier size vs regression lines 41 Figure 4.1 Sign function approximation using equation 4.3 . . . 53
Figure 4.2 Adaptive gamma (γ1) L1Approximation with different ϵ values 55 Figure 4.3 Minimization of the cost function for 4 datasets . . . 58
Figure 4.4 Datasets and their sparsity levels . . . 60
Figure 4.5 Sparsity vs accuracy of SDWEC. . . 61
LIST OF TABLES
Page
Table 1.1 Survey of security tools used . . . 3
Table 2.1 DARPA, KDD99, and NSL-KDD datasets information . . . 13
Table 2.2 KDD99 attack distribution . . . 15
Table 2.3 Reviewed articles regarding to ML model Figure 2.5 . . . . 18
Table 2.4 Comparison of reviewed studies on classification output . 19 Table 2.5 Confusion matrix for training and test set Usage . . . 19
Table 2.6 Most used algorithms in the literature . . . 22
Table 2.7 Classifiers used for comparison in the reviewed studies . . 23
Table 2.8 Software used in the reviewed articles . . . 24
Table 2.9 Most used datasets . . . 24
Table 2.10 Performance metrics used . . . 25
Table 2.11 Journals and article counts . . . 29
Table 3.1 Methods used in IDS and machine learning . . . 32
Table 3.2 Dataset information . . . 34
Table 3.3 Dataset information used in experiments . . . 34
Table 3.4 Confusion matrix . . . 34
Table 3.5 Genetic algorithms hyper parameters . . . 38
Table 3.6 Classifier ensemble performance values . . . 40
Table 3.7 Effect of feature selection to classification accuracy . . . . 41
Table 3.8 Single classifiers accuracy values: effect of GA feature selection . . . 42
Table 3.9 Effect of feature selection to training and testing time . . . 42
Table 3.10 ANOVA and t-test statistical tests results . . . 43
Table 3.11 Comparison of proposed method with the literature . . . . 43
Table 3.12 Features and how many times they are selected in experiments . . . 44
Table 4.1 Ensemble weights finding studies that use pre-trained classifiers . . . 47
Table 4.2 Comparison of accuracies . . . 61
Table 4.3 Computational complexity of SDWEC . . . 62
Table 4.4 SDWEC training time on various datasets, . . . 63
LIST OF ACRONYMS and ABBREVIATIONS
ANOVA Analysis of variance CPU Central Processing Unit CRF Conditional Random Field
DARPA Defense Advanced Research Projects Agency DOS Denial of Service
ELM Extreme Learning Machines FN False Negative
FP False Positive
FPGA Field-programmable gate array
GA-FS-WF Genetic Algorithms based Feature Selection and Weights Finding GA Genetic Algorithms
IDS Intrusion Detection Systems
IEEE Institute of Electrical and Electronics Engineers ISCX An IDS dataset.
KDD99 An IDS dataset derived from DARPA dataset. KDD Knowledge Discovery in Databases
KNN K-nearest Neighbor ML Machine Learning MLP Multi Layer Perceptron MLR Machine Learning Research
MOA Massive Only Analysis, a data stream mining library NI No Information
NP Non-deterministic Polynomial-time
NSL-KDD An IDS dataset derived from KDD99 dataset.
QFWEC Weighted Classifier Ensemble based on Quadratic Form ROC Receiver operating characteristic
SCI Science Citation Index
SDWEC Sparsity Driven Weighted Ensemble Classifier SMO Sequential Minimal Optimization
SVM Support Vector Machines TCP Transmission Control Protocol TN True Negative
TP True Positive
UCI University of California Irvine WMV Weighted Majority Voting
1. INTRODUCTION
1.1. History of cyber attacks
Theoretical background of computer viruses was introduced by Neumann in his seminal paper [1], ”Theory of self-reproducing automata” in 1966. First practical viruses are written in between 1970 to 1980. First viruses were mostly harmless programs, written on a whim of programmers. Their developers were trying to investigate the conceptual limits of computers. All of them were easily cleaned [2]. First known computer virus is written by Bob Thomas. This virus copied itself between nodes of Arpanet– forerunner of Internet. When this program was written, the computer virus concept did not exist; nevertheless, it is generally accepted as the first computer virus [3].
Between 1980 and 1990, first wave of computer viruses started. In 1983, Cohen wrote the first article about computer viruses, giving both source code and theoretical background [4]. Cohen performed a number of experiments in different operating systems, and proved that virus concept is independent of programming language and operating system. Given suitable conditions, a virus can propagate very easily. Although first computer viruses and worms were written for mainframe and Unix systems, they found their fertile grounds in MS-DOS and windows systems. Most of these viruses were boot-sector viruses [3].
After 1990 to 2000, second wave of computer viruses started. Although viruses was dominant in first wave, with the advent of Internet and email, worms become more dominant [3].
After 2000 to today, attacks of viruses and worms become a common phenomena, and malware infestations become very common. All types of malware use vulnerabilities of applications and operating systems. Since writing programs and applications become more and more complex, vulnerabilities in programs will not decline. Recent numbers from Common Vulnerabilities and Exposures (CVE) in Figure 1.1 support this.
Figure 1.1 CVE common vulnerabilities and exposures by year [5]. (Year 2017 values includes first 4 months only.)
1.2. Why cyber attacks increase
The increase in number of attacks and number of incidents are due to two reasons. The first reason is that Technology favor attackers. Anderson showed that an attacker needs to find only one bug to gain a more favorable position.
Even a very moderately resourced attacker can break anything that’s at all large and complex. There is nothing that can be done to stop this, so long as there are enough different security vulnerabilities to do statistics. Anderson[6]
The second reason is that hacking and cracking became profitable businesses. That is most computer crimes are professionalized. There are web sites [7] that offer Distributed Denial of Services (DDOS) attacks. In some forums, you can buy DDOS attacks as cheap as $5 per day [8] compared to $100 per day in 2009 [9].
1.3. Intrusion detection systems
As can be seen from above discussion, cyber attacks will not decline in foreseeable future therefore security tools will gain more and more importance. Different security tools can be seen in Table 1.1.
Table 1.1 Survey of security tools used [10]
Tool Used Percentage in Participants
Anti-virus software 86.0%
Firewalls 80.7%
Data encryption (data in transit) 64.0% Audit logs of each access records 60.0% Data encryption (data at rest) 58.7% Patch and vulnerability management 57.3% Intrusion detection systems (IDS) 54.0% Network monitoring tools 52.7% Mobile device management (MDM) 52.0%
User access controls 50.7%
Intrusion detection and prevention systems 48.0%
Access control lists 47.3%
Single sign on 47.3%
Web security gateway 41.3%
Multi-factor authentication 39.3% Messaging security gateway 37.3% Data loss prevention (DLP application) 36.0%
Intrusion Detection Systems (IDS) are increasingly used in enterprises. Most common IDS structure in literature is given in Figure 1.2. According to this structure, most used datasets in the IDS research is KDD99 and its derivative NSL-KDD.
Figure 1.2 Most common IDS structure in literature
1.4. Contributions of this thesis
As mention before, the most used IDS dataset in the literature is KDD99 and its derivative NSL-KDD. Usage of KDD99 can be seen in Figure 1.3 and usage of
NSL-KDD can be seen in Figure 1.4. We review these datasets and derive detailed statistics in their usage in intrusion detection and machine learning in Chapter 2. The following descriptive statistics about the reviewed studies are given in Chapter 2: main contribution of these articles, applied algorithms, compared classification algorithms, software toolbox usage, the size and type of the used dataset for training and testing, and classification output classes (binary, multi-class).
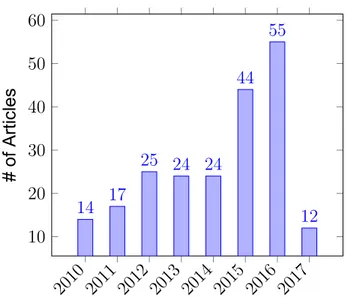
2010 2011 2012 2013 2014 2015 2016 2017 10 20 30 40 50 60 14 17 25 24 24 44 55 12 # of Articles
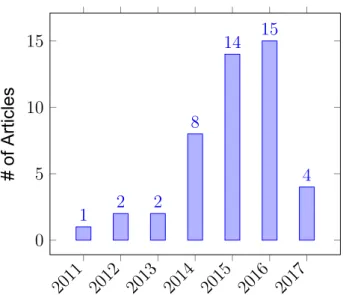
Figure 1.3 KDD99 dataset usage by years. (Year 2017 values includes first 4 months only.) 2011 2012 2013 2014 2015 2016 2017 0 5 10 15 1 2 2 8 14 15 4 # of Articles
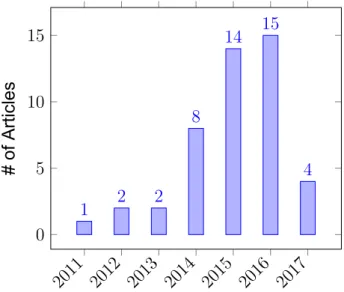
Figure 1.4 NSL-KDD dataset usage by years. (Year 2017 values includes first 4 months only.)
The most used methods in IDS articles are hybrid methods, see Table 2.3. In the following chapters, we propose two different hybrid methods for IDS. In the chapter 3, we propose a method that combines classifier ensemble and feature selection using
genetic algorithms named ”GA-FS-CE: Genetic Algorithms based Feature Selection and Classifier Ensemble”. In the chapter 4, another weighted classifier ensemble that uses convex optimization methods for finding weights of classifier ensemble are proposed. Problem of weights finding is formulated using objective function that consists of data term, sparsity term and non-negativity constraint on the weights. Both of these methods are tested on NSL-KDD dataset.
2. RELATED WORKS
Although KDD99 dataset is more than 17 years old, it is still widely used in Machine Learning Research (MLR) and Intrusion Detection Systems (IDS). This study reviews 215 research articles from 90 journals indexed in Science Citation Index Expanded between 2010 and 2016. If papers presented in other indexes and conferences are included, number of studies would be much higher. The number of published studies shows that KDD99 is the most used dataset in IDS and machine learning areas, and it is the de facto dataset for these research areas. To show recent usage of KDD99 and the related sub-dataset (NSL-KDD) in IDS and MLR, the following descriptive statistics about the reviewed studies are given: main contribution of articles, the applied algorithms, compared classification algorithms, software toolbox usage, the size and type of the used dataset for training and testing, and classification output classes (binary, multi-class). All of the results are easily reproducible since they are created from provided bibliography file using python scripts. These python scripts and bibliography file are published in an open source repository. In addition to these statistics, a checklist for future researchers has been provided.
2.1. Chapter introduction
Internet, mobile, e-commerce, communication, and information systems have become essential parts of our daily life. Wide usage of these systems makes communication easier, increases data transfer and information sharing, and improves life quality. Although these systems are used in many fields, they suffer from the various attacks such as viruses, worms, or Trojan horses. Due to importance of these systems, these attacks must be identified and stopped as soon as possible. Research about finding attacks and removing their effects have been defined as Intrusion Detection Systems (IDS) [11].
IDS studies can be considered as classification tasks that separate normal behavior of networks from attacks. After the first paper about IDS [12], thousands of studies have been published in this domain. Machine learning and data mining algorithms are widely used in IDS. Most of the machine learning and data mining algorithms are based on the assumption that problem space does not change very fast. But in IDS domain, attackers continuously change and improve their capabilities [13]. Due to this reason, even though machine learning and data mining algorithms are very successful in other domains, their performance degrades in IDS. Thus, IDS is an unsolved problem since this domain is evolving continuously [13].
Similar to other classification and clustering problems, IDS algorithms need training dataset. Although standard datasets are available for other fields, there is no up-to-date standard dataset for IDS. Lack of an up-to-date standard dataset for IDS research has been mentioned by numerous studies [14, 13, 15]. Recent reviews [16, 17, 18, 19] also identify this problem as a research gap. Nonetheless, KDD99 is the most used dataset in IDS domain [20, 21, 22]. According to survey paper of [19], more than 50% of reviewed papers used DARPA/KDD99 in their studies.
Created in 1999 [23], KDD99 has been widely used in many studies for the past 17 years and cited in many studies —Reference article for KDD99 preparation [23] has been cited 943 times according to Google Scholar (May 2017). Moreover, 215 research articles that used KDD99 were published in Science Citation Index Expanded journals from 2010 to present, Table 2.11. Interestingly, KDD99 usage seems to increase in recent years, most probably due to increase in popularity of IDS, Figure 2.1.
According to the results, KDD99 dataset is primarily used in IDS and machine learning research. Additionally, this dataset also has been used for other purposes, such as feature selection and data streams. Based on the 215 published studies, 171 of them has been applied to IDS and 44 of them has not been applied to IDS. From these 215 published studies, 197 of them are machine learning studies. Of these 197 studies, 161 of them are both machine learning and IDS, while 36 are machine learning studies that do not claim to work on IDS. These numbers shows that KDD99 dataset is the main intersection of machine learning research, IDS, and information security.
Although KDD99 has been used in many IDS and machine learning studies, no review study exists that evaluate and analyze the published research and answer the following questions:
• Which machine learning algorithms and IDS methods are used mostly? • What is the training and testing dataset usage in the published studies? • What are the sizes of training and testing dataset in proposed studies? • How many classes have been considered in IDS classification?
• Which performance metrics have been used to measure the results of the classification?
2010 2011 2012 2013 2014 2015 2016 2017 10 20 30 40 50 60 14 17 25 24 24 44 55 12 # of Articles
Figure 2.1 KDD99 dataset usage by years. (Year 2017 values includes first 4 months only.)
Figure 2.2 Word cloud generated from titles of reviewed 215 research articles.
• Which software tools have been used for implementation and comparison?
To answer these questions, the proposed study reviews 215 studies from 2010 to present focusing on KDD99 usage statistics. We think that the results of the proposed study will be useful for the other researchers who plan to use this dataset in IDS or machine learning studies. All of the results are derived from a bibliography file using python scripts that are published in open source github repository (https: //github.com/ati-ozgur/KDD99ReviewArticle).
This review differs from the previous review articles considering following aspects: First, most of the reviews in this domain try to include critical papers and explain major approaches. In contrast, our study tries to be comprehensive. Second, only articles indexed in Science Citation Index are included, Table 2.11. No conference articles or articles from other indexes are included in this study. If a journal is removed from Science Citation Index in a year, only articles that are indexed in Science Citation Index are included in this study. To show this aspect, provided bibliography file contains Web of Science number (Accession Number or WOS-number) for all of the articles. We believe that our study includes most of the SCI-indexed studies that used KDD99. Third, comprehensive descriptive statistics about KDD99, machine learning and IDS are given. Some of these statistics are as follows:
1. KDD99 has been analyzed considering number of output classes, training and testing datasets in reviewed studies, Table 2.4 and Table 2.5.
2. Main contribution that concerns on the applied method using KDD99. The applied methods may be clustering, classification, feature selection/reduction algorithms. All the applied methods in the focused period has been evaluated and presented in Table 2.3.
3. The usage frequency of machine learning and IDS algorithms has been presented in Table 2.6 and discussed in detail.
4. Proposed algorithms are implemented and compared with standard algorithms using variety of software packages (Table 2.8).
5. Training and testing dataset sizes and classification types (binary, multi-class). 6. Most of the reviewed articles compare their proposed method with other
classifiers. These classifiers have been shown in Table 2.7 and discussed. 7. Although, KDD99 and derived sub-set NSL-KDD dataset have been used in
recent studies, some studies compared their results with other datasets. These other datasets and their usage statistics are given in Table 2.9
8. Categorizing the main theme of the published article in three main groups as Machine Learning, Anomaly Detection or Alert Correlation has been presented in Figure 2.8.
Fourth, considering collected statistics, strengths and weaknesses of reviewed articles, a checklist is provided. Fifth, comprehensive bibliography file about
reviewed articles are provided. This file can also be used other purposes. For example: (a) Figure 2.2 word cloud from titles are generated from this bibliography file, (b) which datasets are used in data stream studies in addition to KDD99, (c) which algorithms are commonly used in artificial immune systems in KDD99. Finally, the findings of this study would be useful for researchers who may want to use KDD99 or a similar big dataset in their research since KDD99 is one of the biggest datasets in University of California Irvine (UCI) machine learning repository.
The remainder of the chapter is organized as follows: Section 2.2 considers similar related reviews. Section 2.4 gives definitions and history of DARPA, KDD99 and NSL-KDD datasets. Section 2.5 gives a general machine learning model that most reviewed articles use with KDD99 and evaluates contribution of reviewed articles considering the structure of the presented model. Section 2.6 gives descriptive statistics about general KDD99 usage along with figures and tables. Section 2.7 suggests a checklist considering common mistakes and strengths of the reviewed articles for further studies to improve the quality of similar studies. Finally, section 2.8 discusses the results of this chapter.
2.2. Related reviews about KDD99 and IDS
Most of the IDS reviews try to find prominent papers about the subject and summarize them. This approach provides fast learning opportunity for the reader. In contrast to previous review studies, this study follows a different approach. This study provides descriptive statistics that would be useful to researchers who may want to use KDD99 in their research.
One of the most similar review to ours has been presented by Tsai et al.. Their study evaluated 55 articles between 2000 and 2007 that focused on intersection of IDS and machine learning. First, they give definition of the most used single classifiers in machine learning for IDS containing k-nearest neighbor, support vector machines, artificial neural networks, self-organizing maps, decision trees, naive bayes, genetic algorithms, fuzzy logic, hybrid classifiers, and ensemble classifiers. Second, they provide yearly statistics for these categories. Third, they investigate the used dataset in the proposed period. According the study, KDD99 has been used nearly 60% of the published studies. To expand the published review that included 55 articles, our study reviews 215 articles (Section 2.6), and includes more statistics.
these methods, ant colony optimization, ant colony clustering and particle swarm optimization have been compared in their review. Only descriptive statistic included in their study was performance comparison of swarm intelligence techniques in IDS.
Liao et al. [25] categorized IDS systems according to detection approaches (statistics, pattern, rule,state and heuristic based), detection methodology (anomaly detection, signature based and stateful protocol analysis.) They also gave information about whether IDS are time series based and used data source (network or host based). Their taxonomy also included other characteristics of IDS in their study. Instead of giving summary statistics about IDS characteristics, they summarized all information about 30 IDS articles in a table. According to Liao et al., swarm intelligence, immune systems, data mining, genetic algorithms and other machine learning techniques were widely used. Different from Liao et al., we give precise statistics about used algorithms in IDS studies.
Ganapathy et al. [20] reviewed intersection of feature selection and intelligent algorithms in Intrusion Detection. For feature selection, gradually feature removal method, modified mutual information-based feature selection algorithm, CRF-based feature selection, and wrapper based genetic feature selection methods have been compared. Regarding to classification techniques, Ganapathy et al. compared neural networks, genetic algorithms, fuzzy sets, rough sets, Neuro-Fuzzy, fuzzy-genetic algorithms and particle swarm optimization. They did not give any statistics about reviewed studies.
Modi et al. [26] reviewed cloud based IDS systems. According to their survey, intelligent techniques (artificial neural networks, fuzzy logic, association rules, support vector machines, genetic algorithms, hybrid techniques) were widely used in cloud based IDS. Our study shows similar results as can be seen in Table 2.6.
Yang et al. [27] had surveyed artificial immune systems in IDS. They reviewed the concepts antibody/antigen encoding, generation algorithm, evolution algorithm but did not provide any statistics about the reviewed articles.
Elsayed et al. [28] had surveyed evolutionary and swarm intelligence algorithms in network intrusion detection using DARPA and KDD99. They investigated usage of genetic algorithms, genetic programming, ant colony optimization and swarm optimization for different stages of IDS. They presented a few descriptive statistics for evaluating the reviewed articles. First statistics is commonly used fitness functions, second statistics is articles’ dataset usage, third statistics is the applied algorithm,
and the last statistics is detection rate of the applied algorithm.
Ahmed et al. [19] have surveyed network anomaly detection techniques. They categorize techniques as classification, statistical based, information theory, and clustering. Most of the reviewed papers, more than 50%, uses DARPA/KDD99. Lack of recent dataset problem and problems of DARPA/KDD99 are given special attention. Descriptions for other available datasets for network anomaly detection domain are provided.
Folino and Sabatino [29] have reviewed ensemble based techniques in intrusion detection. They provided following metrics: datasets used, main algorithms used, ensemble method, and performance metrics. Most of the reviewed articles use KDD99 in their studies.
The above mentioned studies show that intersection of IDS and Machine Learning is actively researched and KDD99 is the most used dataset in this domain. However, they do not provide enough statistics about this dataset. This study tries to present more comprehensive study to find satisfactory answers to the mentioned questions by giving more statistics and checklist for guidance.
2.3. How review articles are selected?
KDD99 is an old dataset and used in very different domains, in addition to Intrusion Detection. To find relevant articles via primary search engines, the following key words are used:
1. Intrusion Detection 2. KDD 99, KDD99 3. Anomaly Detection 4. Data Stream Learning
The names of the search engines used are the following:
1. Thomson Reuters (Web of Knowledge)http://apps.webofknowledge.com 2. Elsevier Science Direct http://www.sciencedirect.com/
3. Springer Link (Springer) http://link.springer.com/advanced-search 4. IEEEhttp://ieeexplore.ieee.org
5. Wileyhttp://onlinelibrary.wiley.com/advanced/search 6. Taylor and Francis Online http://www.tandfonline.com
The articles that use DARPA dataset, instead of KDD99 are ignored in this study. We did not include any articles from conferences, book chapters or lecture notes, only research articles. Every article’s journal is searched in Sci Expanded Database. We know that some of the articles may be missed in this way, but we believe that 95% of published articles are included in this review chapter. This shows that even though KDD99 is very old, it is still very widely used. We have included some articles that used KDD99 from different domains in this way. We have found total of 215 articles in our study from 2010–2017.
2.4. Datasets: DARPA, KDD99, and NSL-KDD
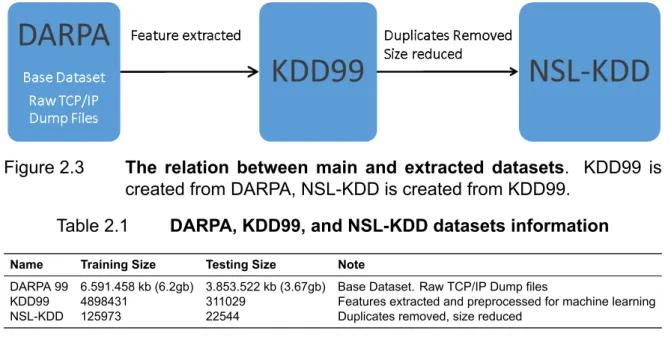
Figure 2.3 and Table 2.1 give overall summary for related datasets (DARPA, KDD99, and NSL-KDD) in this study. DARPA is a base raw dataset. KDD99 is the feature extracted version of DARPA dataset. NSL-KDD is the duplicates removed and size reduced version of KDD99 dataset. Dataset statistics extracted from reviewed articles are given in Section 2.6.
Figure 2.3 The relation between main and extracted datasets. KDD99 is created from DARPA, NSL-KDD is created from KDD99.
Table 2.1 DARPA, KDD99, and NSL-KDD datasets information Name Training Size Testing Size Note
DARPA 99 6.591.458 kb (6.2gb) 3.853.522 kb (3.67gb) Base Dataset. Raw TCP/IP Dump files
KDD99 4898431 311029 Features extracted and preprocessed for machine learning NSL-KDD 125973 22544 Duplicates removed, size reduced
2.4.1. DARPA dataset
MIT Lincoln LAB hosted DARPA-sponsored IDS-event in 1998 [30]. In this DARPA event, an attack scenario to an Air-Force base was simulated. One year later, in 1999, this event was repeated [31] with improvements suggested by computer security community [32]. DARPA dataset consists of host and network dataset files. Host dataset, IDS bag, is small dataset that contains system calls and is less used than its network counterpart. Network dataset consists of seven weeks of raw TCP/IP dump files. Since DARPA dataset consists of raw files, researchers need to extract features from these files to use them in machine learning algorithms. First two weeks were attack free; therefore, it is suitable for training anomaly detection algorithms. In the remaining five weeks, various attacks were used against simulated Air-Force base, [33]. KDD99 dataset was created from DARPA network dataset files by Lee and Stolfo [23] for this DARPA sponsored event.
2.4.2. KDD99 dataset
Lee and Stolfo [23], one of the participating teams of the DARPA event, gave their feature extracted and preprocessed data to Knowledge Discovery and Data Mining (KDD) yearly competition [34]. Pfahringer [35] won KDD 99 competition using mixture of bagging and boosting. Most articles compare their results with his result. KDD99 can be easily used in machine learning studies; therefore, it is much more used in IDS and MLR than DARPA dataset.
KDD99 has the following characteristics:
1. KDD99 has two week’s of attacks-free instances and five week’s of attack instances, making it suitable for anomaly detection.
2. Output classes are divided into 5 main categories: DOS (Denial of Service), Probe, R2L (Root 2 Local), U2R (User 2 Root), and Normal.
3. KDD99 Dataset contains 24 attack types in training and 14 more attack types in testing for total of 38 attacks. These 14 new attacks theoretically test IDS capability to generalize to unknown attacks. At the same time, it is hard for machine learning based IDS to detect these 14 new attacks [36].
4. KDD99 is heavily imbalanced dataset to attack instances. Approximately 80% percent of flow is attack traffic (3925650 attack instances in total 4898430
instances). Normally, typical network contains approximately 99.99% percent of normal instances. KDD99 violates this principle. Most articles needs to re-sample dataset to conform to typical network normality assumption, particularly anomaly detection articles.
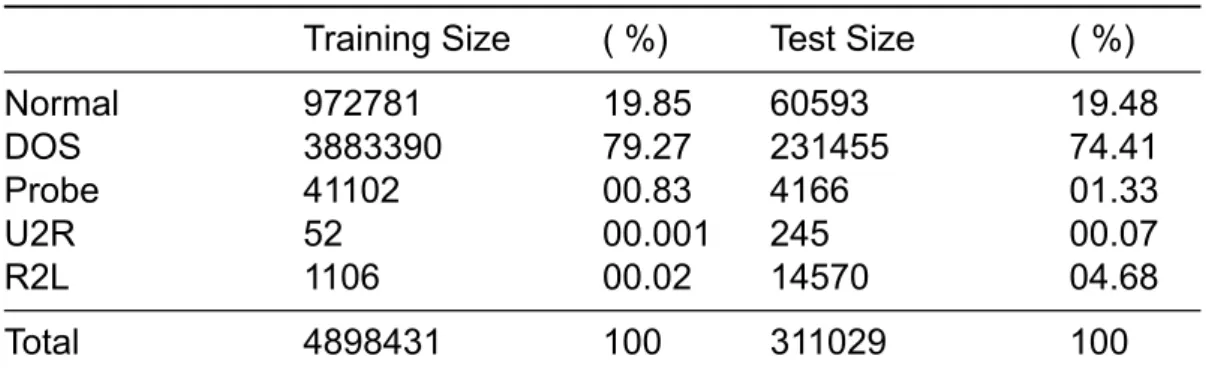
5. U2R and R2L attacks are very rare in KDD99 (Table 2.2).
6. Duplicate records in both training and testing datasets bias results for frequent DOS attacks and normal instances.
7. KDD99 is a large dataset; therefore, most studies use a small percentage of it. Following studies among reviewed articles [37, 38, 39, 40, 41, 42, 43, 44, 45, 46, 47, 48, 49] claim that KDD99 is a very large dataset for machine learning algorithms; correspondingly, they use very small percentage of KDD99.
Table 2.2 KDD99 attack distribution
Training Size ( %) Test Size ( %)
Normal 972781 19.85 60593 19.48 DOS 3883390 79.27 231455 74.41 Probe 41102 00.83 4166 01.33 U2R 52 00.001 245 00.07 R2L 1106 00.02 14570 04.68 Total 4898431 100 311029 100
Numerous shortcomings of KDD99 with respect to IDS are well documented in literature, [13, 50, 51, 52, 15].
2.4.3. NSL-KDD dataset
To reduce deficiencies of KDD99 dataset for machine learning algorithms, NSL-KDD dataset is introduced by [22]. NSL-KDD has been generated by removing redundant and duplicate instances; thus decreasing size of dataset. Since NSL-KDD is a re-sampled version of KDD99, IDS deficiencies remain. NSL-KDD is a very popular dataset in intersection of machine learning and IDS literature due to its small size compared to full KDD99 dataset. Usage of NSL-KDD is increasing in recent years, see Figure 2.4.
2011 2012 2013 2014 2015 2016 2017 0 5 10 15 1 2 2 8 14 15 4 # of Articles
Figure 2.4 NSL-KDD dataset usage by years. (Year 2017 values includes first 4 months only.)
Figure 2.5 General machine learning flow chart. Almost all of the reviewed articles make their contribution in steps 2a-2d and 3a-3d. Table 2.3 shows article counts for these contributions.
2.5. General machine learning work flow using KDD99
Figure 2.5 shows general machine learning work flow using any dataset. This work flow contains 3 main steps relevant to our discussion. These are step (1) feature extraction, step (2) preprocessing, and (step 3) training machine learning model. Normally, feature extraction step (1) is the most important step in machine learning [53]. As KDD99 is a feature extracted dataset, this step is unnecessary.
Most reviewed studies made their contributions to preprocessing step (2) or training machine learning model step (3). For Step (2) preprocessing, reviewed articles used 4 different techniques: (2a) Feature Selection, (2b) Feature Reduction or Feature Transformation, (2c) Clustering, and (2d) Hybrid Approaches. Feature selection (2a) is using various algorithms to reduce number of existing 41 features. Feature Transform/Reduction (2b) is to change feature space of dataset to another space, then optionally reduce number of transformed features. For example, principal component analysis is a popular choice among reviewed studies (Table 2.6). Clustering (2c) is reduce features or instances using a clustering algorithm, for example k-means clustering. Hybrid Approaches (2d-3a) is using combination of two different algorithms for preprocessing or training machine learning model step. Most of the time, a feature selection/reduction/machine learning algorithm is hybridized with an optimization algorithm (for example: particle swarm optimization).
For Step (3) training machine learning model, reviewed articles can be categorized using 4 different type of techniques: (3a) Hybrid Approaches, (3b) Ensemble, (3c) Layered, and (3d) New Algorithm Classifier. An example of Step (3a) Hybrid Approaches is training a neural networks with genetic algorithms instead of back propagation. Ensemble approach, Step (3b), is a parallel combination of different machine learning algorithms. Layering, Step (3c), is a serial combination of different machine learning algorithms. New Algorithm Classifier, Step (3d), means the applied algorithm may be entirely new or used the first time in IDS.
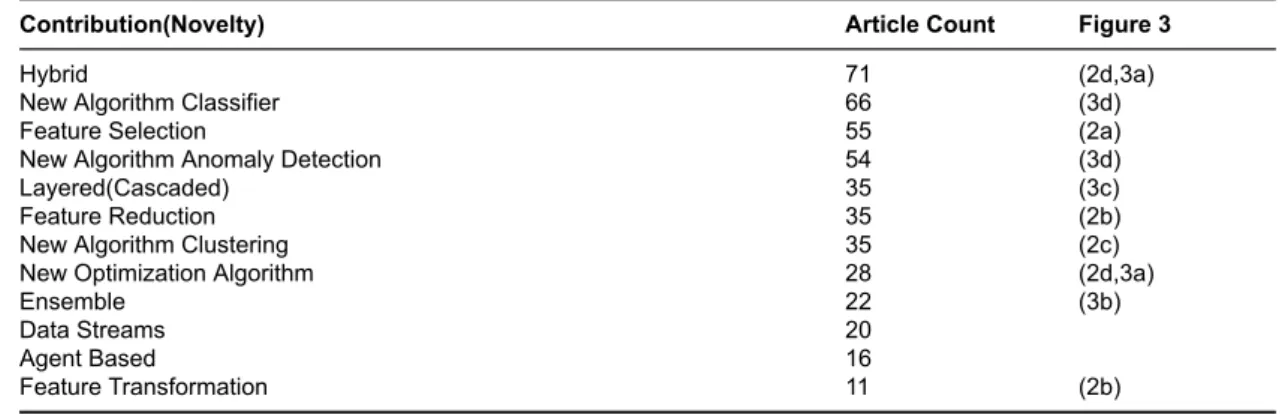
According to given work flow, contributions of the most reviewed articles may be more than two. For example, using a new optimization algorithm for feature selection and classification is counted as both feature selection and hybrid in this review. Also, using principal component analysis for feature reduction and using optimization algorithm to train a classifier is counted as both hybrid and feature reduction. Table 2.3 shows categorization of articles according to the work flow.
Table 2.3 Evaluating the reviewed articles regarding to machine learning model Figure 2.5
Contribution(Novelty) Article Count Figure 3
Hybrid 71 (2d,3a)
New Algorithm Classifier 66 (3d)
Feature Selection 55 (2a)
New Algorithm Anomaly Detection 54 (3d)
Layered(Cascaded) 35 (3c)
Feature Reduction 35 (2b)
New Algorithm Clustering 35 (2c)
New Optimization Algorithm 28 (2d,3a)
Ensemble 22 (3b)
Data Streams 20
Agent Based 16
Feature Transformation 11 (2b)
2.6. KDD99 descriptive statistics
Different from previous review studies, we present more descriptive statistics to evaluate published studies in focused period (2010–2016). Other extracted statistics are presented before such as Figure 2.1, Figure 2.4 and Table 2.3. In addition, the following statistics have been extracted from the reviewed 215 studies:
1. Classification output classes
2. Training and Testing Dataset Usage 3. Use of Cross Validation
4. Dataset sizes used in training and testing machine learning algorithms 5. Applied algorithms in proposed method
6. Classifiers used for comparison 7. Software Toolbox Usage
8. Other Datasets used in Reviewed Studies 9. Performance Metrics used in Experiments 10. IDS vs Not IDS
11. Main IDS Type according to study
These descriptive statistics are presented using figures and tables and have been discussed in detail.
2.6.1. Classification output Classes in the reviewed studies
The output classes can be binary or multi classes when machine learning algorithms are applied to the KDD99. Table 2.4 shows output classes in reviewed articles. Multi class 5 are DOS, Probe, Normal, U2R and R2L as explained in Section 2.4.2. Multi Class X selects subsets of 23 classes of KDD99, for example an output that consists of 7 attacks and normal gives results for 8 output classes. Multi Class X studies are not comparable to other studies.
Table 2.4 Comparison of the published studies based on classification output classes. Experiments in articles may have more than one output class such as Binary and Multiclass 5; therefore total article count in this table is more than 215
Classification Output Article
Count
Binary (Attack/Normal) 197
Multiclass 5 (DOS/Probe/U2R/R2L/Normal) 73
Multiclass 23 (22 attacks/Normal) 4
No Binary: Gives other result 8
Multi Class X (Subset of 23) 21
2.6.2. Training and testing dataset usage
Table 2.5 Confusion matrix for training and test set usage. Normally, only diagonal of matrix should have values, but most of the reviewed studies use KDD99 training dataset for both testing and training purposes.
KDD99
Training Test Reviewed Study Training 212 8
Test 161 58
Normally, in machine learning studies, datasets should be divided into training and testing datasets. Machine learning algorithms should be trained on training dataset and be tested on test dataset that is entirely separate from training datasets. Considering this usage, DARPA, KDD99 and NSL-KDD datasets contains two parts, training and testing. As mentioned before these two parts have different attacks and different probability distributions. Training a machine learning algorithm in a subset of KDD99 training dataset; then, testing trained model in another subset gives optimistic results. Generally, machine learning algorithms should be trained on KDD99 training dataset and tested on KDD99 testing dataset.
Table 2.5 shows training and testing dataset usage in the reviewed articles. Most reviewed articles (212) used KDD99 training dataset for training; but, 8 articles behaved differently. These 8 articles either merged training and testing dataset then re-sampled or used training dataset for testing purposes. The main reason for this type of dataset usage is to reduce difference between training and testing dataset. Only about 26% of reviewed articles (58) used real testing dataset. Others (161) used KDD99 training dataset as both testing and training purposes. This type of dataset usage provides optimistic, thus non-realistic results for these studies. Table 2.5 shows that most of the literature have used re-sampled version of KDD99 training dataset for both training and testing.
2.6.3. Cross validation
K-fold cross validation is one of the suggested techniques in training machine learning models. Among the reviewed 215 studies, only 45 (%20) studies applied cross validation, while 170 (%80) studies did not apply cross validation.
2.6.4. Dataset sizes used in training and testing ML algorithms
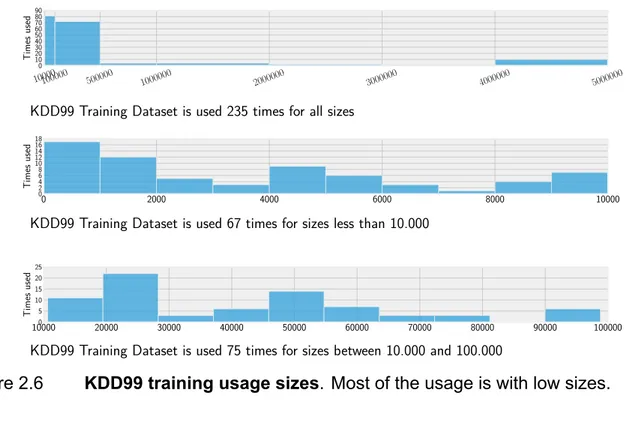
In this review, 12 articles claimed KDD99 is a large dataset for machine learning research and used smaller subset of full dataset. Figure 2.6 and Figure 2.7 shows that training and testing dataset usage is skewed to small sizes. That is, most articles worked with small dataset sizes in reviewed studies. The smallest 20 training datasets contain 100 to 1000 instances, while smallest 20 testing datasets contain 100 and 1112 instances. These numbers are small compared to full size (4.9 Million instances) KDD99 dataset. Using very small dataset sizes may be unacceptable from the viewpoint of statistical analysis.
Figure 2.7 shows testing dataset sizes used in reviewed articles. Figure 2.7 only shows usages of testing dataset that are less than full size (311029 instances).
2.6.5. Applied algorithms in proposed methods
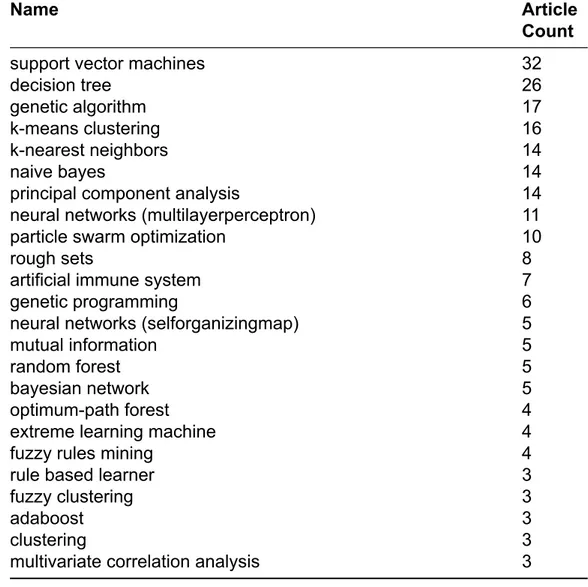
Various algorithms have been used in KDD99 based IDS research. Table 2.6 shows algorithms that are used by the reviewed studies. If a classifier, for example support vector machines, is used for comparison purposes, it is included in both Table 2.6 and Compared Classifiers Table 2.7.
10000100000 500000 1000000 2000000 3000000 4000000 5000000 0 10 20 30 40 50 60 70 80 90 Times used 0 2000 4000 6000 8000 10000 0 2 4 6 8 10 12 14 16 18 Times used 100000 20000 30000 40000 50000 60000 70000 80000 90000 100000 5 10 15 20 25 Times used
KDD99 Training Dataset is used 235 times for all sizes
KDD99 Training Dataset is used 67 times for sizes less than 10.000
KDD99 Training Dataset is used 75 times for sizes between 10.000 and 100.000
Figure 2.6 KDD99 training usage sizes. Most of the usage is with low sizes.
0 50000 100000 150000 200000 250000 300000 350000 0 20 40 60 80 100 120 Times used
Testing Usage Frequency (total of 197 times).
Figure 2.7 KDD99 testing usage sizes. Most of the low size usages comes from resampling of KDD99 Training dataset.
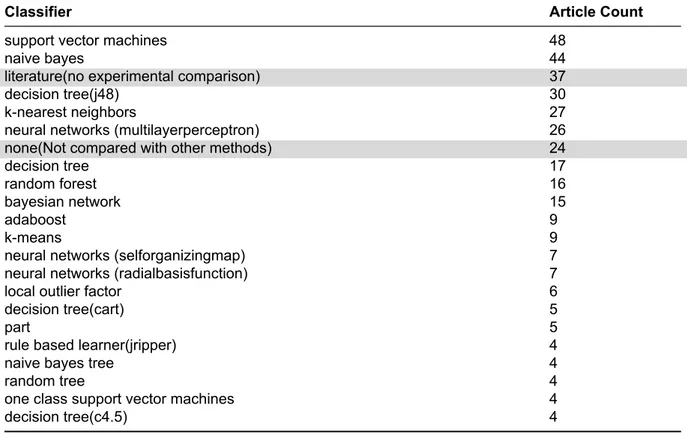
2.6.6. Classifiers used for comparison
Generally, most studies compare their results with other methods in their experiments. In KDD99 based machine learning research, most comparisons are made against other classifiers. Table 2.7 shows classifiers used for comparison in
Table 2.6 Most used algorithms in the literature. Algorithms used less than 3 are not shown.
Name Article
Count
support vector machines 32
decision tree 26
genetic algorithm 17
k-means clustering 16
k-nearest neighbors 14
naive bayes 14
principal component analysis 14
neural networks (multilayerperceptron) 11
particle swarm optimization 10
rough sets 8
artificial immune system 7
genetic programming 6
neural networks (selforganizingmap) 5
mutual information 5
random forest 5
bayesian network 5
optimum-path forest 4
extreme learning machine 4
fuzzy rules mining 4
rule based learner 3
fuzzy clustering 3
adaboost 3
clustering 3
multivariate correlation analysis 3
the reviewed studies. Some rare articles in this review were not machine learning articles, even though they use KDD99. These rare articles did not compare their suggested approaches with other classifiers. Also, some articles that proposed new methods for IDS, have not compared their proposed method with other classifiers. For these two types of articles, Table 2.7 includes None. For Literature entries, some articles did not compare their methods and their datasets using software toolboxes but only reported literature results. In our opinion, all machine learning IDS articles should use software toolboxes (Table 2.8) to compare their methods with common methods instead of only reporting literature results. Main reason for this advice is science reproducibility since every article is a bit different (sampling strategy, randomize seed, and different sizes for datasets).
Table 2.7 Classifiers used for comparison in the experiments of reviewed studies. Classifiers used less than 4 are not shown.
Classifier Article Count
support vector machines 48
naive bayes 44
literature(no experimental comparison) 37
decision tree(j48) 30
k-nearest neighbors 27
neural networks (multilayerperceptron) 26
none(Not compared with other methods) 24
decision tree 17
random forest 16
bayesian network 15
adaboost 9
k-means 9
neural networks (selforganizingmap) 7
neural networks (radialbasisfunction) 7
local outlier factor 6
decision tree(cart) 5
part 5
rule based learner(jripper) 4
naive bayes tree 4
random tree 4
one class support vector machines 4
decision tree(c4.5) 4
2.6.7. Software used in reviewed studies
Many software toolboxes has been used in IDS studies. Table 2.8 summarizes software used to implement or compare algorithms in the articles. Most articles (78) did not give any information about applied software. This restricts reproducibility of applied method. Based on Table 2.8, Weka is widely used for classifier comparison even if it is not used for implementation. Matlab and LibSVM are also used for comparison. Most of the proposed methods are implemented using general purpose programming languages. As a remarkable note, although Python (2) and R (1) are thought as the languages of data science and machine learning [54], they were among the least used tools.
2.6.8. Different datasets used in reviewed studies
In addition to KDD99, different datasets were also used in the reviewed articles, Table 2.9. Non IDS datasets in this review show that KDD99 is used as just another dataset in some studies. NSL-KDD is re-sampled version of KDD99 as explained in Section 2.4.3. Some studies used both NSL-KDD and KDD99, while others used only NSL-KDD dataset. Other IDS datasets are used rarely. For example, ISCX and
Table 2.8 Software used in the reviewed articles. Weka, Matlab, and LibSVM are mostly used for comparison purposes. General purpose programming languages are used for implementation. Software that are used less than 2 are not shown.
Software Tool/Package Article Count
NoInformation 101 Weka 47 Matlab 42 Java 16 LibSVM 14 C++ 7 Hadoop 5 MOA 6 R 4 Pascal 3 CSharp 3 Liblinear 2 Python 2
Kyoto have been used only 6 times. These numbers show lack of recent IDS dataset in the literature.
Table 2.9 Most used datasets. * denotes IDS datasets. Datasets that are used less than 3 are not shown.
Dataset Name Article Count
KDD99* 183 NSL-KDD* 46 Iris 11 DARPA* 10 Glass 9 Shuttle 7 Kyoto* 6 ISCX* 6 Breast Cancer 6 Ionosphere 5 Poker Hand 5 Pima 5 Lymphography 5 Wine 5 Synthetic Data 5 Abalone 5 Synthetic 4
Table 2.10 Performance metrics used. Usage of performance metrics are highly irregular. Some articles does not give any metrics (*). Metrics used less than 3 are not shown.
Performance Metric Article Count
Detection Rate 186
False Positive (FalseAlarm) 95
Training Time 62
Testing Time 50
False Negative 30
Confusion Matrix Multi 5 General 29
Error Rate 28
ROC-Curve 28
True Positive 28
Precision 20
F-Measure 18
Number Of elected Features 16 True Positive (Sensitivity-Recall) 15 ROC-Area Under Curve 15
Recall 13
Cost Per Example 12
True Negative 12
Correlation Coefficient 9 Confusion Matrix Binary 9 Computational Complexity Time 7
Memory Usage 7
Root Mean Square Error 7
Specificity 6 Sensitivity 6 None* 6 Geometric Mean 5 Computational Complexity 5 CPU Usage 4
True Negative (Specificity) 4
2.6.9. Performance metrics used in reviewed studies
Various performance metrics can be used to evaluate to machine learning algorithms. Table 2.10 summarizes which metrics are provided in the 215 articles reviewed. Detection rate is most consistent metric provided; although some articles fail to provide this metric. For example, some articles gave figures for their detection rate but did not give an exact number; therefore, reader has to guess about its value. Other articles gave 5-class detection rates but did not give overall detection rate for comparison. If a researcher would like to compare the given results with other articles, it is often impractical since dataset sizes differ greatly from article to article. Some articles gave detection rate by class but failed to provide number of class instances therefore it is impossible to get single detection rate for attack versus normal.
Some articles did not present information about used testing dataset. Machine learning algorithms get different results in KDD99 train and testing dataset as mentioned in Section 2.4.2. Therefore; it is important for articles that use KDD99 to indicate that if they used training or testing dataset of KDD99.
Other performance metrics differ widely in our reviewed articles. Computational Complexity metrics were not given in most articles. Also training time was given 63 (29%) times, and testing time was given 51 ( 23%) times. Considering importance of these two metrics, their usage is not high.
Generally, authors suggest that following metrics should be given in the KDD99 research articles. (1) Detection Rate, (2) Confusion matrix, (3) Training Time, (4) Testing Time and, (5) Computational Complexity for newly proposed methods.
2.6.10. Main IDS type according to reviewed Studies
Figure 2.8 shows which IDS methodologies are used in the collected articles. Total count is more than 215, since most articles use more than one methodology. KDD99 is a popular choice for both machine learning and anomaly detection studies.
ML AD AL 0 50 100 150 200 197 87 18 Type of Article Count
Figure 2.8 Article counts by methodology (ML:Machine Learning, AD:Anomaly Detection, AC:Alert Correlation)
2.6.11. IDS vs not IDS studies
Figure 2.9 shows how many articles claim that they are IDS studies among the reviewed articles. Even though, IDS articles form the majority, number of Non IDS articles shows that KDD99 is also widely used in other domains.
IDS
171
Not IDS 44
Figure 2.9 IDS and Not IDS articles in 2010–2017 for total of 215 articles. KDD99 is mostly used in IDS studies; but, some studies use it also, especially feature selection and data streams studies.
2.7. Suggested checklist for avoiding common mistakes
After evaluating 215 studies from the SCI-indexed 90 journals, we suggest a checklist for researchers who want to apply a machine learning or IDS method using KDD99 or other large datasets. The suggested checklist has been provided considering common mistakes and strengths points of the reviewed studies. This checklist could be useful for future studies in a similar areas. The instructions in checklist are as follows:
• Point out training and test dataset clearly.
• If the target dataset is KDD99, identify if full dataset or a portion of dataset is used.
• Specify train, test and validation dataset sizes in a table.
• Increase reproducibility of the study by giving software package, re-sampling strategy, and random seeds.
• To evaluate the classification result, provide confusion matrix, detection rate, training time and testing time.
• Compare the result of the proposed approach with other most used methods. • Determine the number of output classes. For KDD99 using 5 or 23 classes will
2.8. Chapter discussion
In this chapter, 215 recent studies that use KDD99 dataset between 2010 and 2016 have been reviewed. A different review process is followed from previous reviews in the same area. Instead of finding the major contributions to the area, descriptive statistics are extracted. Review results show the following findings: (1) Even though KDD99 is an 17-years-old dataset, it is still widely used in IDS and machine learning research. (2) Decision tree derivatives and support vector machines are the most applied algorithms. (3) Weka and Matlab are the most used software toolboxes, even though most studies did not give any information about software usage. (4) Detection rate is the most used performance metric to show classification quality. Additionally, considering common errors and strengths of the reviewed works, a checklist has been suggested to improve the research quality in similar areas.
T able 2.1 1 Journals and article counts Journal Name Article Count Journal Name Article Count Expert Systems with Applications 27 Concurrency and Computation: Practice and Experience 1 Security and Communication Networks 14 IEEE T ransactions on Parallel and Distributed Systems 1 Information Sciences 8 Communications in Statistics -Simulation and Computation 1 Knowledge-Based Systems 8 Cluster Computing 1 Applied Soft Computing 7 China Communications 1 Neurocomputing 7 Artificial Intelligence Review 1 Neural Computing and Applications 6 Artificial Intelligence 1 IEEE T ransactions on Knowledge and Data Engineering 5 Arabian Journal for Science and Engineering 1 Applied Intelligence 5 Applied Mathematics and Information Sciences 1 The International Arab Journal of Information T echnology 5 Applied Artificial Intelligence 1 Pattern Recognition 5 Acta Polytechnica Hungarica 1 International Journal of Computational Intelligence Systems 4 IEEE T ransactions on Neural Networks and Learning Systems 1 Computer Communications 4 International Journal of Communication Systems 1 The Journal of Supercomputing 4 IEEE T ransactions on Smart Grid 1 Engineering Applications of Artificial Intelligence 4 IEEE T ransactions on Systems, Man, and Cybernetics, Part C: Applications and Reviews 1 Journal of Intelligent and Fuzzy Systems 3 T elecommunication Systems 1 Machine Learning 3 Soft Computing 1 Journal of Network and Computer Applications 3 Signal, Image and V ideo Processing 1 International Journal of Computer Science and Network Security 3 Sensors 1 IETE Journal of Research 2 Programming and Computer Software 1 IEEJ T ransactions on Electrical and Electronic Engineering 2 Pattern Recognition Letters 1 International Journal of Innovative Computing, Information and Control 2 PLoS ONE 1 T singhua Science and T echnology 2 Neural Processing Letters 1 The Scientific W orld Journal 2 Mobile Networks and Applications 1 EURASIP Journal on Wireless Communications and Networking 2 Mobile Information Systems 1 The Computer Journal 2 Knowledge and Information Systems 1 Defence Science Journal 2 Journal of the Faculty of Engineering and Architecture of Gazi University 1 Data Mining and Knowledge Discovery 2 Journal of V isual Languages and Computing 1 Journal of Information Science and Engineering 2 Journal of Parallel and Distributed Computing 1 Journal of Intelligent Information Systems 2 Journal of Network and Systems Management 1 Simulation Modelling Practice and Theory 2 Journal of Advanced Research 1 Genetic Programming and Evolvable Machines 2 Iranian journal of fuzzy systems 1 IEEE Latin America T ransactions 2 Iranian Journal of Science and T echnology-T ransactions of Electrical Engineering 1 Computational Intelligence and Neuroscience 2 International Journal on Artificial Intelligence T ools 1 Intelligent Automation and Soft Computing 2 International Journal of Systems Science 1 IEEE T ransactions on Cybernetics 2 International Journal of Pattern Recognition and Artificial Intelligence 1 IEEE T ransactions on Computers 2 International Journal of Fuzzy Systems 1 Mathematical Problems in Engineering 2 International Journal of Computers Communications and Control 1 IEEE Systems Journal 1 T urkish Journal of Electrical Engineering and Computer Sciences 1 IEEE T ransactions on Dependable and Secure Computing 1 Intelligent Data Analysis 1 Future Generation Computer Systems 1 IETE T echnical Review 1 Wireless Personal Communications 1 IET Information Security 1 Computing and Informatics 1 IEICE T ransactions on Information and Systems 1 Frontiers of Computer Science 1 IEICE T ransactions on Fundamentals of Electronics, Communications and Computer Sciences 1 Discrete Dynamics in Nature and Society 1 ACM T ransactions on Autonomous and Adaptive Systems 1
3. GENETIC ALGORITHMS BASED FEATURE SELECTION AND CLASSIFIER ENSEMBLE
Chapter abstract
As information systems develop, intrusion detection systems (IDS) become more and more important. IDS can be considered as a classification problem. Nowadays, to improve accuracy of classifiers, it is recommended to use classifier ensembles instead of single classifiers. One of the important steps of classification applications is feature selection step. The performance of classification depends on selected features and applied classification approach. This study proposes to use genetic algorithms for both feature selection and weight selection for weighted classifier ensemble in IDS. Number of classifiers used in ensemble changes between 3 and 7 with weighted combination method. Following classifiers have been used: Adaboost, Decision Tree, Logistic Regression, Naive Bayes, Random Forests, Gradient Boosting, and K-Nearest Neighbor. Well-known intrusion detection dataset, NSL-KDD, has been used in experiments. The results of the proposed method have been compared with weighted vote, simple vote, and probability vote ensemble methods, and also with single classifiers.
3.1. Chapter introduction
Computer-based systems are part of our daily life and are a fundamental part of production systems and services. Billions of users connect to Internet using computer based systems. This complex network makes it easy to get information but it is vulnerable to attacks. Day by day, complexity and numbers of attacks is increasing. Intrusion detection systems (IDS) are used to protect information systems against those attacks[11].
Intrusion detection systems are categorized into two types according to detection methodology[11]. Signature-based IDS keeps a signature database for every attack. Every incoming request to system is compared with this database. According to this comparison, request is labeled as either an attack or normal request. Anomaly-based IDS starts with the definition of what normal is. This definition normally is based on statistical or machine learning principles. Every incoming request to system is compared with this normal definition. According to conformity of the request to this definition, request is labeled as either an attack or normal[11].
General IDS and machine learning work has been studied well in related review works [20, 21, 55]. According to Özgür and Erdem [55], 142 studies were published in SCI indexed journals between 2010–2015 that were intrusion detection related. Among these 142 studies, 118 of them use IDS and machine learning techniques together, Table 3.1 and Figure 3.1.
Figure 3.1 IDS and ML articles counts published in SCI indexed journals
Feature selection step is a very important step in classification of high dimensional datasets. Since feature selection is an NP-hard problem, different techniques have been applied [53]. Yıldız et al. [56] used genetic algorithms for feature selection in breast cancer classification problem. Similarly, evolutionary algorithms are used for feature selection and finding feature weights[57]. Since datasets for IDS are comparably large in feature and instance size, training and testing of machine learning algorithms takes long time. To decrease training and testing times, the feature selection step has been widely used in IDS applications [20, 55].
Single classifier machine learning algorithms are widely used in IDS studies. As an example, Neural networks has been applied on KDD99 dataset [58] [59]. In other studies [60] [61] [62], multiple machine learning algorithms have been fused. According to Özgür and Erdem [55], 14 studies used classifier ensemble among 142 IDS and machine learning studies. When deciding ensemble outcome, single classifier may use single vote or probabilistic vote. In addition to these two voting methods, votes may be changed using weights. Normally, weights for ensemble can be found empirically or using domain knowledge. Other studies have used heuristic optimization techniques for the same purpose [63, 64, 65].
Table 3.1 Methods used in IDS and machine learning [55]
Method Article Count**
IDS 125 Machine Learning 135 Hybrid 50 Feature Selection 34 Ensemble 14 Genetic Algorithms 16 Total 142
**Note that if an article uses two techniques, it is counted twice.
In IDS and machine learning systems, hybrid algorithms started to become more important. In recent 142 studies of IDS and machine learning, 50 studies applied hybrid methods[55]. This number makes hybrid algorithms by far most popular technique in machine learning and IDS, see Table 3.1. Hybrid methods combine different algorithms in the same system. Usually, heuristic optimization techniques have been used together with other machine learning methods. GA are among the most used heuristic optimization techniques. GA is a global optimization algorithm and applied to wide range of different NP-hard problems. Dener et al. [66] used genetic algorithms on the well-known problem of shortest distance. Similarly, GA is used in other engineering problems: Üstündağ et al. [67] used GA on de-noising of radar signals, and Gürsü [68] used GA on estimation of high voltage problems. Additionally, Yıldız et al. [56] used GA on breast cancer domain for feature selection and data fusion.
Sylvester and Chawla [64] proposed GA-based method named EVEN, that find weights of classifiers. Maghsoudi et al. [65] used GA to find classifier weights in hyper spectral imaging. Besides, GA has been used for feature selection and classifier ensemble weights finding in the literature. But, according to best of authors’ knowledge, there is no study that applies GA for selecting features and finding weights of combined classifiers simultaneously.
In proposed method, feature selection and weights finding problem solved together in one objective function. It is called Genetic Algorithms based Feature Selection and Weights Finding, in short form GA-FS-WF. Effects of these two steps are given in the previous studies. Feature selection reduces training and testing time of classifiers, which are critical for IDS[69]. At the same time, single classifiers are combined via different weights. Classifier combination improves accuracy of overall system. By applying GA to these two steps together, error propagation from first step to other
![Table 1.1 Survey of security tools used [10]](https://thumb-eu.123doks.com/thumbv2/9libnet/3969341.52309/16.892.130.735.132.555/table-survey-of-security-tools-used.webp)