e-Polymers 2010, no. 083 http://www.e-polymers.org ISSN 1618-7229
Comparison of cation effects on phase transitions of kappa
and iota carrageenan
Özlem Tarı,1Önder Pekcan 2*
1
Istanbul Technical University, Department of Physics, Maslak, 34469 Istanbul, Turkey; fax: +902122856386; e-mail: otari@itu.edu.tr.
2*
Kadir Has University, Faculty of Arts and Science, Cibali, 34320, Istanbul, Turkey; fax: +902125336515; e-mail: pekcan@khas.edu.tr.
(Received: 03 February, 2009; published: 14 August, 2010)
Abstract: Phase transitions of kappa and iota carrageenan in KCl, NaCl, and CaCl2 solutions were separately studied during heating and cooling processes by
using fluorescence technique. Scattered light, Isc and fluorescence intensity, I was
monitored against temperature to determine the critical transition temperatures and exponents. Kappa and iota carrageenans with monovalent (KCl, NaCl) salt system presented only coil to double helix (c-h) and double helix to coil (h-c) transitions upon cooling and heating processes, respectively. Two transition regions were observed in both heating and cooling of the iota carrageenan in CaCl2 solution
while in kappa carrageenan only (c-h) and (h-c) transitions was detected. During heating, dimers decompose into double helices by making (d-h) transition. At the high temperature region (h-c) transition takes place. During cooling, back transitions repeat themselves. A hysteresis was observed between (h-c) and (c-h) for the kappa and iota carrageenan salt system (except CaCl2), respectively. Dimer
to double helix (d-h) and double helix to dimer (h-d) transitions were observed for iota carrageenan in CaCl2 salt. The gel fraction exponent was measured and
found to be in accord with the classical Flory-Stockmayer Model for both kappa and iota carrageenan salt systems.
Introduction
Among the large number of systems that are liable to form three dimensional network (e.g. steroids, polymers), gels prepared from either synthetic polymers or biopolymers have received and are still receiving considerable attention. These polymeric gels break down into two main categories depending upon the process whereby the elements of the network are connected: chemical gels and physical gels [1]. In general, chemical gels formed by chemical bonding are irreversible gels, since they cannot be dissolved again. However, physical gels are thermoreversible gels. Many of the natural polymer gels fall into the class of physical gels.
Carrageenans are copolymers of alternating 1,4-linked -D-galactose and 1,3-linked -D-galactose. They are extracted from red seaweeds and come in three major types designated by means of greek letters , and . Only iota (-) carrageenan and kappa (-) carrageenan possess gelling capability.
-carrageenan is known to form thermally-reversible gels as a function of temperature and gel inducing agents cations such as K+ and Na+ [2]. -carrageenan assumes a random coil conformation in the sol state, and low temperature induce twisting of anhydro-galactose sequences into double helices. The gelation process of
carrageenan solutions has been described by two mechanisms. In the first mechanism, crosslinks are formed by segments of a double helix. These segments are then aggregated by ions as K+ [3]. In the other mechanism, monohelices are formed which are subsequently aggregated by K+ ions to dimers, trimers etc. [4].
Fig 1. Molecular structure of intramolecular K+ bridge in -carrageenan.
In -carrageenan intramolecular bridges are formed in the presence K+
ions. A bridge is formed first by an ionic bond between K+ and the sulfate group of the one D-galactose residue and second by an electrostatic bond between K+ and the anhydro-O-3,6-ring of the other D-galactose residue [5] (Figure 1). Many intra molecular cation bridges serve to keep the polymer chain rigid, which results in an intermolecular association.
Phase transition temperatures, rheological properties, and gel network characteristics during sol-gel and gel sol transitions of -carrageenan-salt solution were studied by several groups. The effectiveness of increasing gelling and gel-melting temperatures at the salt concentrations were examined by following the sequence of K+ > Ca2+ > Na+ in KCl, CaCl2 and NaCl solutions, respectively[6-10].
-carrageenan is the most highly sulfated of the helix-forming polysaccharides, which has a high molecular weight linear polymer consisting principally of an alternating sequence of 3-linked -D-galactose 4-sulfate and 4 linked 3,6-anhydro--D-galactose 2 sulfate. Thus, each monosaccharide unit in the ideal polysaccharide carries one sulfate group, and therefore -carrageenan behaves in aqueous solution as a highly charged polyanion in the extended confirmation [11]. According to X-ray Diffraction data, the polysaccharide has a double helix conformation in the solid phase, while its calcium salt takes a three-fold right-handed double helix with paralel strands [12-14]. In solution -carrageenan is reversibly transformed from an ordered to a disordered conformation. Naturally at high ionic stregth and low temperature -carrageenan forms an ordered state. Upon heating, the helices dissolve and the -carrageenan forms a random coil conformation [15].
In the more ionic iota carrageenan, the gelation mechanism is different from kappa carrageenan. Divalent cations such as Ca2+ ions are more effective in iota carrageenan than monovalent cations (K+, Na+). It was shown that the increase in Young’s modulus with concentration is much faster for -carrageenan in CaCl2 solutions than in KCl solution [16], which in turn is much faster than NaCl solutions. For this reason it is said that Ca2+ ions favour the gelation of -carrageenan. Intramolecular Ca2+ bridging may take place between the sulfate groups of adjacent
anhydro-D-galactose and D-galactose residues (Figure 2).
Fig. 2. Molecular structure of intramolecularCa2+ bridge in -carrageenan.
However monovalent cations may construct intramolecular bridge in between the anhydro-bridge oxygen atom and the sulfate group linked at C-4 of the D-galactose residues. On the other hand, upon cooling, intermolecular Ca2+ bridging may also take place between different molecules: the oxygen group of the sulfate groups at C-2 of the anhydro-D-galactose residues may contribute to the intermolecular Ca2+ bridges (Figure 3).
Fig. 3. Molecular structure of intermolecularCa2+ bridge in -carrageenan.
The aim of this work is to study sol-gel and gel-sol transitions of and carrageenan in KCl, NaCl and CaCl2 salts using fluorescence technique. Both scattered, Isc and
fluorescence intensities, I were monitored against temperature. The necessary correction on the pyranine intensity was made to produce the real phase transition curves. Coil to double helix and double helix to coil transition temperatures (Tch and
Thc) were determined for each curve of samples in various salt content. It was
fraction exponent was found to be in accord with the classical Flory – Stockmayer model during the thermal phase transitions. This theory predicts that helices and double helices should form Cayley tree structure in the gel network.
Results and Discussion
Figure 4a, b and d, e present the plots of the fluorescence intensity, I and scattered light intensity, Isc versus temperature, T for C2K04 and C2Ca04 gels during the sol
gel and gel sol transitions.
Temperature, T (oC) 10 20 30 40 50 60 70 80 90 Fl u o res ce n ce in ten s it y , I (a.u) 110 120 130 140 150 C2K04 (a) Temperature, T (oC) 10 20 30 40 50 60 70 80 90 Fl u o res ce n ce in ten s it y , I (a.u) 70 80 90 100 110 120 130 C2Ca04 (d) Temperature, T (oC) 10 20 30 40 50 60 70 80 90 Sca tt er ed in ten s it y (a.u ) 20 40 60 80 100 C2K04 (b) Temperature, T (oC) 10 20 30 40 50 60 70 80 90 Sca tt er ed in ten s it y , Isc (a.u ) 0 20 40 60 C2Ca04 (e) Temperature, T (oC) 10 20 30 40 50 60 70 80 90 Ic 0.2 0.4 0.6 0.8 1.0 1.2 C2K04 (c) Temperature, T (oC) 10 20 30 40 50 60 70 80 90 Ic 0.2 0.4 0.6 0.8 1.0 1.2 C2Ca04 (f)
Fig. 4. Temperature variation of fluorescence, I scattered, Isc and corrected
fluorescence, Ic intensities for kappa carrageenan in KCl and CaCl2 salts. The heating and cooling runs are presented by open and closed circles respectively.
It can be seen from the Figures 4b and 4e that Isc increased upon cooling the kappa
carrageenan samples indicating that the turbidity of the gel increased. Upon cooling, random coils transform to helices and double helices and then they are aggregated to higher order assemblies in order to create an infinite network. This process is called coil to double helix (c-h) transition.
During the heating, the gel system goes to a double helix to coil (h-c) transition. However fluorescence intensity, I presented the reverse behavior compared to Isc.
We expect that I should decrease by increasing temperature due to quenching of pyranine in coil rich environment. In order to elaborate the above results; the fluorescence intensity, I has to be corrected by taking into account the behavior of the scattered light intensity to produce the real change in the fluorescence intensity. The corrected fluorescence intensity, Ic is obtained from I / Ik where Ik is the light
source and behaves as 1 / Isc. It is seen in Figures 4c and 4f that as the temperature
decreased Ic decreased by predicting more solid medium formed by helices and
dimers. A hysteresis was observed between (c-h) and (h-c) transitions for the all kappa carrageenan samples, by predicting that these transitions require different energies.
The behavior of the fluorescence and scattered intensity between 20 and 98 oC for I2K04 and I2Ca04 samples during the heating and cooling processes are presented in Figure 5. The similar correction is made to I for the iota carrageenan gels to find the corrected fluorescence intensity, Ic. Phase transition loops in Figure 5c presented
a similar behavior with the loops in Figures 4c and 4f. Most probably monovalent cations K+ and Na+ are not effective in iota carrageenan gels compared with Ca2+. Figure 5c and 5f compare the hysteresis loops of iota system in K+ and Ca2+ cations where it is interesting to see the importance of the cation behavior in iota carrageenan system.
It is seen in Figure 5f that Ic varies on heating the sample, first indicating that a low
temperature transition takes place and reaches a minimum. Further heating causes an increase in Ic around 80 oC predicting high temperature transition takes place. On
the other hand, corrected fluorescence intensity, Ic decreases when the sample is
cooled down, which indicates that the high temperature back transition occurred. Subsequent cooling of the sample produce a return to the low temperature phase transition.
In order to interpret the results in Figures 5f we have followed the model on aggregation of iota carrageenan helices which was proposed by Morris et al. [3]. According to this model, there are two levels of ordering of -carrageenan in solutions and gels. This ordering of the polysaccharides can be in the form of a double helix or clusters of double helices, which may call dimers. This model can be explained by the following scheme,
2 2 2
[H ] 2H 4C (1)
where C is the random coil, H2 is the double helix and [H2]2 is the double helix dimer. This model predicts high temperature transition during cooling which may correspond to coil to double helix (c-h) transition. In other words during (c-h) transition, double helix aggregate form a separate phase by excluding water from their domains, and as a result the -carrageenan-water system decomposes into two phases with different network concentrations. So that Ic decreases due to the quenching of
coiled medium. At low temperature region, however further cooling causes the formation of double helix dimers i.e., double helix to dimer (h-d) transition occurs during cooling the carrageenan –water system.
Temperature, T (oC) 0 20 40 60 80 100 120 Fl u o re s ce n ce in ten s it y , I (a .u) 180 190 200 210 I2K04 (a) Temperature, T (oC) 0 20 40 60 80 100 120 Fl u o res ce n ce in ten s it y , I (a.u) 168 176 184 192 200 208 I2Ca04 (d) Temperature, T (oC) 0 20 40 60 80 100 120 Sca tt er ed in ten s it y , Isc (a.u ) 32 36 40 44 I2K04 (b) Temperature, T (oC) 0 20 40 60 80 100 120 Sca tt er ed in ten s it y , Isc (a.u ) 22 24 26 28 30 32 34 I2Ca04 (e) Temperature, T (oC) 0 20 40 60 80 100 120 Ic 0.85 0.90 0.95 1.00 1.05 I2K04 (c) Temperature, T (oC) 0 20 40 60 80 100 120 Ic 0.6 0.7 0.8 0.9 1.0 I2Ca04 (f)
Fig. 5. Temperature variation of fluorescence, I scattered, Isc and corrected
fluorescence, Ic intensities for iota carrageenan in KCl and CaCl2 salts. The heating and cooling runs are presented by open and closed circles respectively.
Here increase in corrected fluorescence intensity, Ic predict more rigid environment
has been reached at low temperature, which results in less quenching of excited pyranine molecules in this dimer medium. When the dimers at low temperature region are heated back then the system goes into the dimer to double helix transition, where Ic intensity now decrease slowly back to its minima. Upon further heating
double helices are decomposed to the coils and system goes into the double helix-to-coil (h-c) transition. During (h-c) transition, Ic intensity increases back to its previous
location.
The behaviour of Ic during heating presented perfect hysteresis, by showing
quenching during (d-h) transition. Then following (h-c) transition causes less quenching of pyranine molecules due to coiled environment. The hysteresis at low temperature transition can be explained by the energetic needs of (h-d) and (d-h) transition. In other words (h-d) transition occurred at lower temperature, because formation of dimers from helices is energetically more possible than their dissolution i.e. (d-h) transition.
The mechanism of the sol-gel transition has been described in terms of the percolation theory by a number of authors [17, 18]. According to this theory in the sol state, molecules of the solute join into small aggregates, called clusters, which grow in size during gelation. The sol-gel phase transition from the sol state to the gel state occurs when small clusters link together and form a single giant cluster which occupies most of the volume. The moment at which the giant cluster is just started to appear, indicates the gel point, p pc, where the conversion factor p is the fraction of the bonds which have been formed between the molecules. Therefore, the system is called a gel for p above pc, a sol for p below pc. In the gel state, the number of finite
clusters decreases during gelation, wheras the size of the giant cluster grows until all molecules are involved in its network. For the critical exponents near the sol-gel phase transition classical theories like those of Flory-Stockmayer [19] predict one set of exponents, whereas scaling theories based on lattice percolation [17, 20] predict different exponents. The two groups of theories differ in their treatment of intramolecular loops, namely space dimensionality, and excluded volume effects, in order to describe the sol-gel transition. The exact solution of the sol-gel transition was first given by Flory and Stockmayer on a special lattice called a Bethe lattice on which the closed loops are ignored. The critical exponents for the weight average degree of polymerization, DPw and the gel fraction, G both are equal to unity
independent of the dimensionality in the Flory-Stockmayer model which is also called classical theory. In order to quantify the results given in Figures 4c, 4f, 5c and 5f the critical behaviour of the gel fraction, G near the gel point is defined as [17].
( c)
G A p p (2)
where is the critical exponent and A is the critical amplitude.
Using the relation ppc Tc T and Equation (2), the corrected fluorescence intensity, Ic can be written as a power law near transition.
,
c c c
II A T T T T (3)
where A is another critical amplitude and Tc is the critical transition temperature. In
(c-h), (h-c), (d-h) and (h-d) transitions Ic can be taken as Ich, Ihc, Idh and Ihd,
respectively. Also Tc can be written Tch, Thc, Tdh and Thd, respectively.
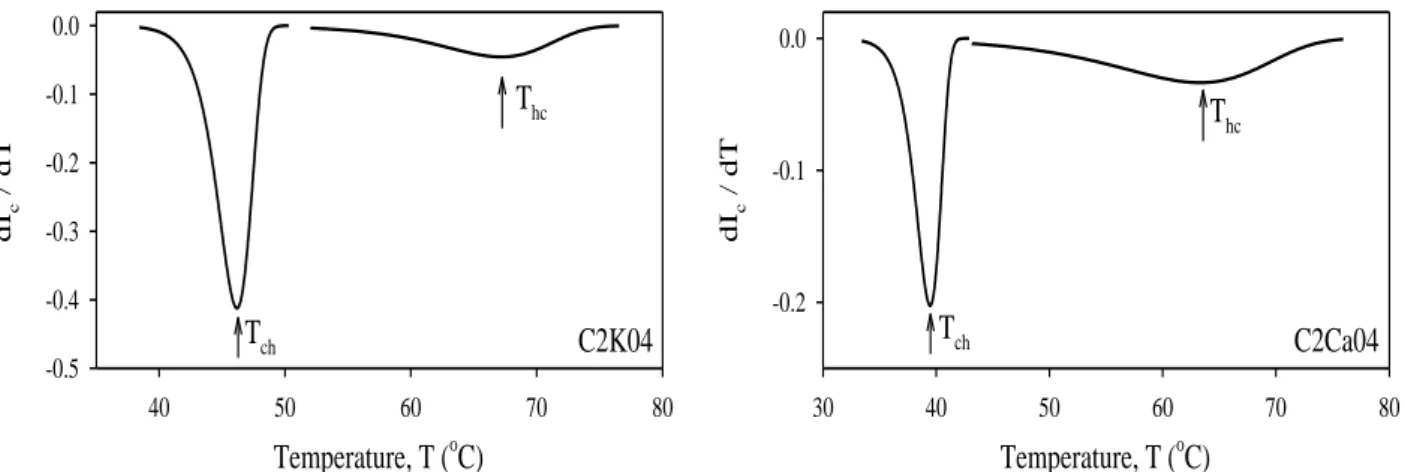
In order to quantify the data in Figures 4c and 4f, the first derivatives of the Ic curves
are taken and plotted for the (c-h) and (h-c) transitions in Figure 6, respectively. The peak positions produce the coil to double helix (Tch) and double helix to coil (Thc)
Temperature, T (oC) 40 50 60 70 80 dI c / d T -0.5 -0.4 -0.3 -0.2 -0.1 0.0 Tch Thc C2K04 Temperature, T (oC) 30 40 50 60 70 80 dI c / d T -0.2 -0.1 0.0 Tch Thc C2Ca04
Fig. 6. The first derivative of Ic versus temperature for the samples C2K04 and
C2Ca04. The peak positions correspond to coil to double helix, Tch and double helix
to coil, Thc transition temperatures.
Temperature, T (oC) 70 75 80 85 90 95 100 dI c / d T 0.000 0.005 0.010 0.015 0.020 0.025 0.030 Tch Thc (a) Temperature, T (oC) 10 20 30 40 50 60 70 80 dI c / d T -0.10 -0.08 -0.06 -0.04 -0.02 0.00 Tdh Thd (b)
Fig. 7. The first derivative of Ic versus temperature for the I2Ca04 sample a) at high
temperature and b) at low temperature region.
Tab. 1. The symbols and the transition temperatures of the studied kappa
carrageenan gels.
Samples Salts Salt content (wt%) Tch0.5 (oC) Thc0.5 (oC) C2Na04 NaCl 0.4 36.3 56.5 C2Na06 NaCl 0.6 36.2 57.6 C2Na08 NaCl 0.8 37.2 58.2 C2K04 KCl 0.4 46.1 67.0 C2K06 KCl 0.6 51.1 70.6 C2K08 KCl 0.8 54.2 76.1 C2Ca04 CaCl2 0.4 39.2 63.2 C2Ca06 CaCl2 0.6 41.5 66.8 C2Ca08 CaCl2 0.8 42.1 67.9
Similar curves were produced for the data in Figure 5f and plotted in Figure 7a for the high temperature region which provide coil to double helix (Tch) and double helix to
coil (Thc) transition temperatures. At low temperature region dimer to double helix
(Tdh) and double helix to dimer (Thd) transition temperatures are produced and plotted
in Figure 7b for the I2Ca04 sample.
The measured transition temperatures are listed in Table 1 and 2 for kappa and iota carrageenan samples, respectively. If one carefully analyzes the numerical values in these tables, then it can be seen that Thc and Tch temperatures are strongly affected
by the salt content and salt type. For example, kappa carrageenan samples with KCl present higher transition temperatures than with NaCl in both (c-h) and (h-c) transitions. Also temperatures increase by increasing the salt content for a given carrageenan concentration. High salt content in the sol system cause a delay in thermal phase transition, so transition occurs at relatively higher temperature. In other words stronger gels can be formed in high salt content samples than low content samples.
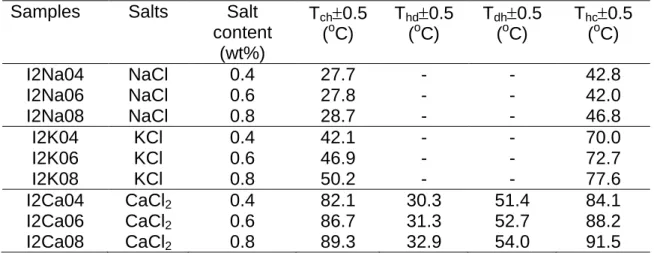
Tab. 2. The symbols and the transition temperatures of the studied iota carrageenan
gels.
Samples Salts Salt content (wt%) Tch0.5 (oC) Thd0.5 (oC) Tdh0.5 (oC) Thc0.5 (oC) I2Na04 NaCl 0.4 27.7 - - 42.8 I2Na06 NaCl 0.6 27.8 - - 42.0 I2Na08 NaCl 0.8 28.7 - - 46.8 I2K04 KCl 0.4 42.1 - - 70.0 I2K06 KCl 0.6 46.9 - - 72.7 I2K08 KCl 0.8 50.2 - - 77.6 I2Ca04 CaCl2 0.4 82.1 30.3 51.4 84.1 I2Ca06 CaCl2 0.6 86.7 31.3 52.7 88.2 I2Ca08 CaCl2 0.8 89.3 32.9 54.0 91.5
Coil to double helix temperatures are smaller than double helix to coil temperatures. Forming helices from the coils are energetically more possible and requires small temperatures; however disassociation of helices to coils needs more energy so that requires higher temperatures.
On the other hand it is seen in Table 1 that stronger kappa carrageenan gels are formed in KCl, compared to other salts. However iota carrageenan gels like CaCl2 more than they do NaCl and KCl, i.e. they form very strong gels in CaCl2 salt.
The double logarithmic plots of the data in Figure 4c and 4f for the (c-h) and (h-c) transitions are presented in Figure 8 for the C2K04 and C2Ca04 samples. The slope of the straight lines produce critical exponent which are listed in Table 3.
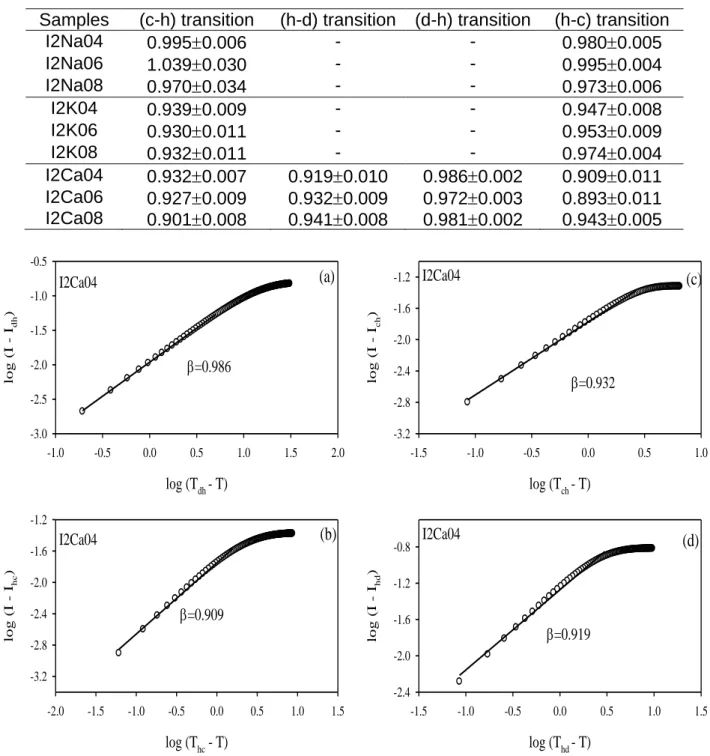
Same process was applied to data in Figure 5f for I2Ca04 sample to determine the critical exponents during (d-h), (h-c), (c-h) and (h-d) transitions. The results are presented in Figure 9 and the obtained critical exponent values are given in Table 4. It is seen from both Tables that the values of the critical exponents are consistent with the Flory- Stockmayer value of =1. Since the formation of gel from helices and
double helices obey the classical Bethe lattice, the connection of helices and doubles helices must be in the Cayley tree form.
Tab. 3. The critical exponents, near the (c-h) and (h-c) transition for the kappa
carrageenan-salt system.
Samples (c-h) transition (h-c) transition
C2Na04 0.8810.022 0.9640.007 C2Na06 0.8870.023 0.9600.005 C2Na08 0.8270.007 0.9610.006 C2K04 0.8940.020 0.9300.007 C2K06 0.9250.014 0.9310.006 C2K08 0.9230.015 0.9340.007 C2Ca04 0.8540.024 0.9620.004 C2Ca06 0.8270.030 0.9410.007 C2Ca08 0.9610.003 0.9330.008 log (Thc - T) -1.0 -0.5 0.0 0.5 1.0 1.5 lo g (I - I hc ) -2.5 -2.0 -1.5 -1.0 -0.5 0.0 =0.930 C2K04 (a) log (Thc - T) -1.0 -0.5 0.0 0.5 1.0 1.5 2.0 lo g (I - I hc ) -2.4 -2.0 -1.6 -1.2 -0.8 -0.4 0.0 =0.962 C2Ca04 (c) log (Tch - T) -1.0 -0.5 0.0 0.5 1.0 1.5 2.0 lo g (I - I ch ) -1.5 -1.2 -0.9 -0.6 -0.3 =0.894 C2K04 (b) log (Tch - T) -1.0 -0.5 0.0 0.5 1.0 1.5 lo g (I - I ch ) -1.5 -1.2 -0.9 -0.6 -0.3 =0.854 C2Ca04 (d)
Fig. 8. Double logarithmic plots of Ic for the samples C2K04 and C2Ca04 during coil
to double helix and double helix to coil transitions.
We can compare these results with the results produced in similar systems. The critical exponent, and corresponding to the cluster mass and correlation length were measured for the polysaccharide gellan gum by using the dynamic and static
light scattering techniques. Results are in good agreement with the lattice percolation model [21]. Critical behavior of kappa carrageenan and iota carrageenan gels was studied using photon transmission method and the critical exponent was found to be in accord with the classical Flory-Stockmayer theory [22, 23].
Tab. 4. The critical exponents, near the (c-h), (h-d), (d-h) and (h-c) transitions for
the iota carrageenan-salt system.
Samples (c-h) transition (h-d) transition (d-h) transition (h-c) transition
I2Na04 0.9950.006 - - 0.9800.005 I2Na06 1.0390.030 - - 0.9950.004 I2Na08 0.9700.034 - - 0.9730.006 I2K04 0.9390.009 - - 0.9470.008 I2K06 0.9300.011 - - 0.9530.009 I2K08 0.9320.011 - - 0.9740.004 I2Ca04 0.9320.007 0.9190.010 0.9860.002 0.9090.011 I2Ca06 0.9270.009 0.9320.009 0.9720.003 0.8930.011 I2Ca08 0.9010.008 0.9410.008 0.9810.002 0.9430.005 log (Tdh - T) -1.0 -0.5 0.0 0.5 1.0 1.5 2.0 lo g (I - I dh ) -3.0 -2.5 -2.0 -1.5 -1.0 -0.5 =0.986 I2Ca04 (a) log (Tch - T) -1.5 -1.0 -0.5 0.0 0.5 1.0 lo g (I - I ch ) -3.2 -2.8 -2.4 -2.0 -1.6 -1.2 =0.932 I2Ca04 (c) log (Thc - T) -2.0 -1.5 -1.0 -0.5 0.0 0.5 1.0 1.5 lo g (I - I hc ) -3.2 -2.8 -2.4 -2.0 -1.6 -1.2 =0.909 I2Ca04 (b) log (Thd - T) -1.5 -1.0 -0.5 0.0 0.5 1.0 1.5 lo g (I - I hd ) -2.4 -2.0 -1.6 -1.2 -0.8 =0.919 I2Ca04 (d)
Fig. 9. Double logarithmic plots of Ic for the samples I2Ca04 for the a) (d-h), b) (h-c),
Conclusions
The effectiveness of salts in influencing the transition curves is studied. It is seen that monovalent cations K+ and Na+ in iota carrageenan behave like in kappa carrageenan. Divalent cation Ca2+ is more effective in iota carrageenan. The gel fraction, G for all transitions in carrageenan systems obeyed classical Flory-Stockmayer Model where the critical exponent was measured around 1.0. It is important to note that the value of does not change by changing the cations or the type of carrageenan. Critical exponents at various salt contents were found to be independent of the ion content in the system. All kappa and iota carrageenan systems under consideration are found to belong to the same universality class. However critical temperatures are found strongly correlated to the salt content and salt type.
Experimental
Powder form of kappa (Sigma C-1013) and iota carrageenan (Sigma C-1138) and pyranine (8-Hydroxypyrene-1,3,6-trisulfonic acid trisodium salt, Fluka 56360) were used to prepare gels by dissolving them in various salts at the desired concentrations. Pyranine concentration was taken as 2x10⁻⁴ M for all samples. The heated carrageenan sol was held at 80 oC and was continuously stirred by a magnetic stirrer. Then the sol was allowed to cool to room temperature. Here mainly two types of experiments were designed; at first kappa carrageenan gels were prepared in various NaCl, CaCl2 and KCl solutions separately. Kappa carrageenan content in the sample was kept constant in 2%. Second type of experiments was performed by constant iota carrageenan content (2%) in various NaCl, CaCl2 and KCl solutions. The compositions and the symbols of the studied kappa and iota carrageenan gels in various types of salts and concentrations are presented in Table 1 and 2, respectively.
The fluorescence intensity measurements were carried out using the Varian Cary Eclipse Fluorescence Spectrophotometer equipped with temperature controller. Pyranine was excited at 323 nm and emission was detected at 515 nm during in situ experiments. Variation in the scattered and fluorescence emission intensity of the pyranine were monitored as a function of temperature.
Sol-gel and gel-sol transitions were performed in a 1x1x4.5 cm3 glass cell equipped with a heat reservoir. Before measurements, the sample was melted and then cooled to ambient temperature so that the sample in the glass cell was distributed uniformly. Then the gels were reheated with scan rate 0.72 oC/min to obtain the gel–sol transition. Cooling of the carrageenan sol was then performed at the same rate to detect the sol–gel transition. Both scattered, Isc and fluorescence intensities, I were
monitored against temperature.
References
[1] Guenet, J-M. Thermoreversible gelation of polymers and biopolymers, Academic Press, San Diego 1992.
[2] Webb, C.; Black, G. M.; Atkinson, B. Process Engineering Aspects of Immobilized
Cell Systems, 1st Ed. Pergamon Press, New York 1986.
[3] Morris, E. R.; Rees, D. A.; Robinson, C. J. Mol. Biol. 1980, 138, 349. [4] Grasdalen, H.; Smidsrod, O. Macromolecules, 1981, 14, 1845. [5] Tako, M.; Nakamura, S. Carbohyd. Res. 1986, 155, 200.
[6] Kusukawa, N.; Ostrovsky, M. V.; Garner, M. M. Electrophoresis 1999, 20 1455. [7] Lai, V. M. F.; Huang, A. L.; Lii, C. Y. Food Hydrcoll. 1999, 13, 409.
[8] Norton, I. T.; Jarvis, D. A.; Foster, T. J. Int. J. Biol. Macromol. 1999, 26, 255. [9] Mohammed, Z. H.; Hember, M. W. N.; Richardson, R. K., Morris, E. R. Carbohydr.
Polym. 1998, 36, 15.
[10] Lai, V. M. F.; Wong, P.A.L.; Lii, C. Y.J .Food Sci. 2000, 65, 1332. [11] Paoletti, S.; Smidsrod, O.; Grasdalen, H.; Biopolymers 1984, 23, 1771.
[12] Anderson, N. S.; Campbell, J. W.; Harding, M. M.; Rees, D. A.; Samuel, J. W. J.
Mol. Sci. 1969, 45, 85.
[13] Arnott, S., Scott, W.; Rees, D.A.; Mc Nab, C.G. Journal of Molecular Biology 1974, 90, 253.
[14] Lee, I. Polymer-Korea 1997, 21, 539.
[15] Rees, D.A.; Williamson, F.B.; Frangou, S.A.; Morris, E.R. Eur. J. Biochem. 1982,
122, 71.
[16] Te Nijenhuis, K. Adv. Polym. Sci. 1997, 130, 1.
[17] Stauffer, D.; Coniglio, A.; Adam, M. Adv. Polym. Sci. 1982, 44, 103. [18] Del Gado, E.; De Arcangelis; Coniglio, A. J. Phys. A 1998, 31, 1901. [19] Flory, P.J. J. Am.Chem. Soc. 1941, 63, 3083; 63, 3091; 63, 3096.
[20] Stauffer, D.; Aharony, A. Introduction to Percolation Theory (second ed.), Taylor & Francis, London 1994.
[21] Okamoto, T.; Vubota, K. Carbohydr. Polym. 1996, 30, 149. [22] Özbek, H.; Pekcan, Ö. J. Molecul. Struct. 2004, 676, 19. [23] Özbek, H.; Pekcan, Ö. Physica A 2006, 367, 69.