MARKET REACTION TO PRIVATE EQUITY DEAL ANNOUNCEMENTS
The Graduate School of Economics and Social Sciences of
İhsan Doğramacı Bilkent University by
SÜHEYL BİLGEL
In Partial Fulfillment of the Requirements for the Degree of MASTER OF SCIENCE
THE DEPARTMENT OF MANAGEMENT İHSAN DOĞRAMACI BİLKENT UNIVERSITY
ANKARA October 2017
iii
ABSTRACT
MARKET REACTION TO PRIVATE EQUITY DEAL ANNOUNCEMENTS Bilgel, Süheyl
M.S., Department of Management Supervisor: Asst. Prof. Dr. Ayşe Başak Tanyeri
October 2017
This thesis investigates whether and how target shareholders benefit in
leveraged buyout deals in which the target is a public company and the acquirer is a private equity firm. We conduct an event study and run cross sectional regressions of cumulative abnormal returns (CARs) on various firm
characteristics. Target CARs average 21.17% in the 3-day event window surrounding the announcement of leveraged buyout transactions. Regression results indicate that CARs decrease with target firm size.
iv
ÖZET
ÖZEL SERMAYE ŞİRKETLERİN BİRLEŞMELERİNE HİSSE SENEDİ PİYASASININ TEPKİLERİ
Bilgel, Süheyl
Yüksek Lisans, İşletme Bölümü
Tez Yöneticisi: Yrd. Doç. Dr. Ayşe Başak Tanyeri Ekim 2017
Bu tezde özel sermaye şirketleri tarafından kaldıraç yöntemiyle devralınan halka açık şirket hissedarlarının nasıl fayda sağladıkları incelenmiştir. Olay çalışması yöntemi ve anormal hisse senedi getirileri ile hedef şirket niteliklerinin incelendiği kesit regresyonu çalışmaları gerçekleştirilmiştir. Olay çalışmasında, ABD’li hedef şirketlerin birleşme duyurusunun etrafındaki üç günlük olay penceresinde
ortalama %21,17 kümülatif anormal getiri sağladığı hesaplanmıştır. Kesit regresyonu çalışması toplam piyasa değeri küçük olan hedef şirketlerin daha yüksek kümülatif anormal getiri elde ettiklerini göstermiştir.
v
ACKNOWLEDGMENTS
I would like to thank Asst. Prof. Dr. Ayşe Başak Tanyeri for her substantial supervision and guidance throughout my study. I would also like to thank Asst. Prof. Dr. Tanseli Savaşer and Asst. Prof. Dr. Burze Yaşar for their valuable comments and suggestions. In addition I would like to express my gratitude to Sibel Çetinkaya and Elif Düşmez Tek for their understanding and support throughout my graduate study. Last but not the least, I would like to thank my family for supporting and encouraging me.
vi TABLE OF CONTENTS ABSTRACT ... iii ÖZET ... iv ACKNOWLEDGMENTS ... v TABLE OF CONTENTS ... vi
LIST OF TABLES ... viii
LIST OF FIGURES ... ix
CHAPTER I: INTRODUCTION ... 1
CHAPTER II: LITERATURE REVIEW & HYPOTHESES ... 5
2.1 Market Reactions to Private Equity Deal Announcements ... 5
2.1.1 Empirical studies that sample US firms ... 5
2.1.2 Empirical studies that sample European firms ... 6
2.2 What Factors Affect Value Generated in Private Equity Deals ... 8
2.2.1 Theoretical and Empirical Studies on Capital Structure ... 8
2.2.2 Theoretical and Empirical Studies on Ownership Structure . 9 2.2.2.1 Hypothesis Regarding Agency Cost of Free Cash Flow ... 9
2.2.2.2 Hypothesis Regarding Shareholder Concentration ... 10
2.2.3 Theoretical and Empirical Studies on Firm Productivity ... 11
2.2.4 Theoretical and Empirical Studies on Undervaluation ... 12
CHAPTER III: RESEARCH METHOD ... 14
3.1 Event Study ... 14
3.1.1 Estimation and Event Windows ... 15
3.1.2 Calculating Abnormal Returns ... 16
vii
3.2 Cross Sectional Regression Model ... 18
CHAPTER IV: DATA ... 20
4.1 Event Sample ... 20
4.2 Collecting Daily Stock Prices ... 21
4.3 Target Firm Characteristics ... 21
4.4 Deal Characteristics ... 23
4.5 Descriptive Statistics on the Deal and Target Firm Characteristics . 23 CHAPTER V: EMPIRICAL RESULTS ... 29
5.1 Market Reaction to Deal Announcements ... 29
5.2 Cross Sectional Regression Results ... 31
5.3 Summary of Empirical Results ... 39
CHAPTER VI: CONCLUSION ... 40
BIBLIOGRAPHY ... 41
APPENDICES ... 44
A. Bloomberg Terminal Search Criteria ... 45
viii
LIST OF TABLES
1. Event Studies that Investigate Market Reactions to Private Equity Deal
Announcements ... 7
2. Match Making Between Literature Results and Hypotheses ... 13
3. Target Firm Characteristics ... 22
4. Data Collection and Sample Size ... 23
5. Descriptive Statistics of Deal Characteristics ... 24
6. Deals Across the Sample Period ... 25
7. Industry Analysis of Transaction Sample ... 26
8. Target Firm Characteristics ... 27
9. Daily Abnormal Returns and CARs in Full Sample ... 29
10. Daily Abnormal Returns and CARs in Subsamples ... 30
11. Heteroskedasticity Test Results in Full Sample ... 33
12. Heteroskedasticity Test Results in Subsamples ... 33
13. Cross Sectional Regression Model Results in Full Sample ... 35
14. Cross Sectional Regression Model Results in Subsamples ... 36
ix
LIST OF FIGURES
1
CHAPTER I
INTRODUCTION
This thesis investigates whether and how target shareholders benefit in
leveraged buyout deals in which the target is a public company and the acquirer is a private equity firm. We measure the value generated or destroyed using the stock-market reaction around private-equity leveraged buyouts (LBO) deal announcements. We analyze whether and how cross-sectional variation in firm characteristics and the timing of the deals affect stock-market reactions.
Private equity firms are alternative investment funds. They search for target firms in need of improvement in financial, operational, and governance areas. Private equity firms are specialized takeover investors and acquire target firms using leveraged buyout transactions. Leveraged buyout transactions are deals in which acquirers use significant amount of debt to fund the acquisition costs. Private equity firms use assets of target firms as collateral for the debt financing. Leveraged buyout transactions lead public target companies to become privately owned by private equity firms.
Wright et al. (2006) reports an increase in private equity investments since the early 1980s. High yield financial instruments helped private equity firms to enjoy easy access to debt financing required for the leveraged buyouts starting in the 1980s. Since the 1980s, the private equity industry has increased the total number of private equity firms conducting LBO deals. The Economist reports
2
that the number of private equity firms steadily increased from 24 in 1980 to 6,628 in 2016, of which 620 were founded in 2016 (“The barbarian
establishment”, 2016). The number of private equity firms grew even during the global financial crisis. According to Tett (2017), leading private equity firms (Carlyle and Kohlberg, Kravis, Roberts) hold nearly 390 companies in their portfolio and employ more than 1.4 million people. This makes them the largest employer after Walmart.
Private equity literature has evaluated the acquisition impact on the target firms from the perspective of cumulative abnormal returns. DeAngelo, DeAngelo, and Rice (1984) find that shareholders of US public firms enjoy cumulative abnormal returns of 25.53% in the 5-day event window around going private transactions. Carow and Roden (1997) investigate 100 of the largest leveraged buyouts in the United States from 1981 to 1990 and find cumulative abnormal return of 17% in the 3-day event window. Andres, Betzer, and Hoffman (2007) find cumulative abnormal returns of 27.01% in the 61-day event window around European leveraged buyout transactions. Renneboog, Simons, and Wright (2007) show that shareholders of UK target firms earn cumulative abnormal returns of
25.53% in the 11-day event window. In Germany, Achleitner, Andres, Betzer, & Weir (2010) find 11.77% cumulative abnormal returns in the 5-day event
window.
Our sample covers 209 LBOs of public US targets and private equity acquirers with announcements ranging from January 2003 to December 2016. Three-day cumulative abnormal returns around deal announcements average 21.17% and are statistically significant. Our finding of 21.17% target CAR is consistent with the target CARs reported in the literature. The positive CARs indicate that leverage buyout transactions conducted by private equity firms create value for shareholders of target firms. As a contribution to the literature, we investigate
3
the difference in value generated in times of crisis versus normal economic times. We find that target CARs in leveraged buyout transactions before and after the global financial crisis are 16.51% and 20.77%, respectively. CARs in leveraged buyout transactions during the crisis period is 58.12%.
Target firms realize statistically significant and positive CARs in LBOs; however, there are different views on the sources of these gains. Literature regresses target firm characteristics on CARs in LBOs. In the cross sectional regression, Achleitner et al. (2010) find that target firm’s debt ratio has negative and statistically significant coefficient. This result indicates that debt ratio of target firm is a source of value created by private equity firms. Similarly, Carow and Roden (1997) and Andres et al. (2007) show that target firm characteristics such as free cash flow and free float percentage have positive coefficients. Officer, Ozbas, and Sensoy (2010) support that firm size has negative coefficient in the cross section regression analysis. This result shows that target firms with small size have higher market reactions. Also, there are other papers which show opposing or inconclusive results.
This thesis regresses target firm and deal characteristics on cumulative
abnormal returns. Target firm characteristics include debt ratio, free cash flow, free float, industry adjusted operating margin, and market capitalization. Deal characteristics represent whether deals are club deal or completed during the crisis period. In the cross section regression analysis, we find that market capitalization has statistically significant coefficient of -9.38. This result shows that target firm size has negative relationship with CARs. However, results prove insignificant when we include year and acquirer fixed effects. We also show that market capitalization has statistically significant and negative coefficient during the before crisis subsample. As a contribution to the literature, we introduce industry adjusted operating margin as a target firm characteristic in order to
4
investigate relation between operational performance and CARs. However, our regression results prove insignificant.
The remaining parts of this thesis are organized as follows. Chapter 2 reviews the literature on private equity deals and develops the hypothesis. Chapter 3 explains the research method. Chapter 4 describes data. Chapter 5 discusses empirical results. Chapter 6 concludes.
5
CHAPTER II
LITERATURE REVIEW & HYPOTHESES
There are two strands of literature that investigate deals which feature private equity firms as acquirers. First strand focuses on market reactions to private equity deal announcements. Second strand investigates what factors affect value generated in private equity deals.
2.1 Market Reactions to Private Equity Deal Announcements
Market reaction studies investigate whether target shareholders benefit in
leveraged buyout deals in which the target is a public company and acquirer is a private equity firm. In the literature, there are empirical studies that sample US and European firms.
2.1.1 Empirical studies that sample US firms
In the United States, DeAngelo et al. (1984) conduct one of the first studies on going private transactions by analyzing 72 announcements between 1973 and 1980. In a 5-day event window, they find cumulative abnormal returns of
25.53%. Travlos and Cornett (1993) conduct another event study on early going private transactions between 1975 and 1983. In this paper, Travlos and Cornett find 17.63% CAR in a 31-day event window. Target CARs of around 20% indicates that private equity deals create value for shareholders of target firms.
6
In the wake of the lavish leveraged buyout era, Carow and Roden (1997)
investigate 100 of the largest leveraged buyouts in the United States from 1981 to 1990. The CARs in these deals is 17% in a 3-day event window and
statistically significant at 1%. Also, Lehn and Poulsen (1989) extend the samples of previous studies and cover 244 deals during the 1980s. In this study, Lehn and Poulsen find significant cumulative abnormal returns of 16.30% in the 3-day event window. Billett, Jiang, and Lie (2008), Brown, Fee, and Thomas (2009), and Officer et al. (2010) conduct similar event studies and extend the sample period to include the 2000s. They find CARs ranging from 17.8% to 28.74%.
2.1.2 Empirical studies that sample European firms
Several papers investigate European private equity deals and find statistically significant cumulative abnormal returns. Andres et al. (2007) cover a sample of 115 European leveraged buyouts between 1997 and 2005. They find a
statistically significant and positive CAR of 13.83% on the event day. They also find CARs of 27.01% in a 61-day event window. Renneboog et al. (2007) analyze UK private equity market and cover 177 deals in the second wave of leveraged buyouts between 1997 and 2003. The 11-day event window CARs is 25.53%. Achleitner et al. (2010) investigate the difference between private equity and non-private equity deals in Germany between 1998 and 2007. They find that private equity deals average CARs of 11.77% in a 5-day event window. The CARs of non-private equity deals is 3.10%. The difference is statistically significant at 1% level.
In summary, depending on the length of the event window, the CARs in studies that sample US, UK and continental EU deals range from 11.77% to 28.74%. These papers agree that private equity deals have statistically significant and positive CARs. We also test whether the deals in our sample generate value for target shareholders by using the market reaction around deal announcements.
7
Hypothesis 0: Cumulative abnormal returns (CARs) of targets acquired by
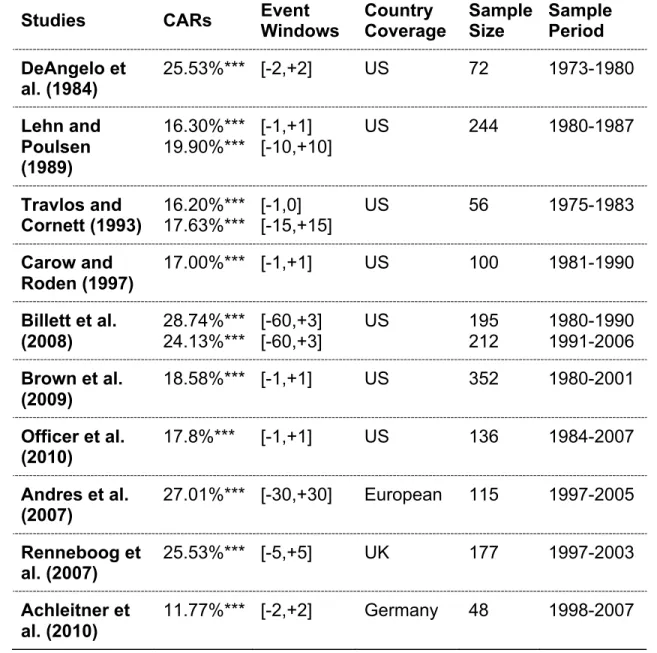
private equity firms through public to private leveraged buyout (LBO) deals are zero. Table 1 shows an overview of empirical studies regarding cumulative abnormal returns gained by target firms.
Table 1: Event Studies that Investigate Market Reactions to Private Equity Deal Announcements
This table summarizes event study results of the literature.
Studies CARs Event Windows Country Coverage Sample Size Sample Period DeAngelo et al. (1984) 25.53%*** [-2,+2] US 72 1973-1980 Lehn and Poulsen (1989) 16.30%*** 19.90%*** [-1,+1] [-10,+10] US 244 1980-1987 Travlos and Cornett (1993) 16.20%*** 17.63%*** [-1,0] [-15,+15] US 56 1975-1983 Carow and Roden (1997) 17.00%*** [-1,+1] US 100 1981-1990 Billett et al. (2008) 28.74%*** 24.13%*** [-60,+3] [-60,+3] US 195 212 1980-1990 1991-2006 Brown et al. (2009) 18.58%*** [-1,+1] US 352 1980-2001 Officer et al. (2010) 17.8%*** [-1,+1] US 136 1984-2007 Andres et al. (2007) 27.01%*** [-30,+30] European 115 1997-2005 Renneboog et al. (2007) 25.53%*** [-5,+5] UK 177 1997-2003 Achleitner et al. (2010) 11.77%*** [-2,+2] Germany 48 1998-2007
8
2.2 What Factors Affect Value Generated in Private Equity Deals
Theoretical and empirical studies investigate factors affecting the value generated in private equity deals.
2.2.1 Theoretical and Empirical Studies on Capital Structure
Private equity firms use leveraged buyouts that use significant debt financing. LBOs lead to a highly leveraged capital structure. Theoretical studies on capital structure may shed light on how LBOs create value for the target firms.
Modigliani and Miller (1958) find that capital structure has no effect on firm value. This paper has set of assumptions which exclude taxes and cost of financial distress. Since interest payments are tax deductible, debt creates tax shield and increases the firm value. Cost of financial distress suggests that debt financing brings cost of bankruptcy and reduces the firm value. Myers (1977) proposes the Trade-Off Theory which suggests that we can maximize the firm value when the marginal benefit of tax shield is equal to the marginal cost of financial distress. This theory supports that the highly leveraged private equity deals can create value for the target firms by eliminating tax obligations and also controlling costs of financial distress. Kaplan (1989a) estimates that the value of interest reduction constitutes 21% to 142.6% of the total premium paid to the target firm. In a regression of debt ratio of target firms on CARs, Achleitner et al. (2010) find that coefficient of debt ratio is -0.153 and statistically significant at 1% level. Similarly, Renneboog et al. (2007) find that coefficient of debt ratio is -0.07 and statistically significant at 5% level. These results suggest that target firms which have low debt ratio and therefore underutilize tax shield benefits attract higher CARs. DeAngelo et al. (1984) show that the long term relationship between private equity firms and institutional lenders reduces cost of financing and provides greater tax shield benefits.
9
Hypothesis 1: Market reactions to deals in which target firms have low debt
ratio (total debt / total asset) and therefore underutilize the tax shield benefits should be higher relative to market reactions to deals in which target firms have high debt ratio.
Bargeron, Schlingemann, Stulz, and Zutter (2008) find inconclusive results. Billett et al. (2008) provide opposing result. They find that coefficient of debt ratio is 0.761 and statistically significant at 1% level. According to the Renneboog and Vansteenkiste (2017), LBOs conducted in the 1990s and 2000s have lower debt ratio than their 1980s counterparts. This result suggests that tax shield benefits are less prominent in the recent transactions.
2.2.2 Theoretical and Empirical Studies on Ownership Structure
Theoretical studies on ownership structure propose two hypotheses that focus on the elimination of agency cost and monitoring cost.
2.2.2.1 Hypothesis Regarding Agency Cost of Free Cash Flow
Jensen (1986) claims that private equity firms create value by eliminating the agency cost of free cash flow. This agency problem occurs when agents invest the free cash flow in unsound projects. According to Jensen, private equity firms eliminate agency cost of free cash flow by building a highly leveraged capital structure. Since debt repayments have higher priority, leveraged capital structure limits the misuse of free cash flow by the agents. In a regression of free cash flow of target firms on CARs, Carow and Roden (1997) find that coefficient of free cash flow is 0.22 and statistically significant at 5% level. Similarly, Billett et al. (2008) and Lehn and Poulsen (1989) find positive and significant coefficients for free cash flow. These results indicate that target firms
10
with high free cash flow and therefore high agency cost attract higher CARs. Andres et al. (2007) and Renneboog et al. (2007) regress target firms’ free cash flows on CARs and find inconclusive results.
Hypothesis 2: Market reactions to deals in which target firms that have high
free cash flow should be higher relative to market reactions to deals in which target firms that have low free cash flow.
2.2.2.2 Hypothesis Regarding Shareholder Concentration
Admati, Pfleiderer and Zechner (1994) claim that monitoring by large shareholders limits conflict of interests between shareholders and the management. Easterbrook and Fischel (1983) explain that individual
shareholders have less incentive to monitor management. Grossman and Hart (1988) state that monitoring is effective only when single party hold the majority of the shares. These statements indicate that shareholder concentration
provides better monitoring and reduces agency cost. We choose free float percentage as a measurement of shareholder concentration. Since various individual and institutional investors own floating shares, high free float
percentage indicates dispersed shareholder concentration. Andres et al. (2007) regress CARs on sum of free float shares owned by individual investors with an interest of less than 5% of the total share capital. They find that the coefficient is 0.235 and statistically significant at 5% level. This result shows that target firms with high free float percentage and therefore inefficient monitoring attract higher CARs. Renneboog et al. (2007) find that cumulative abnormal returns are negatively related with the sum of shares owned by the corporation investors who actively monitor the management.
11
Hypothesis 3: Market reactions to deals in which target firms that have high
free float percentage (lower shareholder concentration) should be higher relative to market reactions to deals in which target firms that have low free float
percentage.
2.2.3 Theoretical and Empirical Studies on Firm Productivity
Private equity firms are investment funds that, unlike other operating firms, cannot gain synergies from M&A deals. Therefore, private equity firms focus on operating income of the target firm in order to pay the debt incurred from the leveraged buyout. Studies show that private equity firms provide operational efficiency for target companies. Jensen (1986) claims that leverage buyouts limit the operational inefficiencies and overstaffing in order to achieve higher
profitability. Lichtenberg and Siegal (1990) find that LBOs create productivity gains for the target firms. They state that main contributors are increase in labor productivity and reduction in misallocated resources. Kaplan (1989b) shows that operating earnings of target firms increase by 42% during first three years under the management of private equity firm. Kazimi and Tan (2016) compares
performance of publicly owned and private equity backed companies during crisis periods. The result indicates that private equity backed companies
recover their before crisis EBITDA margins three times faster than their publicly owned counterparts. These studies identify that private equity firms provide operational improvement for target firms. Therefore, we expect that target firms which are in need of operational improvement should attract higher CARs. In order to identify the need of operational improvement, we calculate industry adjusted operating margins. We divide the operating margin of a target firm by average operating margin of its corresponding industry. Our aim is to contribute to the literature by providing a new indicator to measure the relationship
between operational performance and CARs in LBOs. In the literature, Bargeron et al. (2008) regress operating cash flow of target firms on CARs and find
12
inconclusive results. Similarly, Officer et al. (2010) use industry adjusted EBITDA as an independent variable and find inconclusive results.
Hypothesis 4: Market reactions to deals in which target firms that have low
industry adjusted operating margin should be higher relative to market reactions to deals in which target firms that have high industry adjusted operating margin
2.2.4 Theoretical and Empirical Studies on Undervaluation
Private equity firms follow value investing strategy which makes use of mispriced opportunities. Acquiring undervalued target firm is an easy way to create value. Therefore, we expect that undervalued target firms attract higher CARs in LBOs. We link the undervaluation to the market capitalization of target firms. Public firms with small market capitalization are illiquid and lightly traded. Andres et al. (2007) states that small firms cannot attract necessary market coverage and lack of market coverage causes undervaluation. In the literature, Officer et al. (2010) regress market capitalization on CARs. They find that coefficient of market capitalization is -0.025 and statistically significant at 1% level. This result indicates that small sized firms attract higher CARs. Other empirical studies such as Andres et al. (2007), Renneboog et al. (2007), and Achleitner et al. (2010) find inconclusive results for this hypothesis.
H5: Market reactions to deals in which target firms that have low market
capitalization should be higher relative to market reactions to deals in which target firms that have high market capitalization
Table 2 provides an overview of empirical studies regarding the factors affecting value generated in private equity deals.
13
Table 2: Match Making Between Literature Results and Hypotheses
This table matches literature results and hypotheses. Columns show hypotheses and rows show papers. Each hypothesis has an expected sign of coefficient. Expected signs of H1, H4, and H5 are negative. Expected signs of H2, and H3 are positive. In each row, we state the results of paper by providing coefficients and their level of significances in parentheses. Support indicates that coefficient is statistically significant and has expected sign. Reject indicates that coefficient is statistically significant and has opposite sign. Inconclusive indicates that coefficient is statistically insignificant.
Hypotheses H1 Expected Sign: (-) H2 Expected Sign: (+) H3 Expected Sign: (+) H4 Expected Sign: (-) H5 Expected Sign: (-) Lehn and Poulsen (1989) Support (0.52***) Carow and Roden (1997) Support (-0.66***) Support (0.22**) Billett et al. (2008) Reject (0.76***) Support (1.71***) Officer et al. (2010) Inconc. (0.004) Support (-0.02***) Andres et al. (2007) Inconc. (-0.109) Support (0.235**) Inconc. (-0.000) Renneboog et al. (2007) Support (-0.07**) Inconc. (0.013) Inconc. (0.004) Achleitner et al. (2010) Support (-0.153***) Inconc. (-0.011) Bargeron et al. (2008) Inconc. (-0.012) Inconc. (-0.083) *** statistically significant at 1% level
14
CHAPTER III
RESEARCH METHOD
The first research question investigates whether public to private leveraged buyout deals of private equity firms create value for target firms. We use event study method to analyze market reaction to deal announcements as a measure of value generated by private equity firms. The second research question is about how private equity firms create value for target firms. We conduct cross sectional regression model to investigate the factors affecting the value
generated in private equity deals.
3.1 Event Study
We define our events as public announcements of private to public leveraged buyout deals which take publicly listed target firms under private ownership. Ball and Brown (1968) and Fama, Fisher, Jensen, and Roll (1969) introduce event studies by analyzing stock returns to public announcements revealing new information about annual reports, stock splits and dividends. In line with the Efficient Market Theory proposed by Fama (1970), these early academic studies show how rapidly market prices reflect new information as it becomes available. Subsequently, Brown and Warner (1985) outlined how to conduct event studies using daily stock returns. We conduct an event study following the Brown and Warner (1985) method to investigate whether shareholders of target firms get benefits.
15
3.1.1 Estimation and Event Windows
Cumulative abnormal return (CAR) is a measurement of stock-market reactions to event announcements. CAR shows total change in the stock return over a multi-day interval. Brown and Warner (1985) define the estimation window as 240 days before the event window, which covers the three days surrounding the event announcement. Figure 1 shows that estimation window starts from 240 days before the event day. The day before the event day is the end of estimation window. Event window covers the three days surrounding the event
announcement.
Figure 1: Estimation and Event Windows
We use estimation window to calculate expected returns and standard
deviations. We use event window to calculate cumulative abnormal returns in three-day interval. We calculate expected returns by using market model. Equation 1 showsmarket model equation and properties of residual terms. (1) !!,! = !! + !!!!,! + !!,!
(!!,!) = 0 !"#(!!,!) = !!!!
The dependent variable is return of stock i at time t (R!,!). The independent
variable is market return at time t ( R!,!). The residual term of stock i at time t is ε!,!. Brown and Warner (1985) say that cross-sectional sample mean of
abnormal returns have normal distribution characteristics according to the Central Limit Theorem. Therefore, ε!,! has zero mean and constant standard deviation.
T0
(-240) (-1)T1 (1)T2
Estimation
16
3.1.2 Calculating Abnormal Returns
We calculate abnormal returns by taking the difference between realized and expected return of target companies. Equation 2 illustrates the abnormal return calculation.
(2) A!,! = R!,!− α!+ β!R!,!
On the right hand side, R!,! represents realized return of stock i at time t. Market model estimates expected return of stock i at time t as α!+ β!R!,!. Brown and
Warner (1985) calculates daily mean abnormal returns by taking the cross-sectional sample mean of excess returns for each day in the event window as in Equation 3.
(3) A! =!!
! A!,!
!!
!!!
On the left hand side, A! represents daily mean abnormal return at time t. A!,! and N! represent abnormal return of stock i at time t and sample size at time t, respectively. We calculate cumulative abnormal return as a sum of daily mean abnormal returns in the event window. The event window covers the day before and the day after the event. Equation 4 illustrates the calculation of cumulative abnormal returns in 3-day event window.
(4) CAR[!!,!!] = !! !!
17
3.1.3 Calculating Test Statistics
We test the significance of abnormal returns by calculating the test statistics with respect to the null hypothesis that abnormal returns are not significantly different from zero. Test statistics is a ratio of daily mean abnormal return at time t to its standard deviation as in Equation 5.
(5) !!
!(!!)~N(0,1)
Brown and Warner (1985) state that if daily mean abnormal returns (A!) are IID (independent and identically distributed) and normal, the test statistic is
distributed student-t under the null hypothesis. However, the test statistic is unit normal, since the degrees of freedom exceed 200. Equation 6 and Equation 7 show the calculation of standard deviation S A! .
(6) S A! = (!!!!)! !!!! !!!! (!!!!!!!) (7) A =! ! !!!! A! !!!! !!!!
where T! and T! represent starting days of event and estimation windows,
respectively. We test the significance of the cumulative abnormal return by calculating the test statistics with respect to the null hypothesis that cumulative abnormal return is not significantly different from zero. We calculate the test statistics by dividing cumulative abnormal return by its standard deviation.
18
abnormal returns, we expect that the test statistic for cumulative abnormal return is unit normal. (8) !!!!!!!! !!(! !) !! !!!! ~!(0,1)
3.2 Cross Sectional Regression Model
We use cross sectional regression model to investigate whether target firm characteristics have impact on the magnitude of cumulative abnormal returns. Our cross sectional regression model is multivariate OLS as in Equation 9.
(9) CAR! = β!+ ! β!Det!
!!! + ε!
where CAR! is the cumulative abnormal return of target firm i and Det! is a k*i matrix of independent variables. Independent variables include target firm and deal characteristics. There are five target firm characteristics which are debt ratio, free cash flow, free float percentage, industry adjusted operating margin, and market capitalization. Each firm characteristic is related to the hypothesis developed in Chapter II. Deal characteristics represent whether deals are club deals or are completed during the crisis period. In terms of robustness check, we also include year and firm fixed effects. Several private equity firms
repeatedly appear as acquirer firms. We report robust standard errors clustered based on acquirer identity.
We use the test proposed by Breusch and Pagan (1979) to investigate whether there is heteroskedasticity problem. If p-value is less than 10%, then we reject
19
the null hypothesis of homoskedasticity at a significance level of 10%. If the cross sectional regression model has a heteroskedasticity problem, then we use White’s robust standard errors. White (1980) proposes robust standard errors to determine whether coefficients are statistically significant.
20
CHAPTER IV
DATA
In this chapter, we explain the data required by event study and cross sectional regression. First, we collect event samples by filtering all M&A deals completed in the US. Second, we collect stock prices of target firms. Third, we gather data regarding target firm and deal characteristics.
4.1 Event Sample
We use the merger and acquisitions listed in the MADL (Merger and Acquisition Deal List) function of Bloomberg Terminal™. We use filters to have an event sample in which acquirers are private equity firms, deal type is LBO, and target firms are publicly listed in US. We choose public announcement dates as our event dates. This event sample covers all 583 deals completed between 1 January 1980 and 31 December 2016. The search criteria are in Appendix A.
We divide the sample period into three subsamples. The first subsample covers before-crisis period of January 1980 – November 2007, second subsample covers crisis period of December 2007 – June 2009, and third subsample covers after-crisis period of July 2009 – December 2016. We divide subsamples
according to global financial crisis dates stated by the National Bureau of Economics Research.
21
This division serves two objectives. The first objective is to mitigate the distorting effect of a financial crisis on the event study results. During a financial crisis, investors risk appetite changes drastically and it affects the M&A market and paid premiums disproportionately. The second objective is to study a period that has not been covered by other papers.
4.2 Collecting Daily Stock Prices
We collect the daily prices of target firms (P!,!) and S&P 500 Index from the
Bloomberg Terminal™. Bloomberg provides the end of day closing price of each target firm. We use tickers to collect stock price data; however, our sample size reduces from 583 to 581 due to missing ticker information. Equation 10 shows that we calculate daily stock returns (R!,!) as daily percentage change in the stock prices.
(10) R!,!= !!,!!!!,!!!
!!,!!!
For each daily stock returns, we calculate daily returns of the S&P 500 Index. We create time series of daily stock returns and daily S&P 500 Index returns according to the estimation window and event window periods. At this point, our sample size reduces from 581 to 396 due to missing stock price information.
4.3 Target Firm Characteristics
We use historical data regarding target firm characteristics on the event day. We collect the data from Bloomberg Terminal. Table 3 shows our target firm
22
Table 3: Target Firm Characteristics
This table shows definition, unit, and Bloomberg Terminal Field of each target firm characteristics.
Target Firm Characteristics Debt Ratio
Definition: The ratio of total debt to total asset. Unit: percentage multiplied by 100
Bloomberg Terminal Field: TOT_DEBT_TO_TOT_ASSET Free Cash Flow
Definition: Operating cash flow minus capital expenditures. Unit: million USD
Bloomberg Terminal Field: CF_FREE_CASH_FLOW Free Float Percentage
Definition: The ratio of shares floating in the stock market to total shares. Unit: percentage multiplied by 100
Bloomberg Terminal Field: EQY_FREE_FLOAT_PCT Operating Margin
Definition: The ratio of operating income to revenue. Unit: million USD
Bloomberg Terminal Field: OPER_MARGIN Market Capitalization
Definition: Total market capitalization. Unit: million USD
Bloomberg Terminal Field: HISTORICAL_MARKET_CAP
We calculate industry adjusted operating margins. We divide target firms’
operating margins by operating margins of their corresponding S&P 500 Industry Indices. Also, we calculate normalized market capitalization by taking the natural logarithm of the target firm’s market capitalizations.
23
4.4 Deal Characteristics
We compile deal characteristics and announcement dates from Bloomberg. We also collect data regarding deal type. If there are multiple acquirers, then we differentiate these deals as club deals. Due to missing firm characteristic data, our sample size reduces from 396 to 209. Appendix B lists 209 deals. Table 4 shows how our sample size reduces from 583 to 209 during the data collection process.
Table 4: Data Collection and Sample Size
This table summarizes how sample size is reduced from the initial sample size to the sample size used in our empirical studies. We start with sample size of 583 events and our sample size is reduced to 209 events after filtering out the events with missing data.
Data Collection Sample Size
Public to private leveraged buyout deals are collected from Bloomberg Terminal.
583 Target firms with missing Ticker data are
eliminated.
581 Target firms that cannot meet the
minimum number of price data requirement are eliminated.
396
Target firms with missing firm characteristics are eliminated.
209
4.5 Descriptive Statistics on the Deal and Target Firm Characteristics
The full sample includes 209 public to private leveraged buyout deals. All target firms are publicly listed in US and all acquirers are private equity firms. All deals lead to 100% ownership of the target firm, either by purchasing 100% of the shares or purchasing the remaining shares left over from the previous deals. Table 5 shows descriptive statistics of deal characteristics.
24
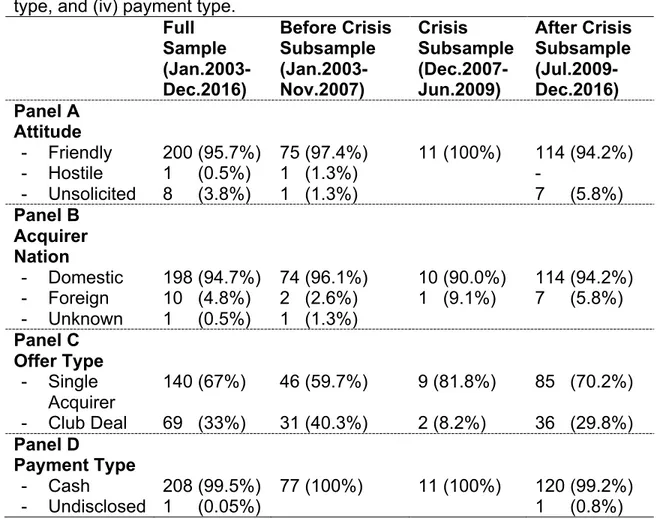
Table 5: Descriptive Statistics of Deal Characteristics
Panel A to D present sample size by: (i) attitude, (ii) acquirer nation, (iii) offer type, and (iv) payment type.
Full Sample (Jan.2003-Dec.2016) Before Crisis Subsample (Jan.2003-Nov.2007) Crisis Subsample (Dec.2007-Jun.2009) After Crisis Subsample (Jul.2009-Dec.2016) Panel A Attitude - Friendly - Hostile - Unsolicited 200 (95.7%) 1 (0.5%) 8 (3.8%) 75 (97.4%) 1 (1.3%) 1 (1.3%) 11 (100%) 114 (94.2%) - 7 (5.8%) Panel B Acquirer Nation - Domestic - Foreign - Unknown 198 (94.7%) 10 (4.8%) 1 (0.5%) 74 (96.1%) 2 (2.6%) 1 (1.3%) 10 (90.0%) 1 (9.1%) 114 (94.2%) 7 (5.8%) Panel C Offer Type - Single Acquirer - Club Deal 140 (67%) 69 (33%) 46 (59.7%) 31 (40.3%) 9 (81.8%) 2 (8.2%) 85 (70.2%) 36 (29.8%) Panel D Payment Type - Cash - Undisclosed 208 (99.5%) 1 (0.05%) 77 (100%) 11 (100%) 120 (99.2%) 1 (0.8%) Private equity firms avoid bidding competitions and prefer no form of hostile takeovers. Therefore, 95.7% of the full sample is friendly takeovers. The ratios of friendly takeovers in before crisis and after crisis subsamples are 97.4% and 94.2%, respectively. US private equity firms constitute 94.7% of the full sample. Foreign private equity firms from UK, France, China, and Australia conduct 10 deals. Single private equity acquirers conduct 67% of the full sample. The ratios of club deals in before crisis and after crisis subsamples are 40.3% and 29.8%, respectively. Payment type of all deals is cash. Table 6 shows the yearly
25
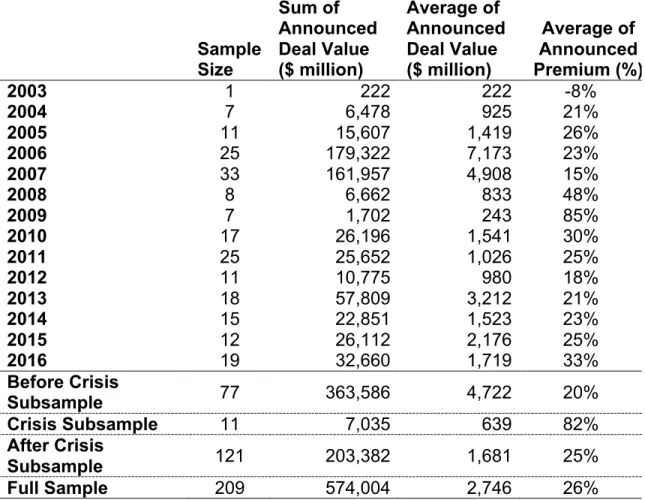
Table 6: Deals Across the Sample Period
This table shows total number of completed LBOs, announced deal values and premiums in each sample year.
Sample Size Sum of Announced Deal Value ($ million) Average of Announced Deal Value ($ million) Average of Announced Premium (%) 2003 1 222 222 -8% 2004 7 6,478 925 21% 2005 11 15,607 1,419 26% 2006 25 179,322 7,173 23% 2007 33 161,957 4,908 15% 2008 8 6,662 833 48% 2009 7 1,702 243 85% 2010 17 26,196 1,541 30% 2011 25 25,652 1,026 25% 2012 11 10,775 980 18% 2013 18 57,809 3,212 21% 2014 15 22,851 1,523 23% 2015 12 26,112 2,176 25% 2016 19 32,660 1,719 33% Before Crisis Subsample 77 363,586 4,722 20% Crisis Subsample 11 7,035 639 82% After Crisis Subsample 121 203,382 1,681 25% Full Sample 209 574,004 2,746 26%
The 209 deals account for 574 billion USD in total and 2.746 billion USD per transaction. We find that the average of announced premium is 26%. The 77 deals in the before crisis subsample have 4.722 billion USD average deal value. The after crisis subsample has relatively lower average deal value of 1.681 billion USD per deal. The average announced premiums in before crisis and after crisis subsamples are 20% and 25%, respectively.
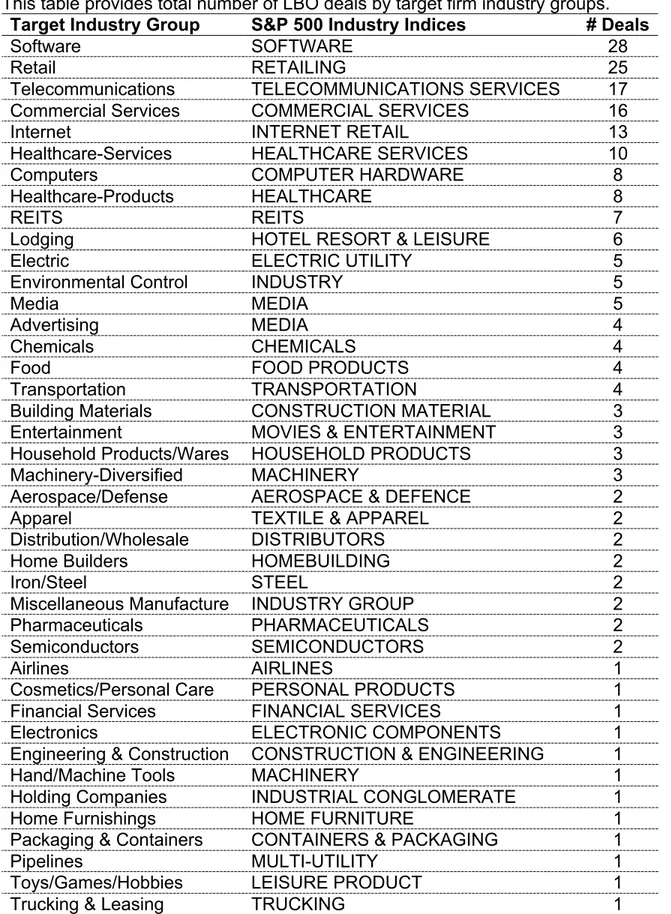
In order to calculate industry adjusted operating margin, we gather the industry information of each target firm from the Bloomberg Terminal. We match each industry group with the corresponding S&P500 Industry Indices. Table 7 shows target industry groups and corresponding S&P 500 Industry Indices.
26
Table 7: Industry Analysis of Transaction Sample
This table provides total number of LBO deals by target firm industry groups.
Target Industry Group S&P 500 Industry Indices # Deals
Software SOFTWARE 28
Retail RETAILING 25
Telecommunications TELECOMMUNICATIONS SERVICES 17
Commercial Services COMMERCIAL SERVICES 16
Internet INTERNET RETAIL 13
Healthcare-Services HEALTHCARE SERVICES 10
Computers COMPUTER HARDWARE 8
Healthcare-Products HEALTHCARE 8
REITS REITS 7
Lodging HOTEL RESORT & LEISURE 6
Electric ELECTRIC UTILITY 5
Environmental Control INDUSTRY 5
Media MEDIA 5
Advertising MEDIA 4
Chemicals CHEMICALS 4
Food FOOD PRODUCTS 4
Transportation TRANSPORTATION 4
Building Materials CONSTRUCTION MATERIAL 3
Entertainment MOVIES & ENTERTAINMENT 3
Household Products/Wares HOUSEHOLD PRODUCTS 3
Machinery-Diversified MACHINERY 3
Aerospace/Defense AEROSPACE & DEFENCE 2
Apparel TEXTILE & APPAREL 2
Distribution/Wholesale DISTRIBUTORS 2
Home Builders HOMEBUILDING 2
Iron/Steel STEEL 2
Miscellaneous Manufacture INDUSTRY GROUP 2
Pharmaceuticals PHARMACEUTICALS 2
Semiconductors SEMICONDUCTORS 2
Airlines AIRLINES 1
Cosmetics/Personal Care PERSONAL PRODUCTS 1
Financial Services FINANCIAL SERVICES 1
Electronics ELECTRONIC COMPONENTS 1
Engineering & Construction CONSTRUCTION & ENGINEERING 1
Hand/Machine Tools MACHINERY 1
Holding Companies INDUSTRIAL CONGLOMERATE 1
Home Furnishings HOME FURNITURE 1
Packaging & Containers CONTAINERS & PACKAGING 1
Pipelines MULTI-UTILITY 1
Toys/Games/Hobbies LEISURE PRODUCT 1
27
The software industry has the highest presence in private equity deals with 28 deals. Other important industry groups such as retail, telecommunication, commercial services, internet, and healthcare services have 25, 17, 16, 13, and 10 sample size, respectively. Table 8 presents the summary statistics of target firm characteristics.
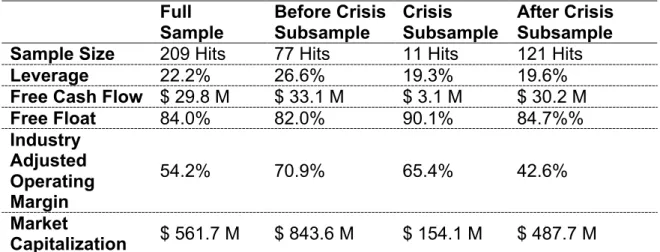
Table 8: Target Firm Characteristics
This table gives average firm characteristics for full sample, before crisis
subsample, crisis subsample, and after crisis subsample. Total sample sizes are provided in terms of number of events. Average leverage, free float percentage, and industry adjusted operating margin are provided in percentage. Average free cash flow and market capitalization are provided in million USD.
Full Sample Before Crisis Subsample Crisis Subsample After Crisis Subsample Sample Size 209 Hits 77 Hits 11 Hits 121 Hits
Leverage 22.2% 26.6% 19.3% 19.6%
Free Cash Flow $ 29.8 M $ 33.1 M $ 3.1 M $ 30.2 M
Free Float 84.0% 82.0% 90.1% 84.7%% Industry Adjusted Operating Margin 54.2% 70.9% 65.4% 42.6% Market Capitalization $ 561.7 M $ 843.6 M $ 154.1 M $ 487.7 M
The average debt ratio of 209 target firms is 22.2% in the full sample. The average debt ratios in the before crisis and after crisis subsamples are 26.6% and 19.6%, respectively. This result shows that average debt ratio decreases after the global financial crisis. The average free cash flow of target firms in full, before crisis, crisis and after crisis samples are 29.8, 33.1, 3.1, and 30.2 million USD, respectively. In the full sample, the average free float percentage and industry adjusted operating margins are 84.0% and 54.2%, respectively. Free float percentages remain at the same level after the global financial crisis. However, industry adjusted operating margin decreases from 70.9% in before crisis period to 42.6% in after crisis period. The average market capitalization of 209 target firms is 561.7 million USD in the full sample. The average market
28
capitalization in the before crisis and after crisis subsamples are 843.6 million USD and 487.7 million USD, respectively.
29
CHAPTER V
EMPIRICAL RESULTS
First, we calculate 3-day cumulative abnormal returns around deal
announcements. Second, we regress target firm and deal characteristics on cumulative abnormal returns. Third, we investigate whether there are any
differences in the market reaction and firm characteristics in the full, before crisis and after crisis samples.
5.1 Market Reaction to Deal Announcements
We follow the event study methodology suggested by Brown and Warner (1985) in order to calculate market reaction to deal announcements. Table 9 and Table 10 report the results of the event studies in full and subsamples.
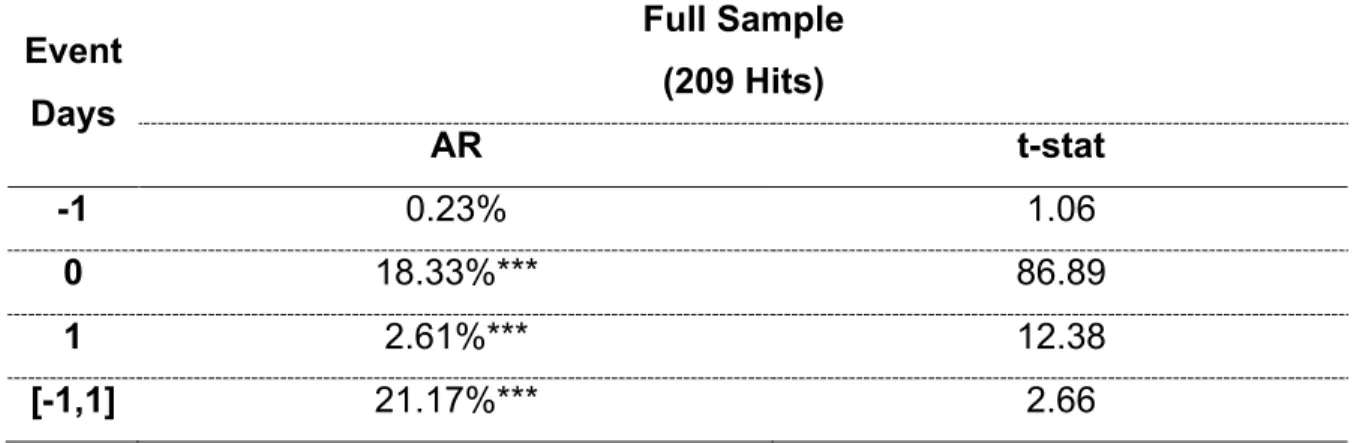
Table 9: Daily Abnormal Returns and CARs in Full Sample
This table gives daily abnormal returns and cumulative abnormal return in 3-day event window. This table shows abnormal returns and t-statistics in the full sample. Event Days Full Sample (209 Hits) AR t-stat -1 0.23% 1.06 0 18.33%*** 86.89 1 2.61%*** 12.38 [-1,1] 21.17%*** 2.66
30
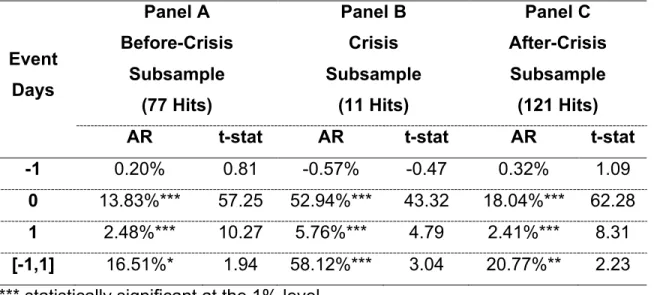
Table 10: Daily Abnormal Returns and CARs in Subsamples
This table gives daily abnormal returns and cumulative abnormal return in 3-day event window. Panel A shows abnormal returns and t-statistics in the before crisis subsample. Panel B shows abnormal returns and t-statistics in the crisis subsample. Panel C shows abnormal returns and t-statistics in the after crisis subsample. Event Days Panel A Before-Crisis Subsample (77 Hits) Panel B Crisis Subsample (11 Hits) Panel C After-Crisis Subsample (121 Hits) AR t-stat AR t-stat AR t-stat
-1 0.20% 0.81 -0.57% -0.47 0.32% 1.09
0 13.83%*** 57.25 52.94%*** 43.32 18.04%*** 62.28
1 2.48%*** 10.27 5.76%*** 4.79 2.41%*** 8.31
[-1,1] 16.51%* 1.94 58.12%*** 3.04 20.77%** 2.23 *** statistically significant at the 1% level
*** statistically significant at the 5% level
The abnormal return on the day prior to the deal is 0.23% in the full sample, 0.20% in the before crisis subsample, -0.57% in crisis subsample and 0.32% in the after crisis subsample. In full sample and subsamples, abnormal returns on the day prior to the deal are statistically insignificant. This result means that information leakage before the deal announcements is limited and does not lead to significant abnormal returns. On the event day, abnormal return is 18.33% in the full sample. Abnormal returns in the before crisis, crisis, and after crisis subsamples are 13.83%, 52.94%, and 18.04% respectively. In all samples, abnormal returns on the event day are statistically significant at 1% level. This result indicates that there are strong and positive market reactions to private equity deal announcements. On the day after the event, abnormal return is 2.61% in the full sample. Abnormal returns in the before crisis, crisis, and after crisis subsamples are 2.48%, 5.76%, and 2.41%, respectively. In all samples, abnormal returns on the day after the event are statistically significant at 1%
31
level. This result shows that relatively small market reaction remains after the event announcement.
Cumulative abnormal return in the 3-day event window average 21.17% in the full sample. In the before crisis, crisis, and after crisis subsamples, cumulative abnormal returns average 16.51%, 58.12%, and 20.77%, respectively. All 3-day CARs are statistically significant. These results show that private equity firms create value for shareholders of the target firms. In the full sample, our
cumulative abnormal returns in 3-day event window are consistent with the previous studies in the literature. Cumulative abnormal returns in the before crisis and after crisis subsamples show that market reaction to private equity deals increase after the global financial crisis. This result contributes to the private equity literature by providing evidence that following the global financial crisis private equity firms still create value for shareholders of the target firms. As a result, we reject the Hypothesis 0 which states that CARs in LBOs gained by the target firms are zero.
5.2 Cross Sectional Regression Results
We estimate cross sectional regression models for full sample and subsamples. Equitation 10 shows cross sectional regression model in the full sample.
(10) CAR! = β!+ β! Debt Ratio + β! FCF + β! Free Float Percentage +
β! Indsutry Adjusted Operating Margin +
β! Normalized Market Capitalization + β! !"#$ !"#$ +
β!(!"#$#$ !"#$%&) + ε!
The dependent variable is cumulative abnormal return in the 3-day event
window. The independent variables are target firm and deal characteristics. Debt ratio, free cash flow, free float percentage, industry adjusted operating margin and normalized market capitalization are target firm characteristics. Deals completed in crisis period and club deals with multiple acquirers are deal
32
characteristics. First five independent variables are proxies for target firm characteristics. Hypothesis 1 through 5 shows how the proxies of firm
characteristic may affect market reaction to private equity deal announcements. Hypothesis 1 (H1) claims that debt ratio will lead to higher CARs due to further tax shield benefits provided by LBOs. Hypothesis 2 (H2) claims that free cash flow will lead to higher CARs due to governance improvements provided by private equity firms. Hypothesis 3 (H3) claims that free float percentage will lead to higher CAR due to effective monitoring provided by private equity firms. Hypothesis 4 (H4) claims that low industry adjusted operating margins will lead to higher CARs due to operational improvements provided by private equity firms. Hypothesis 5 (H5) claims that small sized target firms are more likely to be undervalued and therefore will lead to higher CARs.
In terms of robustness check, we also introduce year and acquirer firm fixed effects. Year fixed effect represents 14 years (2003-2016) and acquirer firm fixed effect represents 149 private equity firms. Equitation 11 shows cross sectional regression model with year fixed effect.
(11) CAR! = β!+ β! Debt Ratio + β! FCF + β! Free Float Percentage + β! Indsutry Adjusted Operating Margin +
β! Normalized Market Capitalization + β! !"#$ !"#$ + β! !"#$#$ !"#$%& + !" β!
!!! (!"#$_!"#$%_!""#$%!) + ε!
Equitation 12 shows cross sectional regression model with year and acquirer firm fixed effects.
(12) CAR! = β!+ β! Debt Ratio + β! FCF + β! Free Float Percentage + β! Indsutry Adjusted Operating Margin +
β! Normalized Market Capitalization + β! !"#$ !"#$ +
β! !"#$#$ !"#$%& + !" β!
!!! (!"#$_!"#$%_!""#$%!) +
!"#β!
33
Equitation 13 shows cross sectional regression model that we use for before crisis and after crisis subsamples.
(13) CAR! = β!+ β! Debt Ratio + β! FCF + β! Free Float Percentage +
β! Indsutry Adjusted Operating Margin +
β! Normalized Market Capitalization + β! !"#$ !"#$ + ε!
In the cross sectional regression analysis, we test OLS assumptions such as heteroskedasticity. Table 11 and Table 12 show heteroskedasticity test results.
Table 11: Heteroskedasticity Test Results in Full Sample
This table shows Breusch Pagan test results in full sample models.
Model 1 Model 2 Model 3 Full Sample Full Sample Full Sample Fixed Effects - Year FE Year FE Acquirer Firm FE Heteroskedasticity
(Breusch Pagan Test) p.value 0.00% *** p.value 0.00% ***
p.value 2.07% **
Type of Robust
Standard Errors White SE White SE White SE
*** statistically significant at the 1% level *** statistically significant at the 5% level
Table 12: Heteroskedasticity Test Results in Subsamples
This table shows Breusch Pagan test results in subsample models.
Model 4 Model 5
Before Crisis Sample After Crisis Sample
Fixed Effects - -
Heteroskedasticity
(Breusch Pagan Test) p.value 70.49%
p.value 0.01% ***
Type of Robust
Standard Errors - White SE
34
We conduct Breusch Pagan Test and find that p-values in the full sample and after crisis subsample are statistical significant. Since there are
heteroskedasticity problems in all models, we choose White Standard Errors to calculate statistical significance of the independent variables.
We conduct three cross sectional regression models for the full sample. First model excludes all fixed effects. Second model includes only year fixed effect. Third model includes both year and acquirer firm fixed effects. There are also two cross sectional regression models for before crisis and after crisis
35
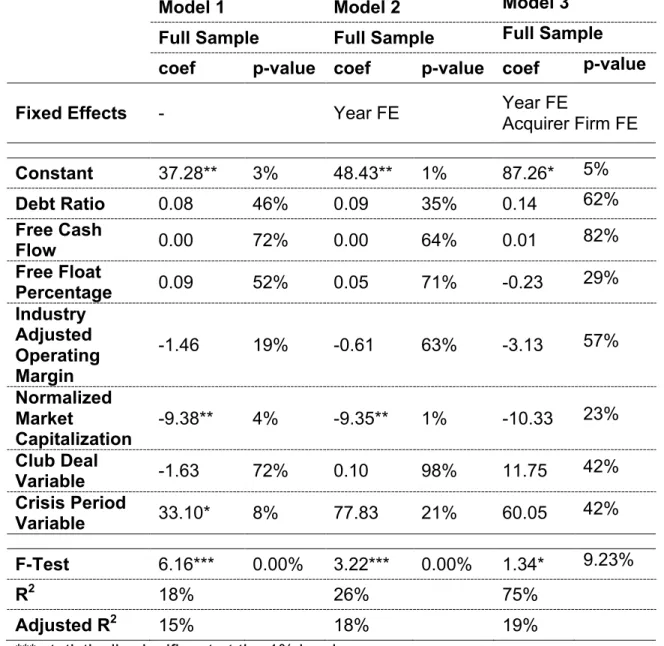
Table 13: Cross Sectional Regression Model Results in Full Sample
The dependent variable is CARs in 3-day event window. The independent variables are debt ratio, free cash flow, free float percentage, industry adjusted operating margin, normalized market capitalization, club deal and crisis period variables. Model 1 includes no fixed effects. Model 2 includes year fixed effect. Model 3 includes year and acquirer firm fixed effects. The number of
observations in the full sample is 209. We use White Standard Errors to calculate p-values in Model 1, Model 2, and Model 3.
Model 1 Model 2 Model 3 Full Sample Full Sample Full Sample coef p-value coef p-value coef p-value Fixed Effects - Year FE Year FE
Acquirer Firm FE Constant 37.28** 3% 48.43** 1% 87.26* 5% Debt Ratio 0.08 46% 0.09 35% 0.14 62% Free Cash Flow 0.00 72% 0.00 64% 0.01 82% Free Float Percentage 0.09 52% 0.05 71% -0.23 29% Industry Adjusted Operating Margin -1.46 19% -0.61 63% -3.13 57% Normalized Market Capitalization -9.38** 4% -9.35** 1% -10.33 23% Club Deal Variable -1.63 72% 0.10 98% 11.75 42% Crisis Period Variable 33.10* 8% 77.83 21% 60.05 42% F-Test 6.16*** 0.00% 3.22*** 0.00% 1.34* 9.23% R2 18% 26% 75% Adjusted R2 15% 18% 19%
*** statistically significant at the 1% level *** statistically significant at the 5% level *** statistically significant at the 10% level
36
Table 14: Cross Sectional Regression Model Results in Subsamples
The dependent variable is cumulative abnormal return in 3-day event window. The independent variables are debt ratio, free cash flow, free float percentage, industry adjusted operating margin, normalized market capitalization, and club deal variables. The numbers of observations in before crisis subsample, and after crisis subsample are 77, and 121, respectively. We use White Standard Errors to calculate p-values in Model 5.
Model 4 Model 5
Before Crisis Subsample After Crisis Subsample coef p-value coef p-value
Fixed Effects - - Constant 27.41** 3% 41.03** 3% Debt Ratio 0.15 18% 0.00 100% Free Cash Flow 0.00 100% -0.01 18% Free Float Percentage 0.16 19% -0.13 47% Industry Adjusted Operating Margin -1.96 21% -0.81 50% Normalized Market Capitalization -9.50** 3% -2.85 58% Club Deal Variable 2.84 60% -4.07 47% F-Test 1.87* 9% 1.14 34% R2 14% 6% Adjusted R2 6% 1%
*** statistically significant at the 1% level *** statistically significant at the 5% level *** statistically significant at the 10% level
37
We find support for the undervaluation hypotheses. In the full sample and before crisis subsample, coefficients of normalized market capitalization are -9.38, and -9.50, respectively. This statistically significant and negative relation for the market capitalization shows that small firm size leads to higher expected CARs in LBOs. However, significance of market capitalization decreases as we introduce fixed effects to the regression analysis. In Model 3, the coefficient of normalized market capitalization is -10.33 and statistically insignificant. We find no support for capital structure, agency cost of free cash flow, free float
percentage, and firm productivity hypotheses. Coefficients of debt ratio, free cash flow and industry adjusted operating margin are statistically insignificant in the full sample, and subsamples. Table 15 shows the summary of regression results and hypotheses. In terms of overall significance, we find that F-Test values in the full sample and before crisis subsample are statistically significant. However, F-Test value in the after crisis subsample is statistically insignificant. This result shows that independent variables have no explanatory power after the global financial crisis. This result is apparent in the R2 calculations. Adjusted R2 reduces from 6% in before crisis subsample to 1% in after crisis subsample.
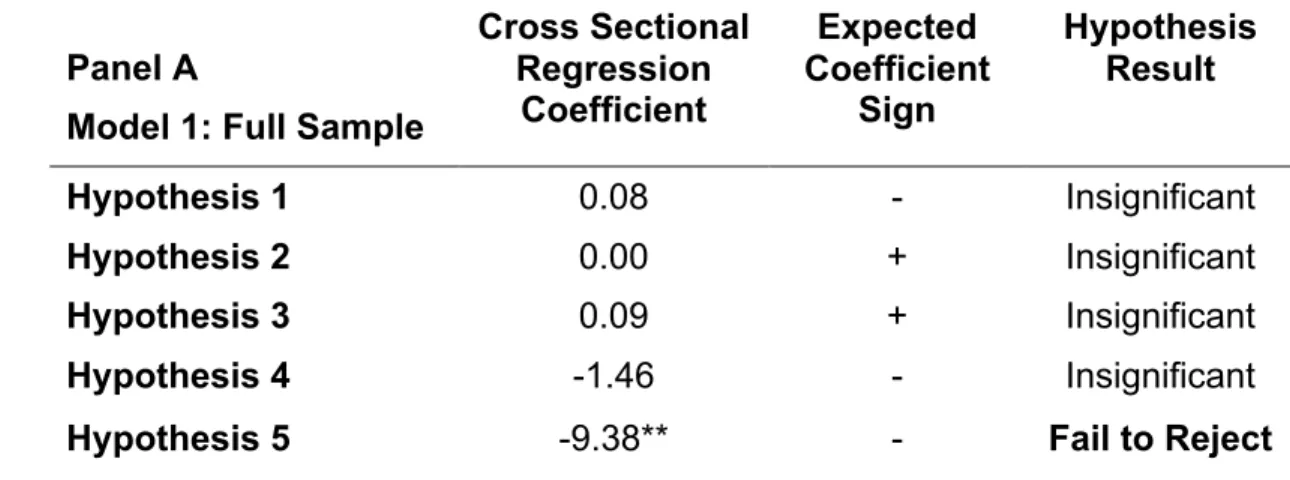
Table 15: Summary of Hypotheses and Regression Study Results
This table shows hypothesis results based on expected coefficient signs and cross sectional regression results.
Cross Sectional Regression Coefficient Expected Coefficient Sign Hypothesis Result Panel A
Model 1: Full Sample
Hypothesis 1 0.08 - Insignificant
Hypothesis 2 0.00 + Insignificant
Hypothesis 3 0.09 + Insignificant
Hypothesis 4 -1.46 - Insignificant
38
Table 15 (cont’d)
Panel B
Model 2: Full Sample
Hypothesis 1 0.09 - Insignificant
Hypothesis 2 0.00 + Insignificant
Hypothesis 3 0.05 + Insignificant
Hypothesis 4 -0.61 - Insignificant
Hypothesis 5 -9.35** - Fail to Reject Panel C
Model 3: Full Sample
Hypothesis 1 0.14 - Insignificant Hypothesis 2 0.01 + Insignificant Hypothesis 3 -0.23 + Insignificant Hypothesis 4 -3.13 - Insignificant Hypothesis 5 -10.33 - Insignificant Panel D
Model 4: Before Crisis Subsample
Hypothesis 1 0.15 - Insignificant
Hypothesis 2 0.00 + Insignificant
Hypothesis 3 0.16 + Insignificant
Hypothesis 4 -1.96 - Insignificant
Hypothesis 5 -9.50** - Fail to Reject Panel E
Model 5: After Crisis Subsample
Hypothesis 1 0.00 - Insignificant
Hypothesis 2 -0.01 + Insignificant
Hypothesis 3 -0.13 + Insignificant
Hypothesis 4 -0.81 - Insignificant
Hypothesis 5 -2.85 - Insignificant *** statistically significant at the 1% level
39
In the literature, there are mixed results for capital structure (H1) hypothesis. Carow and Roden (1997), Renneboog et al. (2007), and Achleitner et al. (2010) provide supporting results. In contracts, Billett et al. (2008) rejects the
hypothesis. For the agency cost of free cash flow (H2) hypothesis, Lehn and Poulsen (1989), Carow and Roden (1997), and Billett et al. (2008) find supporting results. Andres et al. (2007) find supporting result for shareholder concentration (H3) hypothesis. However, we find inconclusive results for capital structure, agency cost of free cash flow, and shareholder concentration
hypotheses in full sample and subsamples. Similar to Officer et al. (2010) and Bargeron et al. (2008), we find inconclusive results for firm productivity (H4) hypothesis in full sample and subsamples.
For the undervaluation (H5) hypothesis, Officer et al. (2010) and Billett et al. (2008) find supporting results. We fail to reject the undervaluation (H5) hypothesis and find supporting results in the full sample and before crisis subsample.
5.3 Summary of Empirical Results
Stock market reactions to private equity deal announcements in the 3-day event window prove positive and significant CARs at 21.17%. This result shows that private equity firms create value for shareholders of the target firms.
In the full sample and before crisis subsample, we find target firm characteristic such as market capitalization has explanatory power on the CARs. However, our cross sectional regression analysis provides inconclusive results in after crisis subsample.
40
CHAPTER VI
CONCLUSION
In this thesis, we analyze the value created by private equity firms in leveraged buyout deals. We conduct an event study to measure the market reactions to private equity deal announcements. In addition, we develop hypotheses regarding target firm characteristics in order to test factors affecting the value generated in private equity deals. The full sample covers the period between 2003 and 2016. In order to provide contribution to the literature, we investigate the effects of global financial crisis on the value creation in private equity deals. First, we find that the target firms gained 21.17% cumulative abnormal returns in full sample. For the before crisis and after crisis subsamples, cumulative
abnormal returns are 16.51% and 20.77%, respectively. Secondly, we analyze the factors behind the value creation of private equity deals. We conduct cross sectional regression that regress target firm and deal characteristics on
cumulative abnormal returns. As a result, we find that market capitalization has explanatory power on cumulative abnormal returns in full sample, and before crisis subsample. However, we find inconclusive results in after crisis
subsample.
41
BIBLIOGRAPHY
Achleitner, A.K., Andres, C., Betzer, A., & Weir, C. (2011). Wealth effects of private equity investments on the German stock market. The European Journal of Finance, 17(3), 217-239.
Admati, A.R., Pfleiderer, P., & Zechner J. (1994). Large Shareholder Activism, Risk Sharing, and Financial Market Equilibrium. The Journal of Political Economy, 102(6), 1097-1130.
Andres, C., Betzer, A., & Hoffmann, M. (2006). Going private via LBO - shareholder gains in the European market. In M. Busack, and D. Kaiser (Eds.), Handbuch Alternative Investments, Vol. 2. Gabler Verlag.
Ball, R., & Brown, P. (1968). An empirical evaluation of accounting income numbers. Journal of Accounting Research, 6(2), 159-178.
Bargeron, L.L., Schlingemann, F.P., Stulz, R.M., & Zutter, C.J. (2008). Why do private acquirers pay so little compared to public acquirers?. Journal of Financial Economics, 89(3), 375-390.
Billett, M.T., Jiang, Z., & Lie, E. (2010). The effect of change-in-control covenants on takeovers: evidence from leveraged buyouts. Journal of Corporate Finance, 16(1), 1-15.
Breusch, T.S., & Pagan, A.R. (1979). A Simple Test for Heteroskedasticity and Random Coefficient Variation. Econometrica, 47, 1287–1294.
Brown, D.T., Fee, C.E., & Thomas, S.E. (2009). Financial leverage and
bargaining power with suppliers: Evidence from leveraged buyouts. Journal of Corporate Finance, 15(2), 196-211.
Brown, S.J., & Warner, J.B. (1985). Using Daily Stock Returns: The Case of Events Studies. Journal of Financial Economics, 14, 3-31.
Carow, K.A., & Roden D.M. (1997). Determinants of the Stock Price Reaction to Leveraged. Journal of Economics and Finance, 21(3), 49-59.
DeAngelo, H., DeAngelo, L., &Rice, E.M. (1984). Going private: minority
freezeouts and stockholder wealth. Journal of Law and Economics, 27, 367-401.
Easterbrook, F.H., & Fischel, D.R. (1983). Voting in corporate law. Journal of Law and Economics, 26, 395-428.