An application of activity based cost management in a military dispensary
Tam metin
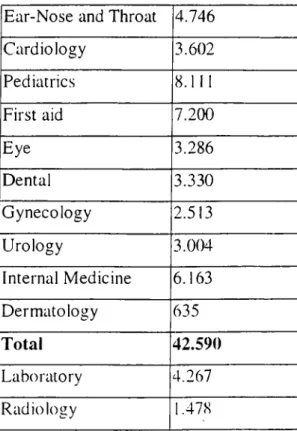
Şekil


Benzer Belgeler
Baysunda bulunan Cumhur Reisi Osman Hoca ve Harbiye Nazır Muavini Ali Riza Bey ler de Tirmiz (Pettekeser) gar nizoıı kumandanı Haşan Beye Buharaya gelen Enver
3- Kavak ağaçlarının ömrü kısa dır, 30- 40 yıl çınar ağacı için ço cukluk çağıdır, kavak için yaşlılık. 4- Bu ağaçlar da yaşlı sayılacak
madde şöyle diyor: “ Devletin ülkesi ve milletiyle bö lünmez bütünlüğü, milli egemenlik, cumhuriyet, milli güvenlik, kamu dü zeni, genel asayiş, kamu yararı, genel
Bayar (aktüel) günlük politika üzerinde hiçbir şey konuşmak istemiyor, bu meselelerin sual halinde kendisine yöneltilmesini bile hoş görmüyor!. Bakınız
It was largely due to Tâhir Efendi that the fashion f o r building summer residences along the shores o f the Bosphorus and particularly in Beykoz spread.. Soon this
Zafer ve inkılap nesli uzakta gördüğü par lak âleme varabilmek için bu yola tırmanır-ken, önüne dikilen kuvvetli mânî'leri yıkar-ken zaman zaman hitabeler
Aşağıda bir ilenin yerleşim planına ait bilgiler verilmiştir. Verilen bilgileri kullanarak yerleşim pla- nını tamamlayınız. Tamamladığınız plana göre aşağıdaki
Yukarıdaki sayı doğrusunda ardışık iki doğal sayı- nın arası 10 eş parçaya ayrılmıştır... TEST 11
