See discussions, stats, and author profiles for this publication at: https://www.researchgate.net/publication/260117087
Ecological risk assessment of heavy metals in surface sediments of northern
littoral zone of Lake Cildir, Ardahan, Turkey
Article in Environmental Monitoring and Assessment · February 2014 DOI: 10.1007/s10661-014-3662-4 · Source: PubMed
CITATIONS 37
READS 218 4 authors:
Some of the authors of this publication are also working on these related projects:
Tıbbi Bir Bitki Olan Arum maculatum'un Biyoaktivitesinin AraştırılmasıView project
Investigation of the Sediment Records of Kösemehmet Swamp (Kösemehmet Village-Erzurum) in terms of Holocene Climate Change and Other Paleogeographical RecordsView project
Serkan Kükrer Ardahan Üniversitesi 29PUBLICATIONS 93CITATIONS SEE PROFILE Sebahat Seker Ardahan Üniversitesi 6PUBLICATIONS 86CITATIONS SEE PROFILE
Zehra Tuğba Murathan
Malatya Turgut Özal Üniversitesi
35PUBLICATIONS 84CITATIONS SEE PROFILE Banu Kutlu Munzur Üniversitesi 33PUBLICATIONS 132CITATIONS SEE PROFILE
All content following this page was uploaded by Banu Kutlu on 13 November 2017. The user has requested enhancement of the downloaded file.
1 23
Environmental Monitoring and
Assessment
An International Journal Devoted to
Progress in the Use of Monitoring Data
in Assessing Environmental Risks to
Man and the Environment
ISSN 0167-6369
Volume 186
Number 6
Environ Monit Assess (2014)
186:3847-3857
DOI 10.1007/s10661-014-3662-4
in surface sediments of northern littoral
zone of Lake Çıldır, Ardahan, Turkey
Serkan Kükrer, Sebahat Şeker, Z. Tuğba
Abacı & Banu Kutlu
1 23
Your article is protected by copyright and
all rights are held exclusively by Springer
International Publishing Switzerland. This
e-offprint is for personal use only and shall not
be self-archived in electronic repositories. If
you wish to self-archive your article, please
use the accepted manuscript version for
posting on your own website. You may
further deposit the accepted manuscript
version in any repository, provided it is only
made publicly available 12 months after
official publication or later and provided
acknowledgement is given to the original
source of publication and a link is inserted
to the published article on Springer's
website. The link must be accompanied by
the following text: "The final publication is
available at link.springer.com”.
Ecological risk assessment of heavy metals in surface
sediments of northern littoral zone of Lake Ç
ıldır, Ardahan,
Turkey
Serkan Kükrer&SebahatŞeker&Z. Tuğba Abacı&
Banu Kutlu
Received: 27 July 2013 / Accepted: 21 January 2014 / Published online: 6 February 2014 # Springer International Publishing Switzerland 2014
Abstract In this paper, the heavy metal levels (Cu, Pb, Zn, Ni, Mn, Fe, As, Cd, Cr, Hg), organic carbon, and chlorophyll degradation products were studied to prove their ecological effects in Lake Çıldır, where fossil fuels are used as an energy source in the studied area for most of the year, and domestic waste from settlements is discharged directly into the lake. Sediment samples were collected from six sites on the northern shore of Çıldır Lake, Turkey in November 2012. Enrichment (EF) and contamination factor (CF) values were determined, and Pollution Load (PLI) and Potential Ecological Risk (PER) indices were calculated. Average concentrations of heavy metals in the sediments were, in descending order, Fe > Mn > Zn > Ni > Cr > Cu > Pb > As > Cd > Hg, respec-tively. According to mean values, the source of these elements may be considered natural due to lack of enrich-ment in Cu, Pb, Zn, Ni, and Cr in the sedienrich-ment samples. Regarding enrichment of As, Cd, Mn, and Hg, the highest
EF belongs to Hg. PLI and PER values indicate there are moderate ecological risk in the lake.
Keywords Lake Çıldır. Sediment . Heavy metal .
Ecological assessment
Introduction
Heavy metals are considered to be point or nonpoint pollutant sources of lakes, seas, and rivers. In general, heavy metals originate from terrestrial flows, atmospheric deposition, and waste water discharge in water
ecosys-tems (Guo et al.2010). Heavy metals tend to accumulate
in water, sediment, and biota and do not easily decom-pose. Because they are not degradable and metabolize easily, heavy metals are stable and therefore accumulate in soft tissues and show toxicity in living organisms
(Sures et al. 2012). Furthermore, they do not dissolve
easily nor are absorbed by solid suspended matter in the
water matrix (Jain et al. 2008). The study of sediments
yields important insights regarding the amount of contam-inants precipitated as a suspended load from water bodies. Metals found in sediments as well as soils are either natural or anthropogenic in origin. Even though the level of metals within sediments and soils in rural areas is expected to be quite low, they may exist in higher
amounts in some soils (Kahkonen et al. 1997). An
in-crease in heavy metal concentrations due to anthropo-genic impacts gives rise to environmental problems in the coastal areas of lakes, seas, and rivers. This can create negative impacts on organisms when the concentrations
Environ Monit Assess (2014) 186:3847–3857
DOI 10.1007/s10661-014-3662-4
S. Kükrer (*)
Department of Geography, Faculty of Social Sciences and Humanities, Ardahan University, Ardahan, Turkey e-mail: [email protected]
S.Şeker
Department of Environmental Engineering, Faculty of Engineering, Ardahan University, Ardahan, Turkey
Z. T. Abacı
Department of Food Engineering, Faculty of Engineering, Ardahan University, Ardahan, Turkey
B. Kutlu
Department of Hydrobiology, Faculty of Fisheries, Tunceli University, Tunceli, Turkey
are higher than their tolerance limits (Kannan et al.
2008). One of the major sources of metal pollution in
marine and freshwater systems comprises outputs from domestic wastewaters, notably if enriched in As, Cr, Cu, Mn, and Ni. In addition, coal-burning and other power plants are the main agents of effluents such as As, Hg, and Se. Other heavy metals, such as Cd, Ni, Pb, and Se, are released from non-ferrous metal smelteries. Cr, Mo, Sb, and Zn from iron and steel plants, as well as As, Mn, and Pb from dumping of sewage sludge, are among the
main contaminants (Nriago and Pacyna1988). As and
Cd can also increase due to agricultural activities (Bai
et al. 2011a, 2012). Copper and zinc are the two
micronutrients for aquatic life in all natural waters and
sediments (Bai et al.2011b) but both of them are known
as toxic compounds at higher concentrations. Generally, Fe has highest value among the metals because it is an
important compound of Earth’s crust (Mico et al.2006;
Bai et al.2011c; Kükrer2013).
Water reservoirs accumulate vast amounts of heavy metals and organic matter, for different reasons. Large lakes are mostly oligotrophic and have low carbon con-centrations since carbon precipitates five times slower
than in small lakes (Turcq et al. 2002). Usually the
organic materials arise from autochthonous and alloch-thonous sources. While autochalloch-thonous sources are pro-duced by phytoplankton, allochthonous sources origi-nate from terrestrial plants and macrophytes in lakes
(Meyers and Teranes 2001). Additionally, discharge
waters from settlement areas around a lake are an im-portant source of organic and inorganic enrichment.
The monitoring of organic carbon and chlorophyll level (as a source of organic carbon) in sediment is important. Besides this, the linear relationship between organic car-bon and heavy metals provides a convenient insight into heavy metal levels. Hence, studies on lake sediments play a key role in assessment of aquatic environmental pollu-tion. In this paper, the heavy metal levels, organic carbon and chlorophyll degradation products (CDP), together
with their ecological effects, were studied in Lake Çıldır,
where fossil fuels are used as an energy source in the studied area for most of the year, and domestic waste from settlements is discharged directly into the lake.
Materials and methods
With an area of approximately 115 km2and a depth of
42 m (Atalay1978), fresh water Lake Çıldır constitutes
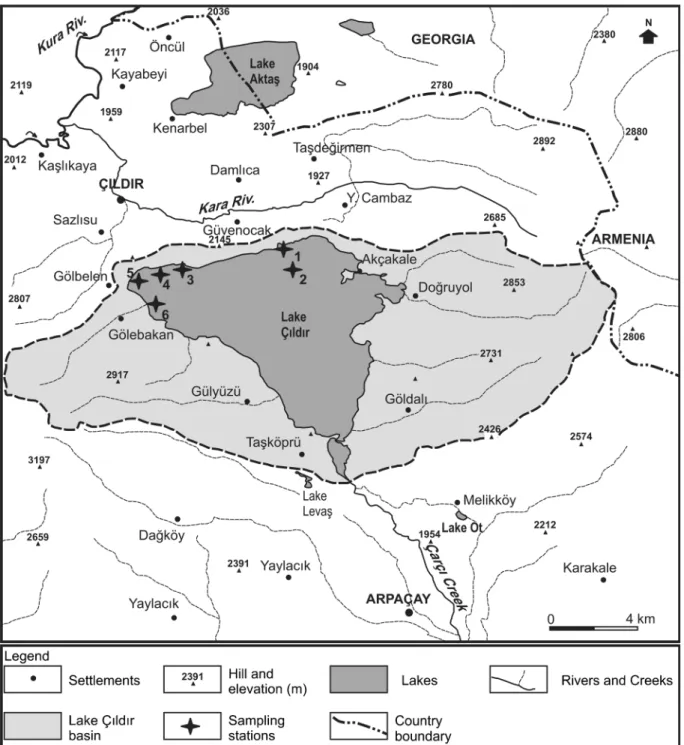
the second largest lake in the Eastern Anatolian Region, NE Turkey. The lake basin is delimited to the north by an east–west aligned volcanic ridge at altitudes between 2,000 and 2,150 m. The surface of the lake, which is frozen for about 6 months in harsh winters, lies at an elevation of 1,959 m. It has a triangular shape with a long north–south axis of 18.3 km and a shorter axis of 16.2 km from east to west. Excess waters of the lake are
discharged by the Çarçı Stream, a northern tributary of
the Arpaçay River to the south.
Sediment samples were collected from six selected
stations (Fig.1) in the littoral zone along the northern
shores of Çıldır Lake using Van Veen Grab. Some of the samples were stored dry at room temperature, and some
were stored wet at−18 °C. Samples which were dried
and stored for analyses of organic carbon and heavy metal were powdered in a mortar. Wet sediment samples were used for analysis of the CDP. Organic carbon values were determined according to the Modified Wakley–Black Titration Method (Gaudette et al.
1974). CDP were analyzed through acetone extraction
and spectrophotometry (Lorenzen1971).
Concentrations of Cu, Pb, Zn, Ni, Mn, Fe, As, Cd, Cr, and Hg were determined in the digested phase by induc-tively coupled plasma mass spectrometer (ICP–MS) analysis (ACME Analytical Labs, Vancouver, BC, Canada). The prepared sample is digested with a mod-ified aqua regia solution of equal parts concentrated
HCl, HNO3, and DI H2O for 1 h in a heating block.
Sample was made up to volume with dilute HCl. Quality control was assessed using duplicates, method blanks, and internal standard reference material (DS 9) obtained from ACME Analytical Labs. The values obtained (mg/kg) for the analyses of this sample were as follows:
Element Observed Certified Detection limits
Cu 104 108 0.01 Pb 118 126 0.01 Zn 319.6 317 0.1 Ni 38.7 40.3 0.1 Mn 575 575 1 Fe 23,000 23,300 100 As 25 25.5 0.1 Cd 2.41 2.40 0.01 Cr 110.7 121 0.5 Hg 0.0203 0.0200 0.005
3848 Environ Monit Assess (2014) 186:3847–3857
Two techniques were used to determine contamina-tion. Firstly, the enrichment factor (EF) was used to determine the anthropogenic contribution to the heavy metal concentration in the sediment (Zhang et al.
2007). This factor was obtained by dividing the
mea-sured metal/Al (or Fe) rate into the metal/Al (or Fe)
rate from the period before contamination. In these calculations, either Al or Fe was preferred as it was conservative and free from anthropogenic effects. We used Fe to calculate the EF (and also contamination factor (CF)), which is commonly used to normalize metal concentrations in order to reduce the influence
Fig. 1 Location of sampling stations at Lake Çıldır
of particle grain size (Zhang et al. 2007). Several authors have successfully used iron to normalize
heavy metal contaminants (Zhang et al. 2007; Esen
et al. 2010; Kükrer 2013). Background values for
trace metals calculated from Lake Çıldır sediments were used in this study as background levels. Evaluations were made according to Sutherland
(2000), where as follows:
EF<2, deficiency to minimal enrichment EF=2–5, moderate enrichment
EF=5–20, significant enrichment
EF=20–40, very high enrichment EF>40, extremely high enrichment
The second method utilized was the CF, calculated as the ratio between metal content of the present sediment and normal concentration levels, thereby reflecting metal enrichment of the sediment. CF was
classified into four groups, as per Hakanson (1980),
as below:
CF<1, low contamination
1≤CF<3, moderately contaminated
3≤CF<6, considerably contaminated
CF>6, very high contamination
In order to calculate background levels of Lake Çıldır, a total of six core sediments collected from six different stations along east–west and north–south directions were analyzed. Heavy metal data were normalized using Al values. The obtained values were standardized to fit normal distribution. After normal probability graph was plotted for each heavy metal, cluster of lowest values was selected, mean of which with a confidence interval of 95 % was determined as a background level.
To determine environmental quality of the sediment, an integrated Pollution Load Index (PLI) was used,
according to Suresh et al. (2011). The PLI gave an
assessment of the overall toxicity status of the sample as a result of the contribution of the ten metals. The formula used for PLI was as follows:
PLI¼ CF1ð x CF2x……:CFnÞ1=n
The Potential Ecological Risk Index (PER) was used to evaluate the toxicity of metals in the sediment
(Hakanson1980). The formula for the PER of a single
heavy metal was
Efi ¼ Cfix Tfi
whereTfiis the response coefficient for the toxicity of a
single heavy metal, as formulated by Hakanson (1980).
Ci
fwas calculated as the ratio between sediment metal
content at a given station and background concentration levels. The corresponding coefficients, based on their toxicity, were the following: Hg=40, Cd=30, As=10,
Cu=Pb=Ni=5, Cr=2, and Zn=1 (Guo et al.2010).
The PER for various heavy metals in the sediments was calculated; thus.
PER¼ ∑Eif
The relationship between PER, Eif, and pollution
levels is given in Table1.
Analysis of relationships between variables was car-ried out using Pearson’s correlation test on data sets. Cluster analyzes were applied for determination of the distance between variables. Principal component analy-sis (PCA) was also utilized in order to learn which parameters were the main sources of variations between the studied parts of the lake.
Results and discussion Heavy metal content
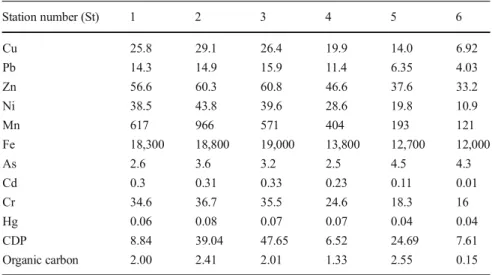
Heavy metal content, organic carbon, and the CDP of
the sediment samples are shown in Table2. A
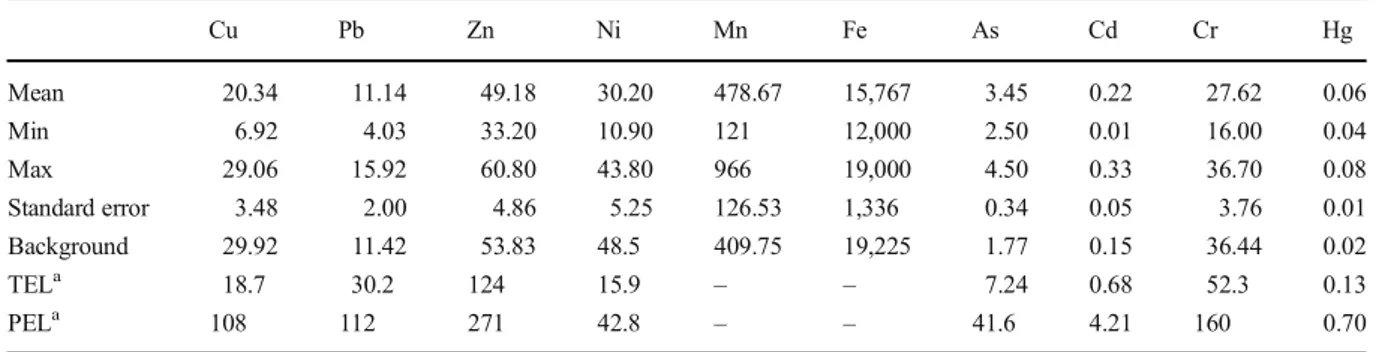
compar-ison between heavy metals and toxicological references (Threshold Effect Level (TEL) and Probable Effect
Level (PEL)) is given in Table3.
Average concentrations of heavy metals were, in descending order, Fe>Mn>Zn>Ni>Cr>Cu>Pb>As> Cd>Hg, respectively. According to the distribution of the stations, minimum levels were detected for all heavy metals at St6 except As. This station has a sandy soil structure, unlike the other sampling sites, and had the lowest organic level. Maximum levels varied according to the station. While maximum levels of Cu, Ni, Mn, Cr, and Hg were detected at St2; maximum levels of Pb, Zn, and Cd were detected at St3. Samples from these stations contained more than 2 % of the organic carbon levels. At variance with the others, As reached its highest value at St5. Background
3850 Environ Monit Assess (2014) 186:3847–3857
values were determined from sediment of Lake Çıldır for comparison of heavy metal levels. As and Hg had the higher value at all stations, while concentrations of Cu, Ni, and Fe were detected below the background levels. The content of Mn, Pb, and Zn were higher than the background values at St1, St2, and St3. Cr value was less than the background level at all stations except St2. The concentration of Cd showed a lower value than the background at St5 and St6. The two values were con-sidered as resulting from the toxic effects of heavy metals. It was assumed that while some negative influ-ences might occur rarely under TEL, most of expected influences would occur frequently above PEL. The con-centration of Pb, Zn, As, Cd, Cr, and Hg were below TEL at all stations of Lake Çıldır. Cu concentrations were detected higher than TEL and lower than PEL at all stations except St5 and St6. The concentrations of Ni were in between TEL and PEL, except at St6, where it was under TEL.
The levels of heavy metals found in some large lakes of Turkey and around the world are compared in
Table 4. From this, we can see that the concentration
of Cu in Lake Çıldır was higher than Ulubat, Beyşehir, and Kapulukaya while lower than Lake Hazar. The concentration of Pb and Zn in Lake Çıldır was lower or equal to all other lakes except Ulubat. Despite the Ni
measured at Lake Çıldır being close to that of Chapala, it
was higher than Sapanca, and all other lakes listed in
Table4have higher Ni. Although the value of Cr was
lower than all other lakes, it was higher than Sapanca and Ulubat. The level of Hg was higher than the Yangtze (China) while it was lower than Kapulukaya.
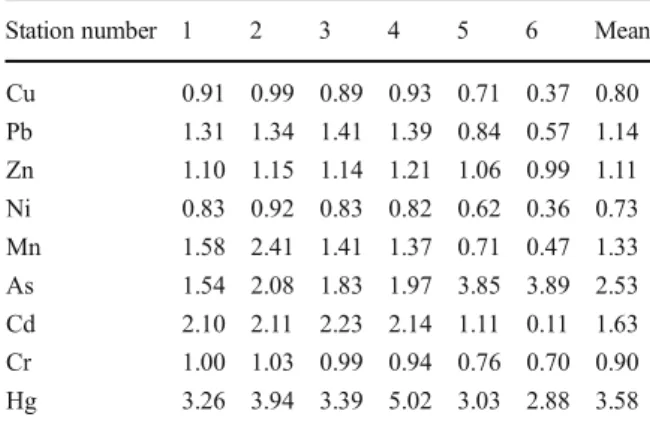
Enrichment factor
Enrichment factor is an important tool for determining possible sources of heavy metals. Thanks to this meth-od, it is possible to detect whether the sources of heavy metals are natural or anthropogenic. The values of EF in
Lake Çıldır are shown in Table5.
The EF values are, from highest to lowest concentra-tion, Hg>As>Cd>Mn>Pb>Zn>Cr>Cu>Ni, respec-tively. Whereas EF was not detected higher than 2, it is assumed that the source of these elements is natural. Table 1 Relationship between
PER, Eifand pollution levels
(from Guo et al.2010)
Scope of potential
ecological risk index (Ei
f)
Ecological risk level of single factor pollution
Scope of PER General level of
potential ecological risk
Eif<40 Low PER<150 Low grade
40≤Eif<80 Moderate 150≤PER<300 Moderate
80≤Eif<160 Higher 300≤PER<600 Severe
160≤Ei
f<320 High 600≤PER Serious
320≤Ei
f Serious
Table 2 Concentration of heavy metal, chlorophyll degradation products (CDP) (mg/kg dry weight) and organic carbon (%) in
sediments from Lake Çıldır
Station number (St) 1 2 3 4 5 6 Cu 25.8 29.1 26.4 19.9 14.0 6.92 Pb 14.3 14.9 15.9 11.4 6.35 4.03 Zn 56.6 60.3 60.8 46.6 37.6 33.2 Ni 38.5 43.8 39.6 28.6 19.8 10.9 Mn 617 966 571 404 193 121 Fe 18,300 18,800 19,000 13,800 12,700 12,000 As 2.6 3.6 3.2 2.5 4.5 4.3 Cd 0.3 0.31 0.33 0.23 0.11 0.01 Cr 34.6 36.7 35.5 24.6 18.3 16 Hg 0.06 0.08 0.07 0.07 0.04 0.04 CDP 8.84 39.04 47.65 6.52 24.69 7.61 Organic carbon 2.00 2.41 2.01 1.33 2.55 0.15
The highest enrichment found was for Hg, which was
present at a“moderate” level at all stations except St4
where EF value indicates “significant” level. The
highest As enrichment was detected at St5 and St6. Minimal contamination was determined for Zn, Ni, Pb, and Cr at all stations. Although there was moderate enrichment at St2, anthropogenic effects were not detected at other stations for Mn. Moderate contami-nation was detected at St1, St2, St3, and St4 for Cd.
Bai et al. (2012) explained that higher As and Cd
values could be originated from agrochemicals and fertilizers. Artificial fertilizers and pesticides contain large amounts of toxic heavy metals, especially Cd,
Pb, Ni, As, and Cu (Sönmez et al. 2008). Levels of
Pb, Cd, and As in artificial fertilizers have been proven to exceed maximum limits in Turkey (Köleli
and Kantar 2005). It is probable that the enrichment
of As and Cd originated from agricultural activities
around Lake Çıldır.
Contamination factor
Calculated CF values are shown in Table6. The mean
values of heavy metals with the highest CF are Hg> As>Cd>Mn>Pb>Zn>Fe>Cr>Cu>Ni, respectively. Table 3 Descriptive statistics of heavy metal values, background levels (mg/kg), and TEL and PEL values
Cu Pb Zn Ni Mn Fe As Cd Cr Hg Mean 20.34 11.14 49.18 30.20 478.67 15,767 3.45 0.22 27.62 0.06 Min 6.92 4.03 33.20 10.90 121 12,000 2.50 0.01 16.00 0.04 Max 29.06 15.92 60.80 43.80 966 19,000 4.50 0.33 36.70 0.08 Standard error 3.48 2.00 4.86 5.25 126.53 1,336 0.34 0.05 3.76 0.01 Background 29.92 11.42 53.83 48.5 409.75 19,225 1.77 0.15 36.44 0.02 TELa 18.7 30.2 124 15.9 – – 7.24 0.68 52.3 0.13 PELa 108 112 271 42.8 – – 41.6 4.21 160 0.70 a MacDonald (1994)
Table 4 Comparison of concentration of heavy metals found in sediment of lakes in Turkey and various other countries
Lake Cu Pb Zn Ni Mn Fe As Cd Cr Hg
Ulubat, Turkeya 0.75 1.42 3.89 – – – – 0.078 2.95 –
Beyşehir, Turkeyb 5.44–10.47 – 10.3–58.05 – 57.665–1,029 3,466–15,136 – – – –
Kapulukaya, Turkeyc 16.25 22.58 66.15 68.06 713.27 2,430 31.23 0.83 559.2 1.19 Sapanca, Turkeyd 26.68 15.20 62 26.72 337.81 – – 0.29 19.09 – Veeranam, Indiae 94.12 30.06 180.08 63.61 – – – 0.81 88.20 – Hazar, Turkeyf 10–64 ND 46–210 38–130 85–625 3,650–30,000 – – 17–79 – Yangtze, Chinag 343 57.78 296.78 40.44 – – 16.03 0.57 119.2 0.32 Chapalah, Mexico 29.26 81.74 102.75 32.24 – 3.97 % – – 66.12 – Çıldır, Turkey 20.34 11.14 49.18 30.20 478.67 1,5767 3.45 0.22 27.62 0.66 a Barlas et al.2005 bÖzan2008 cKankılıç et al. 2013 d Duman et al.2007 e Suresh et al.2012 f Özmen et al.2004 gYang et al.2009 h Rozales-Hoz et al.2000
3852 Environ Monit Assess (2014) 186:3847–3857
According to the mean values (Table 6), moderate enrichment was determined for Hg, As, Mn, and Cd while a low CF was found for other elements. Low contamination was detected for Cu, Ni, and Fe, at all stations. Mn, Zn, and Pb had moderate CF at St1, St2, and St3, whereas Cr had only found at St2. Sediments were moderately contaminated for As at all sampling sites. Moderate contamination was detected for Cd at all stations except St5 and St6. The lake was considerably contaminated for Hg at stations 1, 2, 3, and 4 while moderate contamination was calculated for the other two stations.
Pollution Load Index
Pollution Load Index values are illustrated in Table6.
PLI values were found to be between 0.44 and 1.47. The mean PLI value was calculated as 1.05. The minimum
PLI was detected at St6 while the maximum was at St2.
According to Suresh et al. (2011), the ideal PLI is 0
(zero), showing no pollution. A finding of 1 point re-flects the baseline level of the sediment. Values above 1 indicate progressive deterioration. Detected values for St1, St2, St3, and St4 in this study slightly exceed 1, indicating that there is a problem at minimal level re-garding the environmental quality of the sediment. Potential Ecological Risk
Potential Ecological Risk values are shown both
indi-vidually and totally in Table7. According to this
anal-ysis, the risk indices of the metals are Hg>Cd>As> Pb>Cu>Ni>Cr>Zn, respectively. PER was calculated as higher for Hg at all stations except St6 where mod-erate risk was detected. PER indices were <40 for all metals except Hg and Cd. These point to a low ecolog-ical risk in the lake. Cd shows low risk at stations 5 and 6, but suggests a moderate risk at stations 1, 2, 3, and 4. PER varied between 103.83 and 255.37 for all metals, and the general average was calculated as 194.31. The lowest and highest values were detected at St6 and St2, respectively. The maximum level resulted from maxi-mum levels of Cu, Ni, Cr, and Hg at St2. Similarly, the lowest PER, at St6, could have resulted from the mini-mum recorded values of the metals, excluding As. Pearson’s correlation analysis
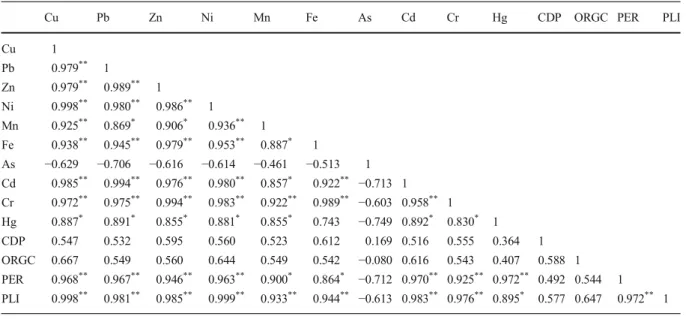
Observed correlation coefficients are presented as a
linear correlation matrix in Table 8. No relationship
was found between any of the metals and As. Although Hg and Fe were not related to each other, there was a strong correlation between all other metals.
According to Wang et al. (2012), correlation between
heavy metals provides clues about their origin and mi-gration. In other words, a high correlation between two metals indicates the same source of pollution and similar transformation and migration processes.
As Suresh et al. (2011) points out, correlation may
indicate mutual dependency in addition to migration and other sources. If no correlation is found between ele-ments, it means that the metals are not controlled by a single factor. In this study, a strong correlation was found between all metals except As and PLI, PER. Thus, elements present in the Lake Çıldır sediments possess the potential to create ecological risk. However, it was confirmed that there was no correlation
Table 5 EF values of measured heavy metals in Lake Çıldır
Station number 1 2 3 4 5 6 Mean
Cu 0.91 0.99 0.89 0.93 0.71 0.37 0.80 Pb 1.31 1.34 1.41 1.39 0.84 0.57 1.14 Zn 1.10 1.15 1.14 1.21 1.06 0.99 1.11 Ni 0.83 0.92 0.83 0.82 0.62 0.36 0.73 Mn 1.58 2.41 1.41 1.37 0.71 0.47 1.33 As 1.54 2.08 1.83 1.97 3.85 3.89 2.53 Cd 2.10 2.11 2.23 2.14 1.11 0.11 1.63 Cr 1.00 1.03 0.99 0.94 0.76 0.70 0.90 Hg 3.26 3.94 3.39 5.02 3.03 2.88 3.58
Table 6 CF and PLI values of calculated heavy metals
Station number 1 2 3 4 5 6 Mean
Cu 0.86 0.97 0.88 0.66 0.47 0.23 0.68 Pb 1.25 1.31 1.39 0.99 0.56 0.35 0.98 Zn 1.05 1.12 1.13 0.87 0.70 0.62 0.91 Ni 0.79 0.90 0.82 0.59 0.41 0.22 0.62 Mn 1.51 2.36 1.39 0.99 0.47 0.30 1.17 Fe 0.95 0.98 0.99 0.72 0.66 0.62 0.82 As 1.47 2.03 1.81 1.41 2.54 2.43 1.95 Cd 2.00 2.07 2.20 1.53 0.73 0.07 1.43 Cr 0.95 1.01 0.97 0.68 0.50 0.44 0.76 Hg 3.10 3.85 3.35 3.60 2.00 1.80 2.95 PLI 1.27 1.47 1.35 1.02 0.73 0.44 1.05
between organic carbon and CDP, which represent bio-logical processes and heavy metals. Although it is well known that importance of organic carbon in determining the fate of heavy metals in sediments because of organic carbon has strong complexing capacity for metallic
contaminants (Bai et al.2011a), there was no correlation
between organic carbon and heavy metals. Cluster analysis
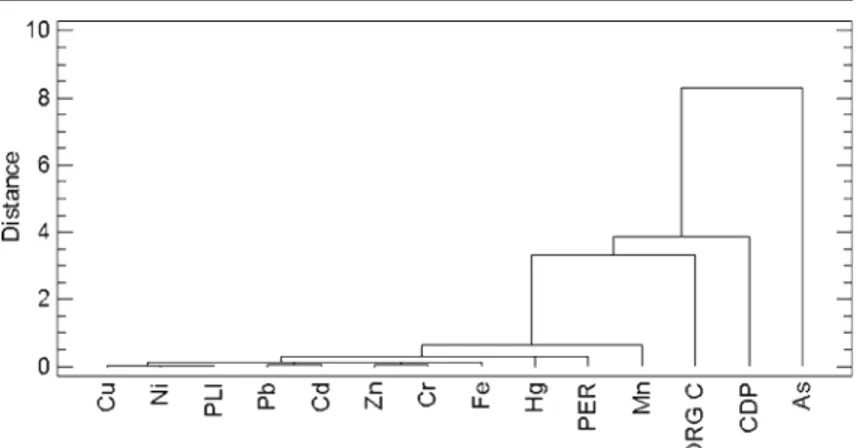
Two cluster analyzes were performed, both for determi-nation of the relationship between variables and for differentiation between stations. Fourteen parameters
were clustered in the first dendogram (Fig.2).
According to the variables analysis shown in Fig.2,
Cu–Ni, Pb–Cd, and Zn–Cr–Fe were clustered, while Mn and Hg were placed far from other clusters. As shows no relationship with other metals, and indepen-dency was observed. Cu, Ni, Pb, and Cd were respon-sible for the PLI, and Hg was responrespon-sible for the PER. No relationship was determined between organic car-bon, CDP, and measured heavy metals. However, it can be said that organic carbon exhibits a close relationship to the heavy metals, apart from CDP. This indicates that algal biomass plays no important role in the absorption and migration of heavy metals in the water column. The relationship between organic carbon and CDP was weak. Overall, these results show that the organic
Table 7 Potential ecological risk (PER) indices for single metal (Eif) and PER for heavy metals
Station number Potential ecological risk indices for single heavy metal (Eif)
Cu Pb Zn Ni As Cd Cr Hg PER 1 4.32 6.25 1.05 3.97 14.69 60.00 1.90 124.00 216.17 2 4.86 6.53 1.12 4.52 20.34 62.00 2.01 154.00 255.37 3 4.41 6.97 1.13 4.08 18.08 66.00 1.95 134.00 236.62 4 3.32 4.97 0.87 2.95 14.12 46.00 1.35 144.00 217.59 5 2.33 2.78 0.70 2.04 25.42 22.00 1.00 80.00 136.28 6 1.16 1.76 0.62 1.12 24.29 2.00 0.88 72.00 103.83 Mean 3.40 4.88 0.91 3.11 19.49 43.00 1.52 118.00 194.31
Table 8 Pearson’s correlation coefficients between variables for all heavy metals
Cu Pb Zn Ni Mn Fe As Cd Cr Hg CDP ORGC PER PLI
Cu 1 Pb 0.979** 1 Zn 0.979** 0.989** 1 Ni 0.998** 0.980** 0.986** 1 Mn 0.925** 0.869* 0.906* 0.936** 1 Fe 0.938** 0.945** 0.979** 0.953** 0.887* 1 As −0.629 −0.706 −0.616 −0.614 −0.461 −0.513 1 Cd 0.985** 0.994** 0.976** 0.980** 0.857* 0.922** −0.713 1 Cr 0.972** 0.975** 0.994** 0.983** 0.922** 0.989** −0.603 0.958** 1 Hg 0.887* 0.891* 0.855* 0.881* 0.855* 0.743 −0.749 0.892* 0.830* 1 CDP 0.547 0.532 0.595 0.560 0.523 0.612 0.169 0.516 0.555 0.364 1 ORGC 0.667 0.549 0.560 0.644 0.549 0.542 −0.080 0.616 0.543 0.407 0.588 1 PER 0.968** 0.967** 0.946** 0.963** 0.900* 0.864* −0.712 0.970** 0.925** 0.972** 0.492 0.544 1 PLI 0.998** 0.981** 0.985** 0.999** 0.933** 0.944** −0.613 0.983** 0.976** 0.895* 0.577 0.647 0.972** 1 **
Correlation is significant at the 0.01 level *
Correlation is significant at the 0.05 level
3854 Environ Monit Assess (2014) 186:3847–3857
carbon mostly originated from anthropogenic and/or terrestrial effects, not from algal blooms.
St2 was separate from other stations according to
cluster analysis (Fig.3). This result was caused by the
high values of PER and PLI, and this station shows strongest ecological risk. The lowest PLI and PER were observed at St5 and St6, which exhibited weak ecological risk. St1, St3, and St4 were clustered between themselves.
Principal component analysis
The purpose of PCA was to obtain a small number of linear combinations for the 11 variables that account for most of the variability in the data. In this case, two components were extracted, since these two compo-nents had eigenvalues greater than or equal to 1.0. Together they account for 92.64 % of variability in the original data. The first component, including Cu, Pb, Zn, Ni, Mn, Fe, Cd, Cr, Hg, PER, and PLI, accounted for 82.17 % of total variability. The migration and sources of the mentioned metals could be the same,
and they were important for PER and PLI. The 10.48 % of total variability was related to As, CDP, and organic carbon. This component reveals the relocation of As through organic carbon.
Conclusions
The heavy metal content (Cu, Pb, Zn, Ni, Mn, Fe, As, Cd, Cr, Hg) of sediment samples collected from the northern littoral zone of Lake Çıldır was studied. The measurements carried out to determine contamination level and quality of the samples indicated the existence of contamination of Hg, As, Cd, and Mn at moderate levels. Given the presence of heavy metal contamina-tion, PLI and PER values were found to be above the limit of threshold values. Results of statistical analysis revealed that the Cu, Pb, Zn, Ni, Mn, Fe, Cd, Cr, and Hg had similar sources and mutual processes of deposition, in contrast to As, which might have been transported by organic agents. With regard to the potential of pollution, Station 2, with a greater risk, is statistically different Fig. 2 Dendogram of all
variables
Fig. 3 Dendogram of CA for all stations
from the other stations studied. Stations 5 and 6 are, however, of the least significance in respect of ecological risk.
Albeit the absence of urbanization and industry in the studied area, our results revealed the presence of anthro-pogenically induced heavy metal contamination in sur-face sediments of Lake Çıldır due to the utilization of fossil fuels and agricultural activities. It is very likely that there is a potential risk for the ecosystem of Lake Çıldır in next future.
Acknowledgments We would like to warmly thank Drs. Hürriyet
Çimen and A. Evren Erginal for field work assistance. Graham Lee is thanked for proof reading the earlier version of the text. We thank two anonymous reviewers for their helpful comments and suggestions for improving the manuscript. This study was sup-ported financially by the Research Foundation of Ardahan Uni-versity (project number: 02/2012) and the Scientific and
Tech-nological Research Council of Turkey (TÜBİTAK; contract
number: 113Y205), for which we are thankful.
References
Atalay, İ. (1978). Geomorphology of Çıldır Lake and around.
Journal of Geomorphology, 7, 23–34.
Bai, J., Huang, L., Yan, D., Wang, Q., Gao, H., Xiao, R., et al. (2011a). Contamination characteristics of heavy metals in wetland soils along a tidal ditch of the Yellow River Estuary, China. Stochastic Environmental Research and
Risk Assessment, 25, 671–676.
Bai, J., Cui, B., Chen, B., Zhang, K., Deng, W., Gao, H., et al. (2011b). Spatial distribution and ecological risk assessment of heavy metals in surface sediments from a typical plateau
lake wetland, China. Ecological Modelling, 222, 301–306.
Bai, J., Xiao, R., Cui, B., Zhang, K., Wang, Q., Liu, X., et al. (2011c). Assessment of heavy metal pollution in wetland soils from the young and old reclaimed regions in the Pearl River Estuary, South China. Environmental Pollution, 159,
817–824.
Bai, J., Xiao, R., Zhang, K., & Gao, H. (2012). Arsenic and heavy metal pollution in wetland soils from tidal freshwater and salt marshes before and after the flow-sediment regulation regime
in the Yellow River Delta, China. Journal of Hydrology, 450–
451, 244–253.
Barlas, N., Akbulut, N., & Aydoğan, M. (2005). Assessment of heavy
metal residues in the sediment and water samples of Uluabat Lake, Turkey. Bulletin of Environmental Contamination and
Toxicology, 74, 286–293.
Duman, F., Aksoy, A., & Demirezen, D. (2007). Seasonal vari-ability of heavy metals in surface sediment of Lake Sapanca, Turkey. Environmental Monitoring and Assessment, 133,
277–283.
Esen, E., Küçüksezgin, F., & Uluturhan, E. (2010). Assessment of trace metal pollution in surface sediments of Nemrut Bay,
Aegean Sea. Environmental Monitoring and Assessment, 160, 257–266.
Gaudette, H. E., Flight, W. R., Toner, L., & Folger, W. (1974). An inexpensive titration method for the determination of organic carbon in recent sediments. Journal of Sedimentary
Petrology, 44, 249–253.
Gue, W., Liu, X., Liu, Z., & Li, G. (2010). Pollution and potential ecological risk evaluation of heavy metals in the sediments around Dongjiang Harbor, Ttianjin. Procedia Environmental
Sciences, 2, 729–736.
Hakanson, L. (1980). Ecological risk index for aquatic pollution control, a sedimentological approach. Water Research, 14,
975–1001.
Jain, C. K., Gupta, H., & Chakrapani, G. J. (2008). Enrichment and fractionation of heavy metals in bed sediments of river Narmada, India. Environmental Monitoring and Assessment,
141, 35–47.
Kahkönen, M. A., Kallio, M. P., & Mannien, P. K. P. (1997). Analysing heavy metal concentrations in the different parts of Elodea canadensis and surface sediment with PCA in two boreal lakes in Southern Finland. Chemosphere, 35(11),
2645–2656.
Kankılıç, G. B., Tüzün, İ., & Kadıoğlu, Y. K. (2013). Assessment
of heavy metal levels in sediment samples of Kapulukaya Dam Lake (Kirikkale) and lower catchment area.
Environmental Monitoring and Assessment. doi:10.1007/
s10661-013-3061-2.
Kannan, S. K., Batvari, B. P. D., Lee, K. L., Kannan, N., Krishnamoorthy, R., & Jayaprakash, M. (2008). Assessment of heavy metals (Cd, Cr and Pb) in water, sediment and seaweed (Ulva lactuca) in the Pulicat Lake, South East India.
Chemosphere, 71, 1233–1240.
Köleli, N., & Kantar, Ç. (2005). Toxic heavy metal (Cd, Pb, Ni and As) concentration in phosphate rock, phosphoric acid and phosphorous fertilizers (In Turkish). Ecology,
14(55), 1–5.
Kükrer, S. (2013). Assessment of heavy metal (Zn, Pb, Fe) con-tamination in surface sediments of creeks flowing to inner part of Izmir Bay (Eastern Aegean Sea). Journal of Black Sea
and Mediterranean Environment, 19(1), 82–94.
Lorenzen, C. J. (1971). Chlorophyll-degradation products in sed-iments of Black Sea. Woods Hole Oceanographic Institution
Contribution, 28, 426–428.
MacDonald, D. D. (1994). Approach to the assessment of
sedi-ment quality in Florida coastal waters. Volume 1
—develop-ment and evaluation of sedi—develop-ment quality assess—develop-ment guide-lines. Florida Department of Environmental Protection Office
of Water Policy. Retrieved fromhttp://www.floridadep.org/
waste/quick_topics/publications/documents/sediment/
volume1.pdf.
Meyers, P. A., & Teranes, J. L. (2001). Sediment organic matter. In W. M. Last & J. P. Smol (Eds.), Tracking environmental
change using lake sediments (Vol. 2, pp. 239–269).
Dordrecht: Kluwer Academic Publishers.
Mico, C., Recatala, L., Peris, M., & Sanchez, J. (2006). Assessing heavy metal sources in agricultural soils of an European Mediterranean area by multivariate analysis. Chemosphere,
65, 863–872.
Nriago, J. O., & Pacyna, J. M. (1988). Quantitative assessment of worldwide contamination of air, water and soils by trace
metals. Nature, 333, 134–140.
3856 Environ Monit Assess (2014) 186:3847–3857
Özmen, H., Külahçı, F., Çukurovalı, A., & Doğru, M. (2004). Concentrations of heavy metal and radioactivity in surface
water and sediment of Hazar Lake (Elazığ, Turkey).
Chemosphere, 55, 401–408.
Rosales-Hoz, L., Carranza-Edwards, A., & Lopez-Hemandez, M. (2000). Heavy metals in sediments of a large, turbid tropical lake affected by anthropogenic discharges. Environmental
Geology, 39(3–4), 378–383.
Sönmez,İ., Kaplan, M., & Sönmez, S. (2008). Effect of chemical
fertilizers on environmental pollution and its prevention
methods (In Turkish). Journal of Batı Akdeniz Agricultural
Research Institute, 25(2), 24–34.
Suresh, G., Ramasamy, V., Meenakshisundaram, V., Venkatachalapathy, R., & Ponnu- samy, V. (2011). Influence of mineralogical and heavy metal composition on natural radionuclide contents in the river sediments. Applied
Radiation and Isotopes, 69, 1466–1474.
Suresh, G., Sutharsan, P., Ramasamy, V., & Venkatachalapathy, R. (2012). Assessment of spatial distribution and potential eco-logical risk of the heavy metals in relation to granulometric contents of Veeranam lake sediments, India. Ecotoxicology
and Environmental Safety, 84, 117–124.
Sutherland, R. A. (2000). Bed sediment associated trace metals in an urban stream, Oahu. Hawaii. Environmental Geology, 39,
611–627.
Tekin-Özan, S. (2008). Determination of heavy metal levels in water, sediment and tissues of tench (Tinca tinca L., 1758)
from Beyşehir Lake (Turkey). Environmental Monitoring
and Assessment, 145, 295–302.
Turcg, B., Albuquergue, A. L. S., Cordeiro, R. C., Sifeddine, A., Simoes Filho, F. F. L., Souza, A. G., et al. (2002). Accumulation of organic carbon in five Brazilian lakes
dur-ing the Holocene. Sedimentary Geology, 148, 319–342.
Wang, Y., Hu, J., Xiong, K., Huang, X., & Duan, S. (2012). Distribution of heavy metals in core sediments from Baihua
Lake. Procedia Environmental Sciences, 16, 51–58.
Yang, Z., Wang, Y., Shen, Z., Niu, J., & Tang, Z. (2009). Distribution and speciation of heavy metals in sediments from the mainstream, tributaries, and lakes of the Yangtze River catchment of Wuhan, China. Journal of Hazardous
Materials, 166, 1186–1194.
Zhang, L., Ye, X., Feng, H., Jing, Y., Ouyang, T., Yu, X., et al. (2007). Heavy metal contamination in western Xiamen Bay sediments
and its vicinity, China. Marine Pollution Bulletin, 54, 974–982.
Environ Monit Assess (2014) 186:3847–3857 3857
View publication stats View publication stats