INTRODUCTION
Although the postpartum period stands as an exciting and joyous period for mothers, it is nonetheless a risky period characterized by intense physical and emotional changes that can potentially lead to psychiatric disorders (1). The mental changes that emerge in the early postpartum period are more complex than the mental status of women in other periods of their lifetime (2). Postpartum psychiatric disorders are arranged under three categories: postpartum blues (PB), postpartum depression (PPD), and
postpartum psychosis (PP). Among these, the PB is the most frequently observed psychiatric disorder. The PB is a group of symptoms of emotionalism and over-reactivity, with negative and positive mood changes mothers, experience on a daily basis within the first week to 10 days after delivery (2-6).
Although it is mild and temporary in nature, studies have shown that PB progress to PPD in one out of five cases (7,8) or rarely to PP (9). Consequently, it could have serious negative effects on the health of both the mother and the child (10). PB has an incidence ranging between 4.0% and 85.0% (11,12), and peaks particularly on the postpartum 3rd and 5th days (2,3,5,13). Its prevalence is higher in the USA and Europe, where postpartum rituals are less common (11,14,15), in contrast to Japan, where its prevalence is lower, and there is strong traditional family support (16). PB affects 50.0% to 85.0% of women in Turkey (17,18).
ORIGINAL ARTICLE
Reliability and Validity of the Turkish Version of the
Daily Experiences Questionnaire (Turkish DEQ)
Nevin Akdolun Balkaya1 , Murat Bektas2 , Asli Cayan3
1Mugla Sitki Kocman University, Faculty of Health Sciences, Department of Obstetrics and Gynecology Nursing, Mugla, Turkey 2Dokuz Eylul University, Faculty of Nursing, Department of Pediatric Nursing, İzmir, Turkey
3Adnan Menderes University, Nazilli Vocational Health Sciences, Nazilli, Aydin, Turkey
ABSTRACT
Objective: The aim of this study was to test the validity and reliability of the Daily Experiences Questionnaire (DEQ) to evaluate women’s experience of postpartum blues.
Methods: The study sample consisted of 238 mothers. The data were collected using an Introductory Information Form (IIF), the DEQ and the Edinburgh Postnatal Depression Scale (EPDS), which were completed by the mothers through self-reports on the postpartum first, fifth and tenth days and through a question and answer session over the phone on the third day. Data were evaluated with content validity index, Pearson's correlation analysis, Cronbach's Alpha coefficient, Exploratory and confirmatory factor analysis and t-test. The EPDS was used as a criterion to determine the cutoff point of the scale.
Results: The content validity index was found to be between 0.86 and 0.99 for the items and 0.93 for the entire scale. The exploratory factor analysis showed the factor loads to be between 0.34 and 0.72 for the negative affect (NA) subscale and between 0.39 and 0.71 for the positive affect (PA) subscale. The scale explains 35.5% of the total variance. The Cronbach's alpha value was between 0.85 and 0.88 for the entire scale, according to days, and between 0.91 and 0.94 for the NA subscale, and between 0.81 and .86 for the PA subscale. The confirmatory factor analysis showed that GFI= 0.76, CFI= 0.92, IFI= 0.92, and RMSEA= 0.068. Conclusion: The DEQ is a valid and reliable measurement tool, which can be used to assess postpartum blues in Turkish samples.
Keywords: Postpartum blues, Daily Experiences Questionnaire, reliability and validity
Corresponding author: Nevin Akdolun Balkaya,
Mugla Sitki Kocman University, Faculty of Health Sciences, Department of Obstetrics and Gynecology Nursing, Kotekli-Mugla, Turkey
E-mail: [email protected]
Received: December 29, 2017 Accepted: April 03, 2018
Citation: Akdolun-Balkaya N, Bektas M, Cayan A. Reliability and validity of the Turkish version of the Daily Experiences Questionnaire (Turkish DEQ). Psychiatry and Behavioral Sciences 2018;8(1):7-17.
To date, there is no assessment tool that serves as the golden standard for clinical presentation and diagnosis of PB. Instead, for a long time, PB has been assessed using a variety of measurement tools (2,3,13,19,20). These self-administered questionnaires are including a rationale rather than a factor analytic approach (e.g., Pitt’s Questionnaire, Stein Maternity Blues Scale-MBS) (3,13,19). Previous studies have also relied primarily on structural analytic approaches (2,20) yielding one-factor solutions (21), including principal components (20) and cluster analytic techniques (2). Indeed, PB has been assessed first by Kennerly and Gath (2) systematically by using the Kennerley Blues Questionnaire (KBQ) within the first ten days postpartum. KBQ is more specific for maternity blues and distinguishes the PB as “primary blues” and “hypersensitivity” or “blues 1” and “blues 2” according to severity. However, small sample sizes and retrospective mood ratings, lack of reliability indices and replication data and failure to address the full range of women’s affective symptoms of the PB were pointed out as methodical issues of their major limitations of all these previous studies (2,3,13,19,20,22).
Recently, Buttner et al. (5) developed and validated the Daily Experiences Questionnaire (DEQ) by modification and expansion of the KBQ (2). The DEQ included additional items from the Positive Affect (PA) and Negative Affect (NA) Schedule (PANAS). These authors also used exploratory factor analysis (EFA) to examine the underlying symptom structure of the blues, resulting in two-factor solution identified as Negative Affect (NA) and Positive Affect (PA). Consequently, different from previous scales (3,13,19-21), the DEQ measures also the positive mood fluctuations adequately. This is very important because of these two dimensions are fundamental for depressive disorders and strongly related to anxious situations (23,24). Recent studies gave strong evidence that a decrease in PA (loss of interest or anhedonia) with an increase in NA (depressed mood, insomnia, and poor concentration) at any point during the ten days postpartum would be a strong indication for PPD development (6,25). Also, reliability indices of the DEQ were sufficient enough, with a high level of agreement in factor structure over time (5). In sum, this
two-factor model is brief and suitable for daily administration, has strong psychometric properties and assess woman’s mood status as a comprehensive and reliable measure in the early postpartum.
In Turkey, the Ministry of Health aims to improve postpartum mental health care and increase the quality of postpartum care. For this reason, a PPD screening using the Edinburgh Postnatal Depression Scale (EPDS) (26) is recommended between the postpartum 6th and 24th hours. Currently, there is no scale available to identify PB. However, assessing emotions that are reflective of NA and PA, rather than depressive symptoms immediately after delivery may be particularly relevant and also easily acceptable to postpartum women (25). By using an appropriate assessment tool, healthcare personnel can evaluate mothers at hospital and/or home and diagnose PB at an early stage, provide required psychosocial support and care, make interventions to prevent the development of depression and psychosis, and refer the mothers at risk to professional psychological assistance and support. It is of paramount importance that a PB screening is performed during the early postpartum considering the low rate at which postpartum care is received and the low quality of postpartum care, the provision of care and support by non-professionals, such as family members and relatives. While the absence of clinical characterization and diagnostic criteria for PB limits the interpretation of results that approach its epidemiological aspects, PB’s high prevalence and cultural differences reinforces the need for research in every culture. This study aimed to test the validity and reliability of the Turkish version of the DEQ, which was developed by Buttner and colleagues (5), to have available an objective assessment tool for measuring maternity blues. Our study hypothesis was that the DEQ was a valid and reliable measurement tool for assessing postpartum blues in a Turkish sample.
METHODS
Study Design
A methodological research design was used to evaluate the validity and reliability of Turkish version of the DEQ in the early postpartum period.
Setting and Sample
The study was conducted at Aydın Maternity and Children Hospital with mothers who either had given spontaneous vaginal birth or had had a cesarean section. The standard method used for determining the sample size in validity and reliability studies is to include 5 to 10 people for each item (27,28). Since the DEQ has 38 items, the sample size was determined to be between 190 to 380 participants. Based on the delivery rates for 2013 at Aydın Maternity and Children Hospital (vaginal birth: 69.9% and cesarean section: 30.1%), a total of 238 mothers (vaginal birth: 157 and cesarean section: 81) were included in the study. Since the number of cesareans and vaginal delivering mothers was not equal, it was unlikely that the mothers from the universe would be selected with a certain probability and equal chance. For this reason, the convenience sampling method was used (29,30), and the study is continued until reaching the desired numbers of mothers. A total of 587 women were eligible. However, 321 women rejected to attend the study because of her husband or family did not want this, and 28 women were not available due to early hospital discharges.
To participate in the study, the mothers had to meet the following inclusion criteria: be between the ages of 15 and 49; be at least a primary school graduate; and be a Turkish speaker; have no chronic diseases (e.g., cardiovascular disease, diabetes, hypertension, liver disease or psychiatric disease); experienced no complications during pregnancy, delivery and postpartum period; gave birth in term (38 to 42 weeks) to an alive, single and healthy infant, who was at normal weight (2,500 to 4,000 gr); and were not separated from their infant after delivery. Mothers who did not meet all of these criteria were excluded.
Ethical Considerations
This study was approved by the Institutional Review Board (IRB) of the Muğla Sıtkı Koçman University (Approval no: 56989545/050-19). Also, verbal and written informed consents were obtained from the mothers who volunteered to participate in the study. On the tenth day, all mothers were informed about PB, and their questions were answered to avoid any ethical problems from arising.
Psychometric Measures
The data were collected using an Introductory Information Form (IIF), the DEQ (5) and the EPDS (26).
Introductory Information Form (IIF): The IIF was
prepared by the researchers based on the literature. It includes questions on the mothers' sociodemographic (e.g., age, education), pregnancy (e.g., regular prenatal control, type of delivery) and postpartum (e.g., initiation of breastfeeding, getting professional support) characteristics, including their medical history. IIF was used to assess sociodemographic, medical and obstetric characteristics of the women to determine their eligibility to include in the study sample.
Daily Experiences Questionnaire (DEQ): The DEQ
was adapted by Buttner and colleagues to assess postpartum blues and contains 38 items (5). The DEQ is a more comprehensive measure of the blues for daily administration in early postpartum. The scale measures two specific factors; PA and NA. Items are scored on a 1–5 Likert scale ranging from 1 (very slightly or not at all) to 5 (extremely), reflecting a woman's mood on that particular day. The scale has no cut-off point. The total score obtained on the scale is divided by the number of items and then interpreted. Higher scores are associated with an increased risk of postpartum blues. The DEQ reliability indices have been reported to be high for PA (α=0.88−0.92) and NA (α=0.91−0.94) (5).
Edinburg Postpartum Depression Scale (EPDS): The
EPDS is a self-assessment scale, originally developed by Cox and colleagues to assess the depression risk for women in the postpartum period in England (31). The scale has a Cronbach’s Alpha coefficient of 0.87, a sensitivity of 0.85 when the cut-off score is taken as 12/13, a specificity of 0.77, a positive predictive value of 0.83, and a negative predictive value of 0.78. This scale is used to assess the risk of PPD. It was tested for validity and reliability in Turkey by Engindeniz and colleagues, who found its internal consistency coefficient to be 0.79, sensitivity to be 0.84 when the cut-off score was taken as
12/13, specificity to be 0.88, positive predictive value to be 0.69, and negative predictive value to be 0.94 (26). The scale includes ten questions, on which one of four choices are selected to identify how each mother was feeling during the previous week. After each item is scored between 0 and 3, the total score is calculated. While items 3, 5, 6, 7, 8, 9 and 10 show a decreasing the severity and are scored in the order of 3, 2, 1, and 0; items 1, 2 and 4 are scored in the order of 0, 1, 2, and 3. The sum of the item scores yields the total score of the scale. The minimum and maximum total scores of the scale are 0 and 30, respectively, and those who score 12 and higher are considered to be at PPD risk (27). Cronbach alpha value found to be 0.80 in this study.
Study Process
Written permission was obtained from Buttner and colleagues (5) to adapt the scale into Turkish and to use it. The scale was translated into Turkish by three separate linguists, after which the Turkish version was rearranged by the researchers and checked again by a Turkish linguist. Finally, the Turkish scale was back-translated into English by a different linguist. It is recommended that opinions should be taken from a minimum of three experts to determine that the items in the translated scale are equivalent to those in the original scale (28,32). In this study, opinions were taken from eight professors (three from Maternity and Women's Health Center, three from Psychiatry, and two from Pediatrics) and a specialist psychologist. The experts were given both the original and the translated scale and asked to assess the appropriateness of the items by scoring them between 0 and 10 (0=not appropriate at all, 10=completely appropriate). It is standard procedure that following the first translation process, the scale be administered to a group of 10 to 20 people who have similar characteristics to those who will constitute the study sample, but who will not be included in the sample (28,32). The draft scale prepared after taking the opinions of experts was administered to ten women with similar characteristics to the study sample, and following the women’s completion of the scale, the required revisions were made.
Data Collection
The symptoms of PB initiate within 24 hours following birth (2,11,13). Each symptom peaks on a different time point and their pattern may differ from country to country (3-5,11,13,19,25). However, frequently they make a peak between three and five days postpartum (5,6,11,25), and decrease on day 7 and disappear on the tenth day after delivery (2,5,6,22). Therefore, the data were collected by the researchers between the postpartum first, third, fifth, and tenth days between February 1, 2014 and December 31, 2015. The IIF, DEQ, and EPDS were used during the interviews on the first day, and the DEQ and EPDS were used on the other days. The data were based on the self-reports of the women, which were obtained after at least 12 hours following the delivery on the postpartum first day through interviews and between 3:00 p.m. and 8:00 p.m. on the fifth and tenth postpartum days through home visits. On the third postpartum day, the women were interviewed through the question and answer method via phone calls between 3:00 p.m. and 8:00 p.m. This approach to data collection represents standard protocol in the mood literature (5,23). Although it is possible that assessing mood at a different time of the day may yield different results, it is accepted that the selected time points and/or intervals provide an overall representation of women’s mood over the entire day when responding to each of the items on the questionnaire (5).
Statistical Analysis
All statistical analyses were performed using SPSS for Windows, Version 23.0 (IBM Corp., Armonk, N.Y., USA). Data analyses were carried out using descriptive statistics. Among the methods applied were Content Validity Index (CVI) for consistency analysis of experts' opinions, Pearson's correlation analysis for total item score analysis of the scale and its subscales, Cronbach's Alpha coefficient for internal consistency of the scale and subscales, EFA to determine the item-factor relationship, confirmatory factor analysis (CFA) to determine whether the items and subscales explain the original structure of the scale, and t-test for known group comparison (28,32).
It was accepted that the Model Fit indices for CFA, Goodness of Fit Index (GFI), Comparative Fit Index (CFI), Incremental Fit Index (IFI), and Normed Fit Index (NFI) are greater than 0.90 and the Root Mean Square Error of Approximation (RMSEA) is less than 0.080. The EPDS was used as a criterion to determine the cutoff point of the scale (26). The level of significance is considered to be p<0.05.
RESULTS
Sociodemographic Characteristics of Sample
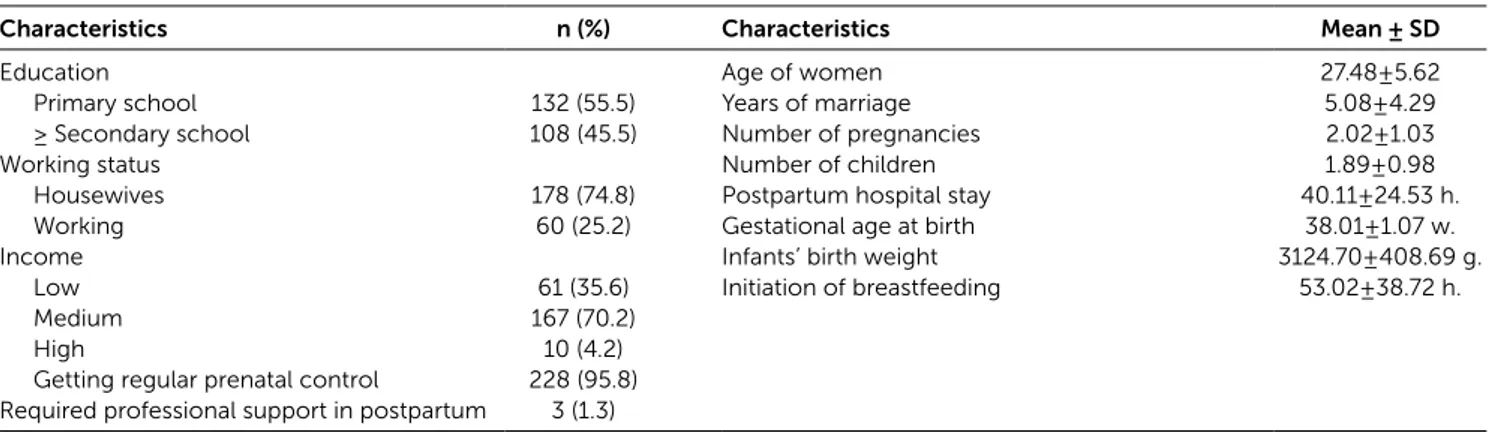
Sociodemographic characteristics of the participants are summarized in Table 1. The average age of the women was 27.48±5.62, and 55.5% had an education level of primary school. Regular prenatal care had been received by 95.8% of the women during their pregnancies. The average time of postpartum hospitalization was 40.11±24.53 hours. Regarding postpartum mental status, only three mothers (1.3%) reported that they had needed assistance from the 2nd to 7th days but could not receive any professional support.
Validity
In this study, according to experts’ opinion, the item level CVI (I-CVI) was found to be between 0.86 and 0.99, while the scale level CVI (S-CVI) was found to be 0.93. The Kaiser-Meyer-Olkin (KMO) value was 0.858, Barlett's test was χ2=3610.44, and p-value was p<0.001.
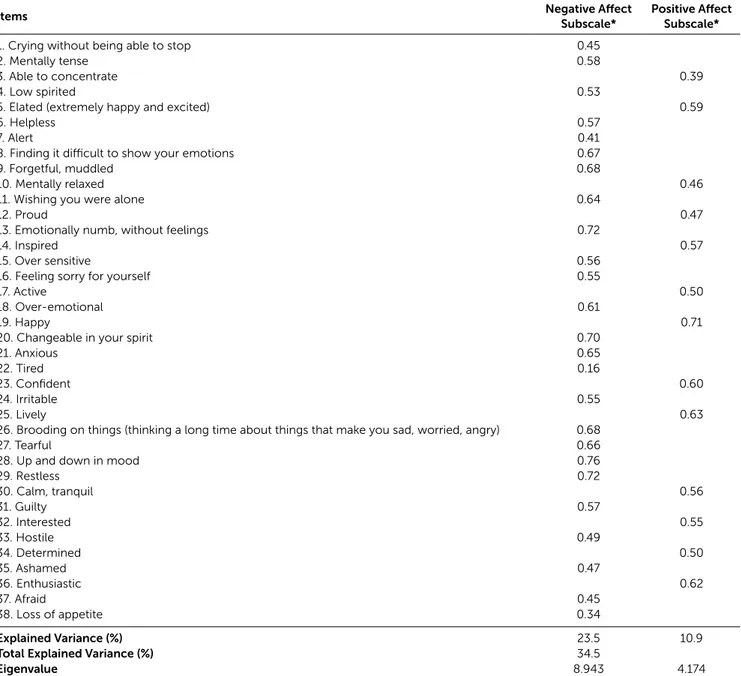
In the results of EFA, the scale is composed of two subscales. The two subscales explain 34.5% of the total variance, with the first subscale explaining 23.5% and the second subscale explaining 10.9% of the total variance.
Table 1: Sociodemographic Characteristics of Participants
Characteristics n (%) Characteristics Mean ± SD
Education Age of women 27.48±5.62
Primary school 132 (55.5) Years of marriage 5.08±4.29
≥ Secondary school 108 (45.5) Number of pregnancies 2.02±1.03
Working status Number of children 1.89±0.98
Housewives 178 (74.8) Postpartum hospital stay 40.11±24.53 h.
Working 60 (25.2) Gestational age at birth 38.01±1.07 w.
Income Infants’ birth weight 3124.70±408.69 g.
Low 61 (35.6) Initiation of breastfeeding 53.02±38.72 h.
Medium 167 (70.2)
High 10 (4.2)
Getting regular prenatal control 228 (95.8) Required professional support in postpartum 3 (1.3)
VAR00001 0.83 VAR00002 0.69 VAR00003 0.88 VAR00004 0.72 VAR00005 0.62 VAR00006 0.69 VAR00007 0.87 VAR00008 0.58 VAR00009 0.55 VAR00010 0.81 VAR00011 0.62 VAR00012 0.83 VAR00013 0.48 VAR00014 0.73 VAR00015 0.75 VAR00016 0.73 VAR00017 0.88 VAR00018 0.69 VAR00019 0.51 VAR00020 0.52 VAR00021 0.60 VAR00022 0.97 VAR00023 0.70 VAR00024 0.72 VAR00025 0.73 VAR00026 0.57 VAR00027 0.58 VAR00028 0.41 VAR00029 0.51 VAR00030 0.75 VAR00031 0.70 VAR00032 0.77 VAR00033 0.79 VAR00034 0.78 VAR00035 0.82 VAR00036 0.69 VAR00037 0.81 VAR00038 0.90 NA 1.00 PA 1.00
Chi-Square=1390.26, df=660, P-value=0.00000, RMSEA=0.068
0.42 0.56 0.35 0.53 0.61 0.55 0.36 0.65 0.67 0.43 0.62 0.41 0.72 0.52 0.50 0.52 0.35 0.56 0.70 0.69 0.63 0.16 0.55 0.53 0.52 0.66 0.65 0.77 0.70 0.50 0.55 0.48 0.46 0.47 0.43 0.56 0.43 0.32 -0.19 0.23 0.30 -0.20 0.35
The factor loads were between 0.16 and 0.72 for the first subscale and between 0.39 and 0.71 for the second subscale (Table 2).
In the results of confirmatory factor analysis (CFA), the factor loads were shown to be between 0.16 and 0.77 for the NA subscale and between 0.35 and 0.70 in the PA subscale (Figure 1). Model fit indicators were GFI=0.76, CFI=0.92, IFI=0.92, NFI=0.86, Relative Fit Index (RFI)=0.85
and χ2=1390.26, df=660, p<0.001 and RMSEA=0.068. The division of the chi-square value by degrees of freedom yielded a value of 2.10. In both the EFA and the CFA, only the factor load of the ‘tired’ was lower than 0.30.
Reliability
On the postpartum first, third, fifth,, and tenth days, the Cronbach's alpha values were between 0.85 and 0.88 for
Table 2: Exploratory Factor Analysis Results
Items Negative AffectSubscale* Positive AffectSubscale*
1. Crying without being able to stop 0.45
2. Mentally tense 0.58
3. Able to concentrate 0.39
4. Low spirited 0.53
5. Elated (extremely happy and excited) 0.59
6. Helpless 0.57
7. Alert 0.41
8. Finding it difficult to show your emotions 0.67
9. Forgetful, muddled 0.68
10. Mentally relaxed 0.46
11. Wishing you were alone 0.64
12. Proud 0.47
13. Emotionally numb, without feelings 0.72
14. Inspired 0.57
15. Over sensitive 0.56
16. Feeling sorry for yourself 0.55
17. Active 0.50
18. Over-emotional 0.61
19. Happy 0.71
20. Changeable in your spirit 0.70
21. Anxious 0.65
22. Tired 0.16
23. Confident 0.60
24. Irritable 0.55
25. Lively 0.63
26. Brooding on things (thinking a long time about things that make you sad, worried, angry) 0.68
27. Tearful 0.66
28. Up and down in mood 0.76
29. Restless 0.72 30. Calm, tranquil 0.56 31. Guilty 0.57 32. Interested 0.55 33. Hostile 0.49 34. Determined 0.50 35. Ashamed 0.47 36. Enthusiastic 0.62 37. Afraid 0.45 38. Loss of appetite 0.34 Explained Variance (%) 23.5 10.9
Total Explained Variance (%) 34.5
Eigenvalue 8.943 4.174
the entire scale, between 0.91 and 0.94 for the NA subscale, and between 0.81 and 0.86 for the PA subscale. The floor and ceiling effects were lower than 15.0% (Table 3). The item subscale total score correlations ranged between 0.25 and 0.75 for the NA subscale and between 0.43 and 0.68 for the PA subscale (p<0.001). While the mean score on the NA subscale was 61.06±9.03 for the upper group of 27.0% of the study sample, it was 27.13±2.16 for the lower group of 27.0% of the study sample (t=29.42, p<0.050). On the PA subscale, the mean score was 51.01±3.82 for the upper group of 27.0% of the study sample, while it was 33.76±3.37 for the lower group of 27.0% (t=27.24, p<0.050).
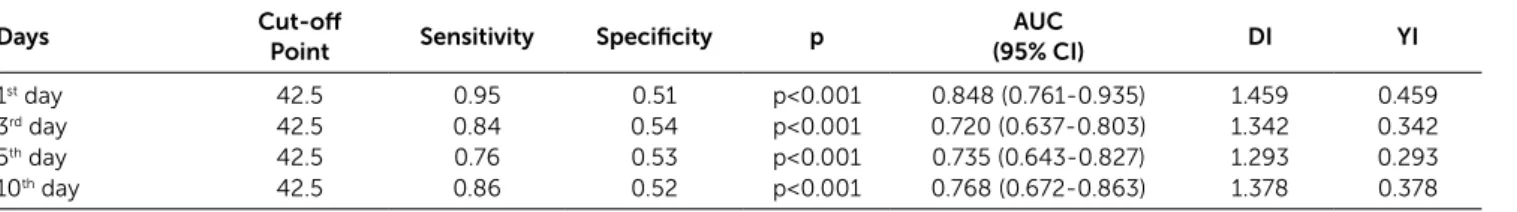
The cut-off point for the NA subscale was determined to be 42.5 and had a sensitivity of between 0.76 and 0.95, and a specificity of between 0.51 and 0.54 on all days (Table 4). The cut-off point for the PA subscale was determined
to be 38.5, with a sensitivity of between 0.72 and 0.78, and a specificity of between 0.38 and 0.68 on all days (Table 5).
DISCUSSION
This study tested the validity and reliability of Turkish version of the DEQ to have an available objective assessment tool of PB. The I-CVI and S-CVI were found to be higher than 0.80 in this study, the results of which exceed the standard expectations specified in the literature, which emphasizes that there should be a minimum consistency of 0.80 among the experts (28,33). The findings from the study indicated that the scale items are appropriate for Turkish culture, that they represent the area intended to be assessed, and that they provide content validity.
A KMO coefficient of 0.80 or higher indicates that the study sample size is sufficient to ensure correlation
Table 3: Reliability of the Total and Subscale Scores
Days n Total α NA α PA α NA M ± SD PA M ± SD NA Floor Effect % NA Ceiling Effect % PA Floor Effect % PA Ceiling Effect % 1st day 238 0.85 0.91 0.81 45.34±14.19 42.20±7.10 0.8 0.0 0.0 0.4 3rd day 238 0.85 0.92 0.83 46.58±14.02 41.91±6.59 0.8 0.0 0.0 0.5 5th day 238 0.88 0.94 0.86 46.05±15.37 42.21±6.85 2.3 0.0 0.0 0.0 10th day 238 0.87 0.94 0.86 45.61±14.55 41.92±6.71 1.7 0.0 0.0 0.0
NA=Negative affect, PA= Positive affect
Table 4: ROC Analysis Results for the Negative Affect Subscale
Days Cut-offPoint Sensitivity Specificity p (95% CI)AUC DI YI 1st day 42.5 0.95 0.51 p<0.001 0.848 (0.761-0.935) 1.459 0.459 3rd day 42.5 0.84 0.54 p<0.001 0.720 (0.637-0.803) 1.342 0.342 5th day 42.5 0.76 0.53 p<0.001 0.735 (0.643-0.827) 1.293 0.293 10th day 42.5 0.86 0.52 p<0.001 0.768 (0.672-0.863) 1.378 0.378
AUC= Area under curve, DI= Diagnostic index, YI= Youden index, CI=Confidence interval
Table 5: ROC Analysis Results for the Positive Affect Subscale
Days Cut-offPoint Sensitivity Specificity p (95% CI)AUC DI YI 1st day 38.5 0.78 0.55 p<0.001 0.707 (0.631-0.783) 1.328 0.328 3rd day 38.5 0.72 0.68 p<0.001 0.738 (0.657-0.819) 1.397 0.397 5th day 38.5 0.77 0.48 0.006 0.658 (0.550-0.914) 1.248 0.248 10th day 38.5 0.76 0.38 0.070 0.613 (0.492-0.733) 1.132 0.132
reliability (28,34). In this study, the KMO and Barlett's test values indicated that the sample size and data structure were appropriate for factor analysis.
In this study, the first subscale explained 23.5% and the second subscale explained 10.9% of the total variance. The total rate of explained variance was 34.5%. An explained variance between 40.0% and 60.0% in social sciences is considered to be sufficient for factor analysis (35). This study results showed that the obtained variance rate was at the threshold. The results of the analysis showed that the scale had acceptable construct validity. The comparison could not be made since Buttner and colleagues (5) did not indicate the variance rate of the original scale.
Factor loadings of both the NA and the PA subscales were found to be higher than 0.30, as indicated by the EFA. Only the factor load of the ‘tired’ item, which is included in the NA subscale of the original scale, was lower than 0.30. The literature indicates that factor loads should be higher than 0.30 or 0.40 (34). In this study, all factor loads, except for one item (i.e., tired), were higher than the desirable values and were similar to the results of the original scale (5). This may be because of the majority of women experience fatigue after childbirth. In the postpartum period, women can see fatigue culturally normal (36,37). Indeed, being tired is an important problem of women shortly after childbearing. Combined with the continuous needs of the newborn, tiredness can have a negative affect on women’s feelings and therefore increases the risk for PPD (37).
CFA should be particularly used for the adaptation of scales that have been priorly developed. Factor analysis explains the relationship between the items and factors. Studies from different countries that have aimed to analyze the factor structure of the DEQ have yielded mixed results, with some showing that the scale consisted of seven subscales (2), others two subscales (5) and some others, three subscales (3). The CFA indicated that the DEQ had a two-factor structure for the Turkish sample. All factor loadings were found to be higher than 0.30 for the PA and NA subscales, except for the ‘tired’ item. Comparison could not be made because Buttner and colleagues (5) did not indicate the DFA findings of the
original scale. The literature state that items can be left if the item does not worsen the model and researchers find it appropriate (32,38-41). Since this item did not affect the factor structure of the scale, it was not removed from the scale, and thereby the original structure of the scale was preserved.
The literature specifies that the GFI, NFI, NNFI, and CFI should be higher than 0.90, that the RMSEA should be lower than 0.08 and that the division of the chi-square value by degrees of freedom should be lower than five (38). In this study, these values were suitable; the data fit the model and confirmed the two-factor structure; the items and subscales of the scale were related to the scale, and the items in each subscale sufficiently defined their factor. The comparison could not be made since Buttner and colleagues (5) did not indicate the DFA findings of the original scale. For the revised form, sufficient fit indices were only obtained when the scale had three subscales and 38 items. The EFA and CFA in this study supported the construct validity of the scale and showed that the scale was valid for use in a Turkish sample.
A Cronbach's alpha value between 0.60 and 0.80 indicates a quite reliable scale, while a value higher than 0.80 shows a high-level reliability (34). For the original scale, the Cronbach's alpha coefficient of both the NA and the PA subscales were higher than 0.80 on all days (5). In the present study, the Cronbach's alpha coefficient was also found to be higher than 0.80 for the entire scale, including the NA and PA subscales. In this study, Cronbach's alpha values indicated a high level of reliability for the scale and its subscales and were similar to the original scale.
The percentage of those who have the lowest possible score on a scale shows the floor effect, while the percentage of those who have the highest score shows the ceiling effect. Both effects should be lower than 15.0% (28,39), as was, in fact, the case in this study. These findings indicate that the scale and its subscales had a high-level of reliability.
The item-total score analysis is an indicator of whether or not the items of the scale can measure the intended
feature (28,33-39). The correlation value obtained should be higher than 0.25 and should not be negative (28,39). The subscale item-total score correlation coefficients were higher than 0.25 in this study, from which it can be concluded that all items of the scale had a high-level correlation with its subscales and sufficiently measured the intended feature and that the scale and its subscales had a high reliability level (p<0.001). Only the correlation coefficient of the ‘tired’ item was lower than 0.25. Since the literature specifies that an item can remain on the scale even if its correlation is low, for the purpose of preserving its original structure, the item was not removed from the scale, as it complied with the other items (33-39). It is necessary to preserve the original structure of the scale tested in a different culture to measure same structures, measure the same features and compare the results (32,38-41). Therefore, the item was not removed from the scale.
One of the most frequently used methods to test the reliability of the scales is the comparison of the lower and upper groups of 27.0%. As evidence of the reliability and validity of the scale, a significant difference is expected between the mean scores of these groups (33-39). In this study, a significant difference was found between the upper and lower groups for the NA and PA subscales. This finding indicates that the scale sufficiently represents the intended field and is a reliable tool, capable of sufficiently discriminating between the groups.
The Receiver operating characteristic (ROC) curve, which yields the sensitivity and specificity rates, provides an appropriate breakpoint for the measurement tool. The higher (high sensitivity zone) and more to the left (low false positive rate zone) the curve is turned, the better is the test. An area under the curve (AUC) of 0.50 is regarded as no discrimination, between 0.50 and 0.70 is regarded as an insignificant discrimination power, between 0.70 and .80 is regarded as acceptable, between 0.80 and 0.90 is very good and higher than 0.90 is regarded as perfect (40). In this study, it was determined that the AUC values made excellent discrimination on all days in the NA subscale. However, on the first and third days, the AUC values were found to make only acceptable
discrimination, and their discrimination power decreased on the fifth and tenth days. In conclusion, the cut-off points were determined to sufficiently discriminate the postpartum affects. Comparison, however, could not be made since Buttner and colleagues (5) did not indicate these findings in detail for the original scale.
The DEQ, which was introduced in Turkey with this study, is the first scale of its kind capable of being used in maternity clinics, particularly for early diagnosis of postpartum blues, which is an important risk factor for PPD. Despite the many strengths of this study, there were a few limitations, the most significant being that the scale was administered on the first, third, fifth, and tenth days only, although it is well-known that postpartum blues symptoms may change daily. Another limitation is that the study was conducted in only one center in Turkey. Lastly, the mothers constituting the study sample were selected using the convenience sampling method. Different results may, however, have been obtained in a multi-center, randomized controlled study.
In conclusion, the findings of this present study have revealed that the DEQ is a valid and reliable tool for a Turkish sample and can sufficiently assess the NA and PA of women in the early postpartum period. The DEQ can be a particularly useful tool for midwives and nurses who provide obstetric care as well as for the family physicians, gynecologists and pediatricians who are responsible for tending to the psychological health of mothers in the postpartum period, insofar as the DEQ will enable them to effectively screen the NA and PA of blues, which are the first and most important predictors of PPD, and, if necessary, to make additional assessments. The addition of the DEQ to the Postpartum Care Guide and putting the scale into routine use as a screening tool for the purpose of improving the quality of postpartum care will contribute to identifying the PB prevalence in Turkish women, to carrying out the required follow-ups and to producing practical solutions for the protection and promotion of maternal mental health.
Conflict of Interest: Authors declared no conflict of interest. Financial Disclosure: Authors declared no financial support.
REFERENCES
1. Sword W, Watt S. Learning needs of postpartum women: does socioeconomic status matter? Birth 2005;32(2):86-92. [CrossRef]
2. Kennerly H, Gath D. Matenity blues I. detection and measurement by questionnaire. Brit J Psychiat 1989;155(3):356-62.
3. Pitt B. Maternity blues. Brit J Psychiat 1973;122(569):431-3. [CrossRef]
4. Pop V J, Truijens SE, Spek V, Wijnen HA, van Son MJ, Bergink V. A new concept of maternity blues: is there a subgroup of women with rapid cycling mood symptoms? J Affect Disord 2015;177(1):74-9. [CrossRef]
5. Buttner MM, O'Hara MW, Watson D. The structure of women's mood in the early postpartum. Assessment 2012;19(2):247-56. [CrossRef]
6. Buttner MM, Brock R L, O'Hara M W. Patterns of women's mood after delivery: a growth curve analysis. J Affect Disord 2015;174:201-8. [CrossRef]
7. Takahashi Y, Tamakoshi K. Factors associated with early postpartum maternity blues and depression tendency among japanese mothers with full-term healthy infants. Nagoya J Med Sci 2014;76(1-2):129-38.
8. Youn JH, Jeong IS. Predictors of postpartum depression: prospective cohort study. J Korean Acad Nurs 2013;43(2):225-35. [CrossRef]
9. Seyfried LS, Marcus SM. Postpartum mood disorders. Int Rev Psychiatry 2003;15(3):231-42. [CrossRef]
10. Apter-Levy Y, Feldman M, Vakart A, Ebstein RP, Feldman R. Impact of maternal depression across the first 6 years of life on the child's mental health, social engagement and empathy: the moderating role of oxytocin. Am J Psychiat 2013;170(10):1161-68. [CrossRef]
11. Gonidakis F, Rabavilas A D, Varsou E, Kreatsas G, Christodoulou GN. Maternity blues in Athens, Greece: a study during the first 3 days after delivery. J Affect Disord 2007;99(1-3):107-15. [CrossRef]
12. Bydlowski S, Lalanne C, Golse B, Vaivre-Douret L. Postpartum blues: a marker of early neonatal organization. Infant Ment Health J 2013;4(6): 08-15. [CrossRef]
13. Stein GS. The pattern of mental change and body weight change in the first postpartum week. J Psychosom Res 1980;24(3-4):165-71. [CrossRef]
14. Edhborg M. Comparisons of different instruments to measure blues and to predict depressive symptoms 2 months postpartum: a study of new mothers and fathers. Scand J Caring Sci 2008;22(2):186-95. [CrossRef]
15. Reck C, Stehle E, Reinig K, Mundt C. Maternity blues as a predictor of DSM-IV depression and anxiety disorders in the first three months postpartum. J Affect Disord 2009;113(1-2):77-87. [CrossRef]
16. Ishikawa N, Goto S, Murase S, Kanai A, Masuda, T, Aleksic B, Usui H, Ozaki N. Prospective study of maternal depressive symptomatology among japanese women. J Psychosom Res 2011;71(4):264-69. [CrossRef]
17. Karamustafaoğlu N, Tomruk N. Postpartum hüzün ve depresyonlar. Duygudurum Dizisi 2000;2(1):64-71. [Turkish]. 18. Yıldız D. Counselling needs and interventions of mothers about
infant care during postpartum period. Gülhane Medical Journal 2008;50(4):294-98.
19. Kendell RE, McGuire RJ, Connor Y, Cox J L. Mood changes in the first three weeks after childbirth. J Affect Disord 1981;3(4):317-26. [CrossRef]
20. Whiffen V. Vulnerability to postpartum depression: A prospective multivariate study. J Abnorm Psychol 1988;97:467-474. [CrossRef]
21. Handley SL, Dunn TL, Waldron G, Baker JM. Tryptophan, cortisol and puerperal mood. Br J Psychiatry 1980;136:498-508. [CrossRef]
22. Henshaw C. Mood disturbance in the early puerperium: a review. Arch Women's Ment Health 2003;6:33-42. [CrossRef] 23. Watson D. Rethinking the mood and anxiety disorders: a
quantitative hierarchical model for DSM-V. J Abnorm Psychol 2005;114(4):522-536. [CrossRef]
24. Sellbom M, Ben-Porath YS, Bagby RM. On the hierarchical structure of mood and anxiety disorders: confirmatory evidence and elaboration of a model of temperament markers. J Abnorm Psychol 2008;117(3):576-90. [CrossRef]
25. Miller ML, Kroska EB, Grekin R.Immediate postpartum mood assessment and postpartum depressive symptoms. J Affect Disord 2017;207:69-75. [CrossRef]
26. Engindeniz AN, Küey L, Kültür S. Edinburg doğum sonrası depresyon ölçeği Türkçe formu geçerlilik ve güvenilirlik çalışması. Bahar Sempozyumları, Ankara, Psikiyatri Derneği Yayınları, 1996. p. 51-52. [Turkish].
27. Costello AB, Osborne JW. Best practices in exploratory factor analysis: Four recommendations for getting the most from your analysis. PARE 2005;10(7):1-9.
28. Şencan H. Sosyal ve davranışsal ölçümlerde güvenilirlik ve geçerlilik. 1st ed., Ankara: Seçkin Yayıncılık; 2005. p. 107-63.
[Turkish].
29. Etikan İ, Musa SA, Alkassim RS. Comparison of convenience sampling and purposive sampling. AJTAS 2016;5(1):1-4. [CrossRef]
30. Erdoğan S, Nahcivan N, Esin MN. Hemşirelikte araştırma süreç, uygulama ve kritik. 2nd ed., İstanbul: Nobel Tıp Kitabevleri;
2015. p. 183. [Turkish].
31. Cox JL, Holden JM, Sagovsky R. Detection of postnatal depression: Development of the10-item Edinburgh postnatal depression scale. Br J Psychiatry 1987;150(6):782-86. [CrossRef] 32. Şimsek OF. Yapısal eşitlik modellemesine giriş: Temel ilkeler ve
LISREL uygulaması. 1th ed., İstanbul: Ekinoks Yayınevi; 2007. p.
1-151. [Turkish].
33. Akgül A.Tıbbi Arastırmalarda istatistiksel analiz teknikleri SPSS uygulamaları. 1. ed., Ankara: Emek Ofset Lmt. Şti.; 2005. p. 187– 385. [Turkish].
34. Tavşancıl E. Tutumların ölçülmesi ve SPSS ile veri analizi. 5th ed., Ankara: Nobel Akademik Yayıncılık; 2014. p. 240. [Turkish]. 35. Tavşanel E. Tutumların Ölçülmesi ve SPSS Ile Veri Analizi.
Ankara: Atlas Yayınevi; 2002. p. 16-61. [Turkish].
36. Can R, Ege E, Akın B, Koçoğlu D. Doğum sonu ilk üç aylık dönemde annedeki yorgunluk düzeyi ve ilişkili faktörler. Maltepe Üniversitesi Hemşirelik Bilim ve Sanatı Dergisi 2010;3(2):62-70. [Turkish].
37. Corwin EJ, Arbour M. Postpartum fatigue and evidence-based interventions. MCN Am J Matern Child Nurs 2007;32(4):215-20;quiz 221-2. [CrossRef]
38. Hooper D, Coughlan J, Mullen MR. Structural equation modelling: quidelines for determining model fit. Electronic J Business Res Methods 2008;6(1):53-60.
39. Terwee CB, Bot SD, de Boer MR, van der Wind DA, Knol DL, Dekker J, et al. Quality criteria were proposed for measurement properties of health status questionnaires. J Clin Epidemiol 2007;60(1):34-42. Available from: https://www.ncbi.nlm.nih. gov/pubmed/17161752 [CrossRef]
40. Dirican A. Evaluation of the diagnostic test's performance and their comparisons. Cerrahpaşa J Med 2001;32(1):25-30. 41. Wilson M. Constructing Measures: An Item Response Modeling