https://doi.org/10.1007/s00405-019-05654-8 OTOLOGY
The relationship between the findings of vestibular evoked myogenic
potentials and severity of obstructive sleep apnea syndrome
Bülent Ulusoy1 · Osman Gül1 · Çağdaş Elsürer1 · Mete Kaan Bozkurt1 · Baykal Tülek2 · Muslu Kazım Körez3 · Hakan Ekmekçi4 · Bahar Çolpan1
Received: 25 June 2019 / Accepted: 12 September 2019 / Published online: 21 September 2019 © Springer-Verlag GmbH Germany, part of Springer Nature 2019
Abstract
Purpose Our study aimed to evaluate the effects of chronic hypoxic state in Obstructive Sleep Apnea Syndrome (OSAS) on brainstem pathways using Vestibular Evoked Myogenic Potential (VEMP) test and to investigate the presence of new markers likely to be correlated with the severity of the disease.
Methods The study was planned as prospective and double blind. A total of 60 patients (120 ears) diagnosed with mild, moderate and severe OSAS were included in the study and the patients are grouped as 20 patients in each group. Twenty volunteer healthy individuals (40 ears) shown to be without OSAS were included in the study. VEMP measurements were made in 60 study group patients (120 ears) and in 20 healthy controls (40 ears). The groups were compared in terms of vari‑ ables such as the acquisition rate of oVEMP and cVEMP waves, interval between the waves, latency and amplitude of the waves. p < 0.05 values were considered as significant.
Results The results of cVEMP test showed that the rate of wave acquisition in the moderate and severe OSAS groups was sig‑ nificantly lower than the control group and mild OSAS groups (p = 0.008). There was no difference between the control group and the mild OSAS group in terms of the rate of obtaining the wave (p > 0.05). In the moderate and severe OSAS groups, P1N1 amplitude and N1P2 amplitude values were found to be significantly lower than the mild OSAS group (p = 0.007 and
p = 0.017, respectively). In the oVEMP test, there was no significant difference between the mild OSAS group and the control
group in terms of the wave yield (p > 0.05); however, it was found that the rate of wave acquisition in the moderate and severe OSAS groups was significantly lower than the mild OSAS group (p = 0.041). There was inverse correlation between the N1P2 interval and P1N1 amplitude value and AHI in simple regression analysis and multiple regression analysis (p = 0.012 and p = 0.021; p = 0.009 and p = 0.040, respectively).
Conclusion The negative effects of chronic intermittent hypoxia related with OSAS on the brainstem and vestibular system can be demonstrated by VEMP tests. Especially, the inability to obtain the wave is the most important finding showing this situation. Also, we think that N1P2 interval and P1N1 amplitude markers can be used to detect the subclinical negative effect of chronic hypoxia on vestibular nuclei in the brainstem.
Keywords Obstructive sleep apnea syndrome · Cervical vestibular evoked myogenic potentials · Ocular vestibular evoked myogenic potentials · Hypoxia · Brainstem
* Bülent Ulusoy
[email protected] Osman Gül
[email protected] Mete Kaan Bozkurt [email protected] Baykal Tülek
[email protected] Bahar Çolpan
1 Department of Otorhinolaryngology‑Head and Neck
Surgery, Faculty of Medicine, Selçuk University, Konya 42075, Turkey
2 Department of Chest Disease, Faculty of Medicine, Selçuk
University, Konya, Turkey
3 Department of Statistics, Faculty of Scince, Selçuk
University, Konya, Turkey
4 Department of Neurology, Faculty of Medicine, Selçuk
Introduction
Vestibular Evoked Myogenic Potential (VEMP) test has increased popularity and is a useful test in neuro‑otologic test battery [1]. Generally, VEMP tests are performed as two test types as cervical vestibular evoked myogenic potential (cVEMP) and ocular vestibular evoked myo‑ genic potential (oVEMP). Occurring otolith‑dependent reflexes due to stimulation of the ear with air‑conducted sound or vibration of the bone are recorded in this test. Surface electrodes for reflex recordings are placed under eye for oVEMP test, while placed on the sternocleidomas‑ toid muscle (SCM) for cVEMP test [1]. Colebatch et al. first described the cVEMP test in 1994. The reflex arc in the cVEMP test includes the saccular, inferior vestibular nerve, lateral vestibular nucleus, medial vestibulospinal tract and spinal motor cord neurons [1, 2]. In the cVEMP test, a biphasic wave (p13–n23) is obtained at about 13 and 23 ms (ms) [1]. oVEMP was defined approximately 10 years after cVEMP. In the oVEMP test, biphasic wave (n10–p15) occurs at approximately 10 and 15 ms [1]. The oVEMP reflex arch comprises up utricle, superior vestibu‑ lar nerve and vestibular nuclei [1, 3]. The VEMP test dem‑ onstrates the loss of otolith function result from damage in the inner ear, peripheral and central vestibular pathway (Meniere’s disease, vestibular neuritis or stroke) [1, 4].
Obstructive Sleep Apnea Syndrome (OSAS) is a dis‑ ease characterized by recurrent upper airway collapse during sleep [5, 6]. This condition leads to nocturnal hypoxia, increased sympathetic nervous system activ‑ ity, and impaired neurocognitive function. Additionally, it may lead to increased risk of cardiovascular disease, stroke, metabolic diseases, traffic accidents and loss of work power [5–7]. It is known that approximately 4% of adult males and 2% of females are affected [5]. Obesity, advanced age and male sex are known as risk factors [5,
8]. The pathogenesis of OSAS is not fully understood yet [5]. The pathophysiology is thought to be multifactorial. Factors such as problems of respiratory tract anatomy, functional problems in dilator muscles of the upper air‑ way, and problems in ventilator stability are thought to play an important role in pathophysiology [5]. Histologi‑ cal studies have reported motor neuron damage in the palatopharyngeal muscles. In addition, local neurological pathologies have been shown to contribute to the devel‑ opment of OSAS [9]. The diameter of the upper respira‑ tory tract varies with the afferent sensorial inputs from the respiratory center of the brainstem. Therefore, afferent sensory and local motor dysfunctions may predispose to the development of OSAS [9]. Several studies have shown that VEMP testing may be a useful option in the evalua‑ tion of brainstem in neurological pathologies [3, 4, 10].
VEMP testing has been shown to be more sensitive than the clinical examination, magnetic resonance imaging (MRI) and auditory brainstem response (ABR) tests in detecting brainstem involvement in patients with multiple sclerosis [4].
The main aim of this study is to evaluate the possible negative effects of OSAS on the brainstem region using VEMP test that is a non‑invasive method and to investi‑ gate new markers likely to be correlated with the severity of the disease. According to knowledge obtained from our screening in PubMed, this is the first study to investigate brainstem damage in patients with OSAS using both cVEMP and oVEMP tests.
Materials and method
In this study, 60 volunteer individuals with OSAS diagnosed by polysomnography between 2018 and 2019, and 20 volun‑ teer individuals who were shown to without OSAS by poly‑ somnography were included as the control group. Our study was planned as a prospective and double blind. The person performed the VEMP test has not known the participant’s role in the study (patient or control group). In the same way, the researchers who evaluated polysomnography have not known the VEMP results. Two different researchers except for researchers who performed the first two evaluations made the analysis of the obtained data. The study was approved by the ethics committee of our hospital and the study was carried out in accordance with the Declaration of Helsinki. Informed consent form was obtained from the patients before the study. Patients admitted with the complaints of snoring and have apnea–hypopnea index (AHI) less than 5 were grouped as control. Patients with AHI values between 5 and 15 were classified as mild OSAS, and between 15 and 30 were classified as moderate OSAS. Patients with AHI values above 30 and who were recommended CPAP were classified as severe OSAS. Twenty patients from each group were included in the study. After comprehensive examina‑ tion of ear, nose and throat of the patients, pure‑tone thresh‑ old measurements were performed at frequencies between 250 Hz and 8 kHz with pure‑tone audiometry test. Patients with hearing thresholds less than 25 dB were excluded from the study. In addition, diabetes mellitus, uncontrolled hyper‑ tension, patients with known neurotological diseases, those with vascular disease, those with a history of trauma or acoustic trauma to the head, cervical or eye‑related surgery, those with BMI > 40, those with metabolic diseases, under 18 and over 60 individuals were not included in the study.
VEMP measurements were made in a total of 60 patients (120 ears) in the patient’s group and in 20 healthy subjects (40 ears) in the control group. cVEMP and oVEMP tests were performed once a time in the control group, mild OSAS
and moderate OSAS groups. In patients with severe OSAS, VEMP tests were planned to perform twice before and after 3 months of regular CPAP. The groups were compared in terms of variables such as the obtaining rate of oVEMP and cVEMP waves, the interval between the waves, latency and amplitude of the waves.
VEMP test
VEMP measurements of the patients were performed in our Audio‑Vestibular laboratory (GN Otometrics A/S ICS Chartr® EP 200, Denmark). The patient was seated with the
back against the chair. In the cVEMP test, myogenic activ‑ ity measurement was performed on the same side of the SCM muscle by giving a sound stimulus to the ear. SCM muscle was determined as target muscle for cVEMP meas‑ urements. During this measurement, the patient’s head was rotated about 30° to the contralateral side of the tested side. To obtain sufficient contraction in the SCM muscle to be measured, the patient was asked to try to turn his/her head towards the measurement side. Muscle tension monitariza‑ tion was performed to keep this muscle tension within a cer‑ tain range. In addition, as long as there is sufficient muscle tension, the device automatically illuminates the green light and this feature has been taken into consideration during the measurement. In the cVEMP assay, the active electrode was placed on the middle 1/3 of the ipsilateral SCM muscle and the reference electrode was placed on the sternum and the ground electrode on the forehead. The VEMP electrode measuring the tension of the muscle was placed under the active electrode. cVEMP measurements were made that as a stimulus, 500 Hz air conduction (AC) Tone Burst stimulus, 4 rate (/s), 200 sweeps, 100 dB normalized hearing level (nHL), in alternating polarity and obtaining double trace were made. P1, N1 and P2 waves were determined. Wave latencies (P1, N1, P2), P1N1 interval, N1P2 interval, P1N1 amplitude, N1P2 amplitude and electromyography (EMG) values were recorded in the patients who obtained waves.
The oVEMP test was performed in sitting position. The patient was asked relax the facial muscles and to be comfortable. The patient was asked to look at a predeter‑ mined point to ensure that the upward angle was constant. The recording electrodes were placed symmetrically on the cheek 15–30 mm below the infra‑orbital rim on both sides. The active electrodes were placed near the eye, the reference electrode was placed just below the active electrode, and the ground electrode was placed in the forehead. Measure‑ ments, AC 500 Hz Tone Burst stimulus, 4 rate (/s) with 200 sweeps, 100 dB nHL, rarefaction polarity and double trase were performed. Contrary to cVEMP, extraocular excitation potentials in oVEMP are obtained from the contralateral, not ipsilateral. The oVEMP muscle response was negative (N1) about 10 ms after the auditory stimulus on the contralateral
side and positively after 14–16 ms (P1). Wave latencies (N1, P1), N1P1 interval and N1P1 amplitude values were determined.
Polysomnography
The diagnosis of OSAS was established by a full overnight polysomnography (Alice 5 Diagnostic Sleep System; Philips Respironics, Amsterdam, The Netherlands), which included the recording of oronasal flow, chest and abdominal wall motion, electrocardiogram, submental and pretibial electro‑ myography, electrooculography, electroencephalography (C3‑A2 and O2‑A1), pulse oximetry and body position. Polysomnography results were scored according to Ameri‑ can Academy of Sleep Medicine (AASM) scoring guidelines [11].
Ethics committee
Before starting the study, approval was obtained from the ethics committee of our hospital (2017/368).
Statistical analysis
All statistical analyses were performed with R Version 3.6.0 software. Histogram and p–p plots were examined and Anderson–Darling test were used to assess data nor‑ mality before statistical analyses. The Levene test was used to check the variance homogeneity. Continuous variables were expressed as mean ± standard deviation and median [interquartile range]. Multiple comparisons were conducted using Conover‑Iman tests with Bonferroni correction. Cat‑ egorical variables were described as numbers and percent‑ ages. The mild, moderate, severe OSAS groups and control group were compared to the presence of VEMP waves; N1, P1, P2 latencies; and P1N1, N1P2 intervals; and P1N1, N1P2 amplitudes; EMG, age, BMI, AHI, time and gender in the cVEMP findings. The mild, moderate, severe OSAS groups and control group were compared to the presence of VEMP waves; N1, P1 latencies; and N1P1 interval; and N1P1 amplitude, age, BMI, AHI, time and gender in the oVEMP findings. These comparisons were analyzed with Kruskal–Wallis test and Chi‑square test. Groups’ response rate was compared by Fisher’s exact test. Simple linear and multiple linear regression analyses were used to identify the factors associated with AHI and N1, P1, P2 latencies; and P1N1, N1P2 intervals; and P1N1, N1P2 amplitudes; EMG in the cVEMP findings. In addition, Simple linear and multiple linear regression analyses were used to identify the factors associated with AHI and N1, P1 latencies; and N1P1 inter‑ val; and N1P1 amplitude in the oVEMP findings. p < 0.05 was considered statistically significant.
Power analysis
A statistical power analysis was performed for sample size estimation, comparing response rate of groups. A total of 158 patients were required for a two‑sided statistical analy‑ sis with sufficient statistical power of 0.90 (β = 0.10 and
α = 0.05) (G Power 3.1 or other software). The effect size
(ES) in this study was 0.3, considered to be extremely medium using Cohen’s criteria [12].
Results
When comparing the groups in terms of variables such as latency, interval, amplitude, only the values of the wave‑ obtained individuals were taken into consideration.
cVEMP test results
The results of the groups in terms of the variables of the cVEMP test are shown in Table 1. According to this, the median age was 42.00 (Inter quartile range: IQR: 24.50) in the control group, 47.50 (IQR: 18.25) in the mild OSAS group, 57.00 (IQR: 17.00) in the moderate OSAS group and 51.50 (IQR: 15.00) in the severe OSAS group. When the groups were compared in terms of age, there was a signifi‑ cant difference between the control group and the moderate OSAS group (p = 0.007). All groups were similar in terms of gender. As body mass index (BMI) values were com‑ pared, BMI values of the control and mild groups were lower than the BMI values of the moderate and severe groups (p < 0.001). In the control group, the median AHI value was 2.94 (IQR: 2.50), in the mild OSAS group 9.01 (IQR: 3.15), in the moderate OSAS group, it was 20.90 (IQR: 4.84) and in the severe OSAS group, it was 44.00 (IQR: 19.30). There
Table 1 Comparison of groups according to cVEMP findings
The different letters in the lines indicate a statistically significant difference between the groups. p value of < 0.05 was used for statistical sig‑ nificance. Multiple comparisons were conducted using Conover–Iman tests with Bonferroni correction and p < 0.0083 was used for statistical significance
p Significance value for Kruskal–Wallis test, SD standard deviation, Med Median, IQR interquantile range, cVEMP cervical evoked myogenic potential, EMG electromyography, BMI body mass index, AHI Apnea–hypopnea index, M male, F female
*Chi‑square test was used
Control (n = 39) Mild (n = 40) Moderate (n = 34) Severe (n = 34)
cVEMP Mean ± SD Med (IQR) Mean ± SD Med (IQR) Mean ± SD Med (IQR) Mean ± SD Med (IQR) p P1 latency (ms) 15.01 ± 2.75 14.10 (2.63) 14.30 ± 1.55 14.15 (1.74) 14.44 ± 1.86 14.07 (2.57) 14.61 ± 1.97 14.19 (1.22) 0.840 N1 latency (ms) 22.94 ± 2.71 22.70 (4.28)a 22.15 ± 1.78 22.00 (1.65) 21.48 ± 2.13 21.25 (2.66)b 22.12 ± 2.19 21.52 (3.45) 0.047 P2 latency (ms) 29.71 ± 4.07 29.25 (4.98)a 29.67 ± 2.37 29.95 (2.86)a 27.52 ± 2.04 27.55 (3.40)b 29.52 ± 4.98 28.84 (3.93) 0.002 P1N1 inter‑
val (ms) 7.83 ± 1.46 7.85 (1.84)a 7.92 ± 1.90 7.85 (2.09)a 7.04 ± 1.87 6.62 (1.88)b 7.68 ± 1.60 7.52 (1.94) 0.049 N1P2 Inter-val (ms) 7.09 ± 2.16 6.80 (1.89) 7.56 ± 1.47 7.43 (1.68)a 6.30 ± 1.33 6.27 (1.82)b 6.64 ± 1.57 6.50 (2.22)b 0.005 P1N1 amplitude (μV) 86.97 ± 56.05 72.50 (42.03) 102.58 ± 50.61 94.65 (67.29)a 74.51 ± 53.73 62.74 (40.71)b 72.44 ± 49.08 56.29 (47.41)b 0.007 n1p2ampli‑ tude (μV) 61.16 ± 51.02 42.45 (40.19) 67.78 ± 30.97 66.25 (31.73)a 50.75 ± 36.71 46.66 (42.37)b 51.62 ± 36.08 40.60 (33.09)b 0.017 EMG 62.28 ± 10.49 58.00 (15.00) 74.31 ± 19.36 71.25 (27.88) 74.47 ± 23.03 67.00 (35.25) 71.15 ± 19.27 69.00 (24.50) 0.097 Age 41.33 ± 13.66 42.00 (24.50)a 46.75 ± 10.93 47.50 (18.25) 50.76 ± 12.21 57.00 (17.00)b 49.29 ± 9.06 51.50 (15.00) 0.007 BMI kg/m2 28.65 ± 3.13 28.90 (3.40) a 30.00 ± 2.03 30.45 (2.50)a 33.08 ± 3.82 33.50 (4.80)b 32.28 ± 3.18 32.30 (2.30)b < 0.001 AHI 2.44 ± 1.43 2.94 (2.50)a 9.35 ± 2.47 9.01 (3.15)b 21.11 ± 3.80 20.90 (4.84) c 50.98 ± 17.98 44.00 (19.30)d < 0.001 Time 4.20 ± 1.22 5.00 (1.25) 5.65 ± 4.09 5.00 (1.00) 5.09 ± 2.08 5.00 (2.00) 0.129 Gender (M/F)* 33/6 26/14 24/10 29/5 0.092
was no significant difference between the groups in terms of duration of the disease (p > 0.05).
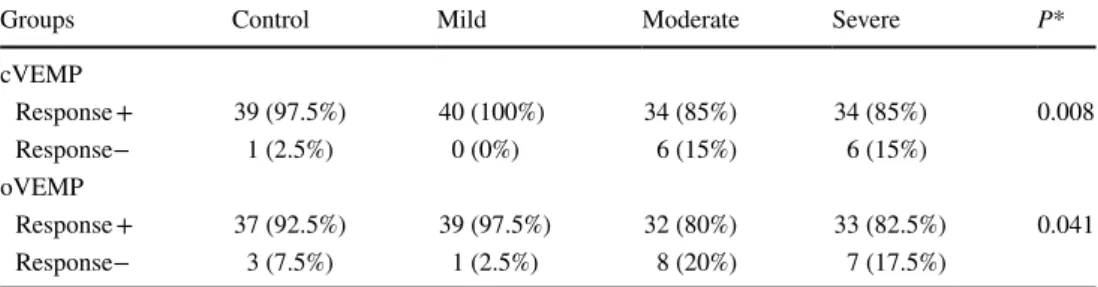
When the groups are compared according to rates of obtaining wave, in the moderate and severe OSAS groups, the rate of obtaining wave was significantly lower than the control group and mild OSAS group (p = 0.008) (Table 2). There was no significant difference between the mild OSAS group and the control group in terms of the rate of wave acquisition. Similarly, no significant difference was found between the moderate OSAS group and the severe OSAS group (Fig. 1). In the moderate and severe OSAS groups, P1N1 amplitude and N1P2 amplitude values were found to be significantly lower than the mild OSAS group (p = 0.007 and p = 0.017, respectively) (Fig. 2). While the N1 latency was significantly shorter in the moderate OSAS group than the control group, there was no significant differ‑ ence between the other groups (p = 0.047). In the moderate OSAS group, the P2 Latency and P1N1 Interval values were
significantly shorter than the control and mild OSAS groups (p = 0.002 and p = 0.049, respectively). In the moderate and severe OSAS groups, the N1P2 Interval value was shorter than the mild OSAS group (p = 0.005) and was similar to the control group (p > 0.05). There was no significant difference between the groups in terms of P1 latency and EMG values (p > 0.05).
oVEMP test results
The results of the groups in terms of the variables of the oVEMP test are shown in Table 3. In the control group, the median age was 42.00 (IQR: 27.00), in the mild OSAS group 48.00 (IQR: 18.00), in the moderate OSAS group 58.00 (IQR: 14.00) and in the severe OSAS group 52.00 (IQR: 16.00). When the groups were compared in terms of age, there was a significant difference between the control group and the moderate OSAS group (p = 0.003).
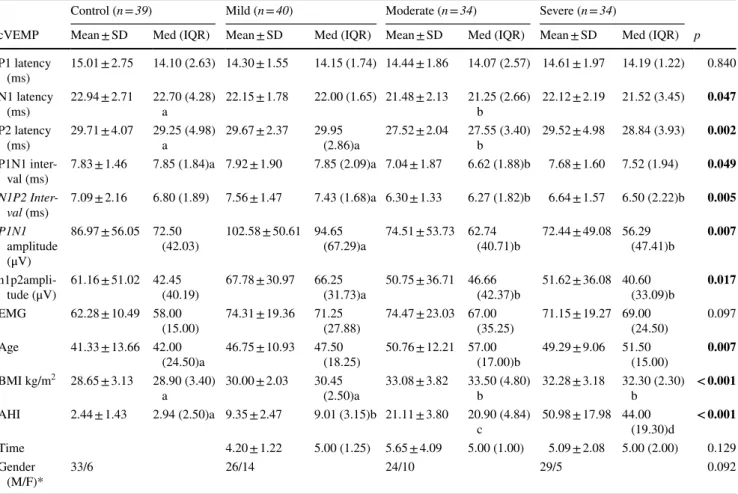
Table 2 Comparison of groups in terms of the rate of obtaining wave
*Fisher’s exact test was used
cVEMP cervical evoked myogenic potential, oVEMP ocular evoked myogenic potential
Groups Control Mild Moderate Severe P*
cVEMP Response + 39 (97.5%) 40 (100%) 34 (85%) 34 (85%) 0.008 Response− 1 (2.5%) 0 (0%) 6 (15%) 6 (15%) oVEMP Response + 37 (92.5%) 39 (97.5%) 32 (80%) 33 (82.5%) 0.041 Response− 3 (7.5%) 1 (2.5%) 8 (20%) 7 (17.5%)
Fig. 1 a Comparison of groups in cVEMP test for the rate of obtaining wave. b Comparison of groups in terms of the rate of obtaining wave in
When the groups were examined in terms of gender, there was a difference between mild OSAS and severe OSAS groups (p = 0.040). BMI values of the control and mild OSAS groups were found to be lower than the moderate
and severe OSAS groups (p < 0.001). In the control group, median AHI value was 2.94 (IQR: 2.28), 8.62 (IQR: 3.15) in the mild OSAS group, 20.63 (IQR: 5.10) in the mod‑ erate OSAS group and 42.87 (IQR: 23.60) in the severe
Fig. 2 Comparison of the groups in terms of P1N1 amplitude and N1P2 amplitude
Table 3 Comparison of groups according to oVEMP findings
The different letters in the lines indicate a statistically significant difference between the groups. p value of < 0.05 was used for statistical sig‑ nificance. Multiple comparisons were conducted using Conover‑–man tests with Bonferroni correction and p < 0.0083 was used for statistical significance
p Significance value for Kruskal–Wallis test, SD Standard deviation, Med Median, IQR Interquantile range, oVEMP ocular evoked myogenic potential, EMG Electromyography, BMI Body mass index, AHI Apnea–hypopnea index, M Male, F female
*Chi‑square test was used
Control (n = 37) Mild (n = 39) Moderate (n = 32) Severe (n = 33)
oVEMP Mean ± SD Med (IQR) Mean ± SD Med (IQR) Mean ± SD Med (IQR) Mean ± SD Med (IQR) p N1 latency (ms) 10.47 ± 0.52 10.40 (0.42) 10.27 ± 0.55 10.22 (0.80) 10.83 ± 1.68 10.53 (0.87) 10.69 ± 0.97 10.54 (0.75) 0.642 P1 latency(ms) 14.92 ± 1.20 14.84 (2.10) 14.75 ± 1.05 14.67 (1.33) 15.43 ± 2.02 15.07 (2.54) 14.95 ± 1.29 14.67 (2.00) 0.079 N1P1 interval (ms) 4.45 ± 1.03 4.25 (1.25) 4.50 ± 0.95 4.42 (1.14) 4.52 ± 1.15 4.42 (1.67) 4.25 ± 1.07 3.95 (1.37) 0.638 N1P1 ampli‑ tude (μV) 9.54 ± 7.49 7.85 (6.76)a 7.08 ± 5.61 5.90 (4.46)b 9.39 ± 5.00 7.66 (8.55)a 7.73 ± 5.91 5.45 (8.12)b 0.041 Age 41.11 ± 13.94 42 (27)a 47.13 ± 10.80 48 (18) 52.13 ± 11.79 58 (14)b 49.27 ± 9.49 52 (16) 0.003 BMI kg/m2 28.63 ± 3.22 28.70 (4.80)a 30.11 ± 1.92 30.50 (2.50)a 32.89 ± 3.92 32.80 (5.23)b 32.36 ± 3.17 32.30 (2.20)b < 0.001 AHI 2.44 ± 1.43 2.94 (2.28)a 9.29 ± 2.47 8.62 (3.15) b 21.17 ± 3.83 20.63 (5.10)c 50.92 ± 18.39 42.87 (23.60)d < 0.001 Time 4.15 ± 1.20 5 (1.50) 4.72 ± 1.61 5 (1.00) 4.85 ± 1.75 5 (3.00) 0.177 Gender (M/F)* 32/5 25/14 a 23/9 29/4b 0.040
OSAS group. The groups were similar in terms of duration of the disease (p > 0.05).
When the groups were compared in terms of the rate of obtaining wave, there was no significant difference between the mild OSAS group and the control group (p > 0.05), whereas it was found that the rate of obtain‑ ing wave in the moderate and severe OSAS groups was significantly lower than the mild OSAS group (p = 0.041) (Table 2). However, it was found that the control group and the moderate and severe OSAS groups were similar in terms of wave acquisition rates (p > 0.05) (Fig. 3). In the mild and severe OSAS groups, N1P1 amplitude was found to be lower than control and moderate OSAS groups (p = 0.041). There was no significant difference between
the groups in terms of N1 latency, P1 latency and N1P1 Interval (p > 0.05).
Since the number of patients using CPAP for 3 months in the severe OSAS group was very low (three patients), VEMP measurements planned after treatment could not be performed.
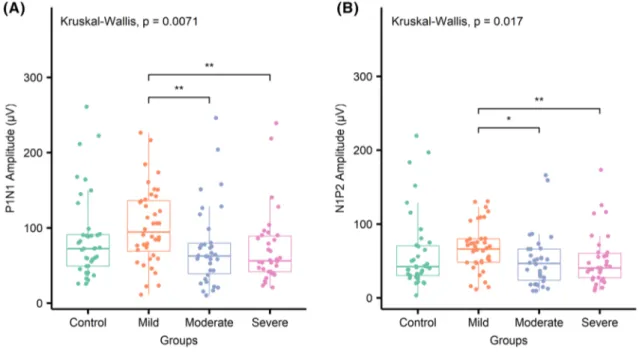
The relationship between AHI value and VEMP param‑ eters was analyzed by simple linear regression analysis and multiple regression analysis (Table 4). According to simple linear regression analysis, as parameters N1P2 interval and P1N1 amplitude values (cVEMP parameters) decreased, AHI values increase. In other words, there was an inverse relationship between AHI value and N1P2 inter‑ val and P1N1 amplitude values (p = 0.012 and p = 0.021,
Fig. 3 Evaluation of the rela‑
tionship between AHI value and VEMP parameters with simple linear regression analysis
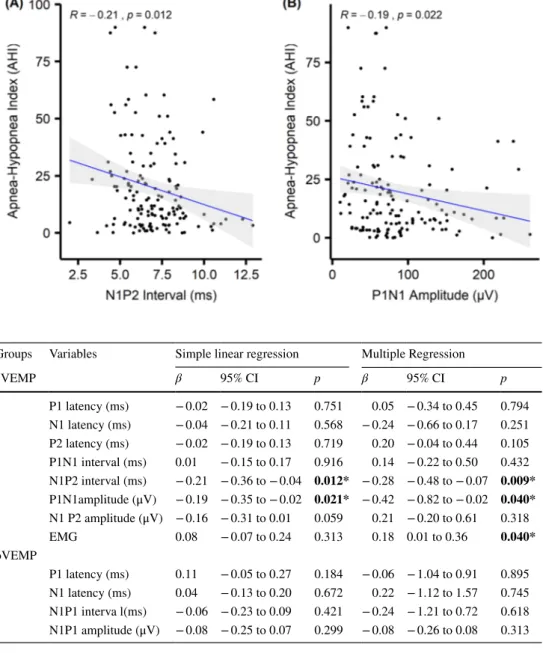
Table 4 Evaluation of the relationship between AHI value and VEMP parameters with simple linear regression analysis and multiple regression analysis
cVEMP cervical evoked myogenic potential, oVEMP ocular evoked myogenic potential, EMG Electromyo‑ graphy
Groups Variables Simple linear regression Multiple Regression
cVEMP β 95% CI p β 95% CI p P1 latency (ms) − 0.02 − 0.19 to 0.13 0.751 0.05 − 0.34 to 0.45 0.794 N1 latency (ms) − 0.04 − 0.21 to 0.11 0.568 − 0.24 − 0.66 to 0.17 0.251 P2 latency (ms) − 0.02 − 0.19 to 0.13 0.719 0.20 − 0.04 to 0.44 0.105 P1N1 interval (ms) 0.01 − 0.15 to 0.17 0.916 0.14 − 0.22 to 0.50 0.432 N1P2 interval (ms) − 0.21 − 0.36 to − 0.04 0.012* − 0.28 − 0.48 to − 0.07 0.009* P1N1amplitude (μV) − 0.19 − 0.35 to − 0.02 0.021* − 0.42 − 0.82 to − 0.02 0.040* N1 P2 amplitude (μV) − 0.16 − 0.31 to 0.01 0.059 0.21 − 0.20 to 0.61 0.318 EMG 0.08 − 0.07 to 0.24 0.313 0.18 0.01 to 0.36 0.040* oVEMP P1 latency (ms) 0.11 − 0.05 to 0.27 0.184 − 0.06 − 1.04 to 0.91 0.895 N1 latency (ms) 0.04 − 0.13 to 0.20 0.672 0.22 − 1.12 to 1.57 0.745 N1P1 interva l(ms) − 0.06 − 0.23 to 0.09 0.421 − 0.24 − 1.21 to 0.72 0.618 N1P1 amplitude (μV) − 0.08 − 0.25 to 0.07 0.299 − 0.08 − 0.26 to 0.08 0.313
respectively) (Fig. 3). According to multiple regression analysis, it has been found a relation NIP2 interval, P1N1 amplitudes, and EMG value with AHI. According to this, it has been observed that as EMG value increases, AHI value also significantly increases (p = 0.040), whereas as the N1P2 interval and P1N1 amplitude decrease, AHI value increases (p = 0.009 and p = 0.040, respectively). It was seen that no parameter had a significant effect on AHI value according to both simple linear regression and multiple regression analy‑ ses in the oVEMP test (p > 0.05).
Discussion
The most important finding of this study is, especially in patients with moderate and severe OSAS, the rate of obtain‑ ing VEMP waves is lower than in the control group. Also, the similarity of the mild OSAS group and the control group in terms of the wave yield indicates that as the severity of the disease increases, the rate of wave acquisition decreases, i.e. the risk of subclinical brainstem damage increases. Simi‑ larly, in comparison with ones of mild OSAS patients, lower P1N1 and N1P2 amplitudes in moderate or severe OSAS patients suggest that it is likely to be a relation between the severity of disease and damage of the subclinical brainstem.
The VEMP test can be used to detect peripheral ves‑ tibular pathologies as well as a non‑invasive method that can be used to evaluate brainstem damage caused by dif‑ ferent reasons (such as Parkinson’s disease, multiple scle‑ rosis and brainstem stroke) [3, 4, 10, 13]. Failure to obtain wave (lack of response), prolongation of wave latencies and low wave amplitudes have been reported as the most com‑ mon VEMP pathologies in patients with multiple sclerosis. These abnormalities in the VEMP test have been alleged to be due to demyelination in the vestibular pathway or vestibular nucleus [4]. Similarly, more VEMP abnormali‑ ties were found in the study investigate the involvement of the brainstem in patients with Parkinson’s diseases with VEMP test. Abnormalities such as lack of response (absent of wave), low wave amplitude and prolongation of laten‑ cies were reported in those patients [3]. Chen et al. reported that VEMP waves could not be obtained and prolongation in latencies in patients with brainstem stroke. In addition, they showed that the failure to obtain wave was correlated with the hemorrhage in to the pons in MRI [10]. Heide et al. have also found similar findings such as failure to obtain wave, low amplitude and latency pathologies in patients with brainstem infarction. They also claimed that the VEMP test could demonstrate pathologies from the medulla oblongata to the mesencephalon [13].
OSAS: it causes recurrent intermittent hypoxia and reoxy‑ genation periods. This causes oxidative stress, endothelial dysfunction and activation of inflammatory cascade [14].
It has been experimentally shown that hypoxia negatively affects the brainstem and it has been reported that the regions responsible for breathing and cardiovascular func‑ tions are affected in the brainstem [15]. Moreover, patients with OSAS had structural deficits in the hippocampus/fron‑ tal lobe due to hypoxia and impaired neurocognitive function [8, 16, 17]. In patients with OSAS, prolongation of I, III, V wave latencies and interpeak latencies (I–V, I–III, III–V) in ABR have been shown [14, 18]. Fu et al. reported that latency in the speech‑ABR test was longer in patients with OSAS and that this prolongation in latency correlated with AHI [19].
In our review of PUBMED, we found only one study on VEMP findings in patients with OSAS. In this study, severe OSAS patients (AHI > 70) were included in the study and only patients were examined with cVEMP test. In this study, it has been reported that the rate of obtaining wave was lower, and P1N1 and P2N2 amplitudes were lower in OSAS patients. However, they found that there was no significant difference between the patient group and the control group in terms of wave latencies and intervals. In this study, it was claimed that the rate of VEMP response decreased as a result of the hypoxia in severe OSAS damaging the sacculo‑collic reflex arch in the brainstem. As a result, they reported that VEMP test could be used as a diagnostic test to evaluate brainstem damage [2]. Our study was the first to evaluate the possible negative effects of hypoxic status in OSAS patients on brainstem and vestibular system with both oVEMP and cVEMP (both inferior vestibular nerve and superior vestibu‑ lar nerve and vestibular nuclei in brainstem). It was also the first study to investigate the relationship between the sever‑ ity of OSAS and the severity of damage in the brainstem. In our study, similar to cVEMP findings in the diseases caused brainstem damage, the rate of obtaining wave in VEMP test was found significantly low in patients with moderate or severe OSAS compared to the patients with mild OSAS and control group patients. In the oVEMP test, it was found that the rate of obtaining wave in the moderate and severe OSAS group swas significantly lower than the mild OSAS group. According to this, we believe that this decrease in the rate of obtaining wave increases as the severity of the disease increases the hypoxic status of OSAS patients on the brainstem and vestibular system. Unlike the only study reported in the literature by Mutlu et al., we found that the rate of the obtaining wave in the cVEMP test was similar in mild and control groups, while it has been found lower in patients with moderate and severe OSAS (parallel to the severity of the disease). In accordance with the literature, P1N1 and N1P2 amplitudes were significantly lower in the moderate and severe OSAS groups. Unlike the literature, the relationship between the groups in terms of latency and interval parameters was found to be very variable. Therefore, it is not possible to make a consistent interpretation based
on these data. Although the VEMP test has been tried to be performed in a standard way, it is sometimes difficult to provide standardization due to many factors such as the electrode used, the cooperation of the patient, the experience and the relevance of the person.
In both simple linear regression analysis and multi‑ ple regression analysis, there was an inverse relationship between N1P2 interval and P1N1 amplitude value and AHI value. This study is the first study in the literature (PubMed) that demonstrates such a relationship.
One of the limitations of this study is that the threshold values are not investigated in VEMP measurements. It may be useful to compare the groups in terms of threshold val‑ ues that can be obtained waves in the VEMP test. Another limitation, MRI could be performed especially in the par‑ ticipants without the wave. Except for, prospective studies involving more patients are needed to obtain more accurate information on parameters correlated with AHI.
Conclusion
As the severity of OSAS increases, we believe that espe‑ cially the decrease in cVEMP responses is caused by the negative effects of hypoxia on brainstem and vestibular sys‑ tem. Also, we think that N1P2 interval and P1N1 amplitude markers correlated with AHI value can be used to detect the subclinical negative effect of chronic hypoxia on vestibular nuclei in the brainstem.
Funding Financial support was received from Selçuk University (Pro‑ ject number; 18401106).
Compliance with ethical standards
Conflicts of Interest There is no conflict of interest between all au‑ thors.
Ethics Committee The approval of this study was obtained from the ethics committee of our hospital (2017/368).
References
1. Rosengren SM, Colebatch JG, Young AS, Govender S, Welgam‑ pola MS (2019) Vestibular evoked myogenic potentials in prac‑ tice: methods, pitfalls and clinical applications. Clin Neurophys‑ iol Pract 4:47–68. https ://doi.org/10.1016/j.cnp.2019.01.005 2. Mutlu M, Bayir O, Yuceege MB, Karagoz T, Firat H, Ozdek A,
Akin I, Korkmaz H (2015) Vestibular evoked myogenic poten‑ tial responses in obstructive sleep apnea syndrome. Eur Arch Otorhinolaryngol 272(11):3137–3141. https ://doi.org/10.1007/ s0040 5‑014‑3294‑x
3. De Natale ER, Ginatempo F, Paulus KS, Pes GM, Manca A, Tolu E, Agnetti V, Deriu F (2015) Abnormalities of
vestibular‑evoked myogenic potentials in idiopathic Parkin‑ son’s disease are associated with clinical evidence of brain‑ stem involvement. Neurol Sci 36(6):995–1001. https ://doi. org/10.1007/s1007 2‑014‑2054‑4
4. Di Stadio A, Dipietro L, Ralli M, Greco A, Ricci G, Bernitsas E (2019) The role of vestibular evoked myogenic potentials in multiple sclerosis‑related vertigo. A systematic review of the literature. Mult Scler Relat Disord 28:159–164. https ://doi. org/10.1016/j.msard .2018.12.031
5. Jordan AS, White DP, Fogel RB (2003) Recent advances in understanding the pathogenesis of obstructive sleep apnea. Curr Opin Pulm Med 9(6):459–464
6. Wong AM, Wang M, Garner DJ, Bowditch S, Paul E, Adams MJ, Hamilton GS, Mansfield DR (2019) Obstructive sleep apnoea predicted by the STOP‑BANG questionnaire is not associated with higher rates of post‑operative complications among a high‑risk surgical cohort. Sleep Breath. https ://doi. org/10.1007/s1132 5‑019‑01825 ‑3
7. Xia Y, Fu Y, Xu H, Guan J, Yi H, Yin S (2016) Changes in cer‑ ebral metabolites in obstructive sleep apnea: a systemic review and meta‑analysis. Sci Rep 6:28712. https ://doi.org/10.1038/ srep2 8712
8. Zhou J, Camacho M, Tang X, Kushida CA (2016) A review of neurocognitive function and obstructive sleep apnea with or without daytime sleepiness. Sleep Med 23:99–108. https ://doi. org/10.1016/j.sleep .2016.02.008
9. Guilleminault C, Ramar K (2009) Neurologic aspects of sleep apnea: is obstructive sleep apnea a neurologic disorder? Semin Neurol 29(4):368–371. https ://doi.org/10.1055/s‑0029‑12371 22 10. Chen CH, Young YH (2003) Vestibular evoked myogenic poten‑ tials in brainstem stroke. Laryngoscope 113(6):990–993. https ://doi.org/10.1097/00005 537‑20030 6000‑00014
11. Iber C A‑IS, Chesson L. and Quan SF. (2007) The AASM manual for the scoring of sleep and associated events: rules, terminology, and technical Specifications. 1st edn., Westchester 12. Cohen J (1988) Statistical power analysis for the behavioral
sciences, 2nd edn. Lawrence Earlbaum Associates, Hillsdale 13. Heide G, Luft B, Franke J, Schmidt P, Witte OW, Axer H
(2010) Brainstem representation of vestibular evoked myogenic potentials. Clin Neurophysiol 121(7):1102–1108. https ://doi. org/10.1016/j.clinp h.2010.02.007
14. Casale M, Vesperini E, Potena M, Pappacena M, Bressi F, Bap‑ tista PJ, Salvinelli F (2012) Is obstructive sleep apnea syndrome a risk factor for auditory pathway? Sleep Breath 16(2):413–417. https ://doi.org/10.1007/s1132 5‑011‑0517‑x
15. Zhang JH, Fung SJ, Xi M, Sampogna S, Chase MH (2010) Apnea produces neuronal degeneration in the pons and medulla of guinea pigs. Neurobiol Dis 40(1):251–264. https ://doi. org/10.1016/j.nbd.2010.05.032
16. Canessa N, Castronovo V, Cappa SF, Aloia MS, Marelli S, Falini A, Alemanno F, Ferini‑Strambi L (2011) Obstructive sleep apnea: brain structural changes and neurocognitive func‑ tion before and after treatment. Am J Respir Crit Care Med 183(10):1419–1426. https ://doi.org/10.1164/rccm.20100 5‑0693O C
17. O’Donoghue FJ, Wellard RM, Rochford PD, Dawson A, Barnes M, Ruehland WR, Jackson ML, Howard ME, Pierce RJ, Jackson GD (2012) Magnetic resonance spectroscopy and neurocogni‑ tive dysfunction in obstructive sleep apnea before and after CPAP treatment. Sleep 35(1):41–48. https ://doi.org/10.5665/ sleep .1582
18. Wang W, Su J, Kong D, Pang J, Kang J (2016) Gender, noctur‑ nal hypoxia, and arousal influence brainstem auditory evoked potentials in patients with obstructive sleep apnea. Sleep Breath 20(4):1239–1244. https ://doi.org/10.1007/s1132 5‑016‑1346‑8
19. Fu Q, Wang T, Liang Y, Lin Y, Zhao X, Wan J, Fan S (2019) Auditory deficits in patients with mild and moderate obstructive sleep apnea syndrome: a speech syllable evoked auditory brain‑ stem response study. Clin Exp Otorhinolaryngol 12(1):58–65. https ://doi.org/10.21053 /ceo.2018.00017
Publisher’s Note Springer Nature remains neutral with regard to jurisdictional claims in published maps and institutional affiliations.