KADIR HAS UNIVERSITY
GRADUATE SCHOOL OF SCIENCE AND ENGINEERING
AN ANALYSIS OF DEVELOPMENT INDICATORS FOR TURKEY
BASED ON THE HISTORICAL DEVELOPMENT OF 500 LARGEST
INDUSTRIAL ORGANIZATIONS
GRADUATE THESIS
FERHAN OTNAR
F ERHAN OTN AR M.S . The sis 2015 S tudent’ s F ull Na me P h.D . (or M.S . or M.A .) The sis 20 11
AN ANALYSIS OF DEVELOPMENT INDICATORS FOR TURKEY BASED
ON THE HISTORICAL DEVELOPMENT OF 500 LARGEST INDUSTRIAL
ORGANIZATIONS
FERHAN OTNAR
Submitted to the Graduate School of Science and Engineering In partial fulfillment of the requirements for the degree of
Master of Science In
Industrial Engineering
KADIR HAS UNIVERSITY August 2015
KADIR HAS UNIVERSITY GRADUATE SCHOOL OF SCIENCE AND ENGINEERING
AN ANALYSIS OF DEVELOPMENT INDICATORS FOR TURKEY BASED ON THE HISTORICAL DEVELOPMENT OF 500 LARGEST INDUSTRIAL ORGANIZATIONS
FERHAN OTNAR
APPROVED BY:
Assoc. Prof. Ahmet Yücekaya (Kadir Has University) ________________ (Thesis Supervisor)
Assoc. Prof. Dr. Zeki BOZKUŞ (Kadir Has University) __________________
Asst. Prof. Dr. Emre ÇELEBİ (Kadir Has University) __________________
APPROVAL DATE: 18/08/2015 AP PE ND IX C APPENDIX B APPENDIX B
“I, Ferhan OTNAR, confirm that the work presented in this thesis is my own. Where information has been derived from other sources, I confirm that this has been indicated in the thesis.”
_______________________
i
ABSTRACT
AN ANALYSIS OF DEVELOPMENT INDICATORS FOR TURKEY BASED ON THE HISTORICAL DEVELOPMENT OF 500 LARGEST INDUSTRIAL ORGANIZATIONS
Ferhan OTNAR
Master of Science in Industrial Engineering Advisor: Assoc. Prof. Ahmet Deniz YÜCEKAYA
August, 2015
Economies live rapid changes in terms of size, direction and intention due to globalization, population increase of countries and technological developments. These changes seemed clearer in developing countries because of fast progress and demand increases. Especially in last 10 year period, Turkey gained economical acceleration along with growth and development. Parallel to these developments, diversification in industrial areas and evolvement in remained areas used as an answer. In this aspect, Istanbul Chamber of Industry announced Turkey’s top 500 industrial enterprises each year.
In this study, Turkey’s developing economy was analyzed with ISO Top 500 List for 2002-2012 periods in order to identify vector sectors and economical alteration. According to analysis, changes in industrial effects on Turkey’s economy were investigated.
ii
ÖZET
AN ANALYSIS OF DEVELOPMENT INDICATORS FOR TURKEY BASED ON THE HISTORICAL DEVELOPMENT OF 500 LARGEST INDUSTRIAL ORGANIZATIONS
Ferhan OTNAR
Endüstri Mühendisliği, Yüksek Lisans Danışman: Doç.Dr. Ahmet Deniz YÜCEKAYA
Agustos, 2015
Günümüzde, globalleşme, nüfus artışı ve teknolojik gelişmeler gibi birçok neden ile ekonomiler çok hızlı bir şekilde yön, büyüklük ve hedef değişiklileri yaşayabilmektedirler. Bu değişimler gelişmekte olan ülkelerde, gelişme ve talebin sürekli artması gibi etmenler sebebiyle daha sık ve net olarak gözlemlenebilmektedir. Özellikle son 10 yıldır iktisadi ve ekonomik büyümede çok hızlı ivme kazanan ülkemizde, büyüme ve gelişmeye paralel olarak endüstriyel alanlarda çeşitlendirme ve mevcut alanlarda atılımlar yapılarak ekonomik anlamdaki değişim ve gelişmeye cevap verilmek için çalışılmaktadır. Bu anlamda oluşan değişiklileri
gözlemlemek amacıyla, her yıl İstanbul Sanayii Odası tarafından Türkiye’nin en büyük 500 sanayi şirketi belirlenmekte ve yayınlanmaktadır. Bu çalışmada, gelişmekte olan Türkiye Cumhuriyeti Ekonomisinin 2002-2012 yılları arası ekonomik gelişmeleri ve İstanbul sanayi odası “En büyük 500 sanayi şirketi-İSO500” veri ve listeleri ile beraber incelenip analiz edilerek; Türkiye Cumhuriyeti Ekonomisinin geçmişteki taşıyıcı sektör ve iş kollarını ve de Günümüzde Türkiye ekonomisi için taşıyıcı sektör ve iş kolları belirlenerek, bu anlamda ekonomik değişim ve yönlenme analiz edilerek belirlenmiştir. Yapılan analizler sonucunda yıllar içerisinde Türkiye Cumhuriyeti Ekonomindeki değişimlerin sanayi alanındaki etkileri gözlemlenmiştir.
iii
Table of Contents
ABSTRACT ... i
ÖZET ... ii
Table of Contents ... iii
List of Tables ... vi
List of Figures ... vii
CHAPTER 1 ... 1
INTRODUCTION ... 1
CHAPTER 2 ... 3
LITERATURE REVIEW ... 3
Economy of Turkey ... 3
1.1 General Situation in Turkey from 1980 to Present ... 3
1.2 The Industrialization Model Changing From Import Substitution to Export Orientation ... 4
1.3 Neo-Liberal Transformation in the 1980s ... 7
1.4 24th January 1980 Economic Decisions and the Impacts of the Decisions ... 8
1.5 The 1994 Economic Crisis ... 10
1.6 The Earthquake of the 17th August 1999 ... 11
1.7 The 2000 and 2001 Economic Crisis ... 11
1.8 The 2008 Global Economic Crisis ... 13
CHAPTER 3 ... 14
Analysis of ISO Lists ... 14
1.9 What is ISO Top 500 List ... 14
1.10 Analyze Perspective ... 15
1.11 Turkey’s Economy ... 15
1.11.1 GDP ... 15
1.11.2 GDP Per Capita ... 16
1.11.3 Exports ... 16
1.12 ISO – Turkey’s Top 500 Industrial Enterprises Lists ... 17
1.12.1 Exports and Net Sale Figures ... 17
1.12.1.1 Net Sale Figures ... 17
1.12.1.2 Exports ... 17
1.12.2 Analyze Based on The Criteria ... 18
1.12.2.1 Regional Analysis ... 18 1.12.2.1.1 Mediterranean Region ... 18 AP PE ND IX C APPENDIX B
iv
1.12.2.1.2 Marmara Region ... 19
1.12.2.1.3 Aegean Region ... 20
1.12.2.1.4 Black Sea Region... 20
1.12.2.1.5 Central Anatolia Region ... 21
1.12.2.1.6 Eastern Anatolia Region ... 22
1.12.2.1.7 Southeastern Anatolia Region ... 22
1.12.2.2 Urban Analysis ... 23 1.12.2.2.1 İstanbul ... 23 1.12.2.2.2 Bursa ... 24 1.12.2.2.3 İzmir... 24 1.12.2.2.4 Ankara ... 25 1.12.2.2.5 Gaziantep ... 25 1.12.2.2.6 Denizli ... 26 1.12.2.2.7 Kayseri ... 26 1.12.2.2.8 Trabzon ... 27
1.12.2.3 Analysis According to Sector Code Groups ... 27
1.12.2.3.1 Sector Codes ... 27
1.12.2.3.2 Sectorial Analysis ... 29
1.12.2.3.2.1 Mining and Quarrying-210 ... 29
1.12.2.3.2.2 Manufacture of Food Products-311 ... 29
1.12.2.3.2.3 Manufacture of Food Products Not Elsewhere Classified (NEC)-312 ... 30
1.12.2.3.2.4 Beverage Industries (Alcoholic and Non-alcoholic)-313 ... 31
1.12.2.3.2.5 Manufacture of Tobacco Processing-314 ... 31
1.12.2.3.2.6 Manufacture of Textiles -321 ... 32
1.12.2.3.2.7 Manufacture of Wearing Apparel, Except Footwear -322 ... 32
1.12.2.3.2.8 Tanning and Dressing of Leather; Manufacture of Leather Substitutes-323 ... 33
1.12.2.3.2.9 Manufacture of Footwear-324 ... 33
1.12.2.3.2.10 Manufacture of Wood and Products of Wood and Cork-331 ... 34
1.12.2.3.2.11 Manufacture of Wooden Furniture-322 ... 34
1.12.2.3.2.12 Manufacture of Paper and Paper Products-341 ... 35
1.12.2.3.2.13 Printing and Publishing -342 ... 35
1.12.2.3.2.14 Manufacture of Basic Chemicals-351 ... 36
1.12.2.3.2.15 Manufacture of Other Chemical Products-352 ... 36
1.12.2.3.2.16 Manufacture of Petroleum Products-353 ... 37
1.12.2.3.2.17 Oil and Coal Derivatives-354 ... 37
v
1.12.2.3.2.19 Manufacture of Plastic Products NEC -356 ... 38
1.12.2.3.2.20 Manufacture of Pottery, China, Earthenware and Porcelain-361 39 1.12.2.3.2.21 Manufacture of Glass and Glass Products-362... 39
1.12.2.3.2.22 Manufacture of Other Nonmetallic Mineral Products-369 ... 40
1.12.2.3.2.23 Manufacture of Basic Iron and Steel-371 ... 40
1.12.2.3.2.24 Manufacture of Non-Ferrous Products-372 ... 41
1.12.2.3.2.25 Manufacture of Metal Products-381 ... 41
1.12.2.3.2.26 Manufacture of Machinery, Except Electrical -382 ... 42
1.12.2.3.2.27 Manufacture of Electrical Machinery, Apparatus and Appliances-383 ... 42
1.12.2.3.2.28 Manufacture of Motor Vehicles-384 ... 43
1.12.2.3.2.29 Manufacture of Professional, Scientific and Medical Instruments and Equipment-385 ... 43
1.12.2.3.2.30 Other Manufacturing-390 ... 44
1.12.2.3.2.31 Power Production and Distribution-400 ... 44
1.12.2.4 Analysis According to Asset Distributions ... 45
1.12.2.4.1 Public Companies (100% Capital) ... 45
1.12.2.4.2 Private Companies (100% Capital) ... 45
1.12.2.4.3 Foreign Companies (100% Capital) ... 46
1.12.2.4.4 Public and Private Companies (Capital) ... 47
1.12.2.4.5 Private and Foreign Companies (Capital) ... 47
CHAPTER 4 ... 48
CONCLUSİON ... 48
References ... 55
Curriculum Vitae ... 57
vi
List of Tables
Table 4-1 Sector Codes ... 28
Table 5-1 Regions chart ... 48
Table 5-2 Cities chart ... 49
Table 5-3 Positive sectors chart ... 50
Table 5-4 Negative sectors chart ... 51
Table 5-5 Asset Based chart ... 52
AP PE ND IX C
vii
List of Figures
Figure 4-1 GDP Per Capita ... 16
Figure 4-2 Exports ... 16
Figure 4-3 Production Based Sales ... 17
Figure 4-4 Export Sales ... 18
Figure 4-5 Mediterranean Region ... 19
Figure 4-6 Marmara Region ... 19
Figure 4-7 Aegean Region ... 20
Figure 4-8 Black Sea Region ... 21
Figure 4-9 Central Anatolia Region ... 21
Figure 4-10 Eastern Anatolia Region ... 22
Figure 4-11 Southeastern Anatolia Region ... 23
Figure 4-12 İstanbul ... 23 Figure 4-13 Bursa ... 24 Figure 4-14 İzmir ... 24 Figure 4-15 Ankara ... 25 Figure 4-16 Gaziantep ... 25 Figure 4-17 Denizli ... 26 Figure 4-18 Kayseri ... 26 Figure 4-19 Trabzon ... 27
Figure 4-20 Mining and Quarrying-210 ... 29
Figure 4-21 Manufacture of Food Products-311 ... 30
Figure 4-22 Manufacture of Food Products Not Elsewhere Classified (NEC)-312 ... 30
Figure 4-23 Beverage Industries (Alcoholic and Non-alcoholic)-313 ... 31
Figure 4-24 Manufacture of Tobacco Processing-314 ... 31
Figure 4-25 Manufacture of Textiles -321 ... 32
Figure 4-26 Manufacture of Wearing Apparel, Except Footwear -322 ... 32
Figure 4-27 Tanning and Dressing of Leather; Manufacture of Leather Substitutes-323 ... 33
Figure 4-28 Manufacture of Footwear-324 ... 33
Figure 4-29 Manufacture of Wood and Products of Wood and Cork-331 ... 34
Figure 4-30 Manufacture of Wooden Furniture-322 ... 34
Figure 4-31 Manufacture of Paper and Paper Products-341 ... 35
Figure 4-32 Printing and Publishing -342 ... 35
Figure 4-33 Manufacture of Basic Chemicals-351 ... 36
Figure 4-34 Manufacture of Other Chemical Products-352 ... 36
Figure 4-35 Manufacture of Petroleum Products-353 ... 37
Figure 4-36 Oil and Coal Derivatives-354 ... 37
Figure 4-37 Manufacture of Rubber Goods-355 ... 38
Figure 4-38 Manufacture of Plastic Products NEC -356 ... 38
Figure 4-39 Manufacture of Pottery, China, Earthenware and Porcelain-361 ... 39
Figure 4-40 Manufacture of Glass and Glass Products-362 ... 39
Figure 4-41 Manufacture of Other Nonmetallic Mineral Products-369 ... 40
Figure 4-42 Manufacture of Basic Iron and Steel-371 ... 40
Figure 4-43 Manufacture of Non-Ferrous Products-372 ... 41
Figure 4-44 Manufacture of Metal Products-381 ... 41
Figure 4-45 Manufacture of Machinery, Except Electrical -382 ... 42
Figure 4-46 Manufacture of Electrical Machinery, Apparatus and Appliances-383 ... 42
Figure 4-47 Manufacture of Motor Vehicles-384 ... 43
AP PE ND IX C
viii
Figure 4-48 Manufacture of Professional, Scientific and Medical Instruments and
Equipment-385 ... 43
Figure 4-49 Other Manufacturing-390 ... 44
Figure 4-50 Power Production and Distribution-400 ... 44
Figure 4-51 Public Companies (100% Capital) ... 45
Figure 4-52 Private Companies (100% Capital) ... 46
Figure 4-53 Foreign Companies (100% Capital) ... 46
Figure 4-53 Public and Private Companies (Capital) ... 47
Figure 4-55 Private and Foreign Companies (Capital) ... 47
Figure 5-1 Regional Analysis ... 48
Figure 5-2 Urban Analysis ... 49
Figure 5-3 Sectorial Analysis (+) ... 50
Figure 5-4 Sectorial Analysis (-) ... 51
Figure 5-5 Asset Based Analysis ... 52
Figure 5-6 Growth Rate (2002-2012)………….………..………53
AP PE ND IX C
1
CHAPTER 1
INTRODUCTION
Fast developed economies live rapid changes in terms of size, direction and intention due to globalization, population increase of countries and technological developments. In last 10 year period, Turkey gained economical acceleration along with growth and development. The period beginning with the year 2002 has completely different characteristics than any other time interval during the Republics history in terms of economic policies and achievements. During this period, Turkey went through significant changes in economic life and habits, and achieved tremendous success in economic terms. There are two important landmarks to be mentioned that triggered the initiation of radical changes in economic policies. The first one is the process of Turkey’s membership to the EU, which officially began in 1999 with the approval of Turkey’s candidate status by the European Council. This process introduced significant obligations to Turkey in aligning many aspects of not only economic, but also social, cultural, political life and judicial system with the EU Acquisition. The second one is the 2001 crisis which caused an economic ruin and made a new approach in economic policies inevitable. After the 2001 crisis, Turkey initiated a new “Structural Reform and Stability Program in accordance with the Stand-by Agreement signed with the IMF. This program was based on comprehensively analyzing the problems and defects of the economy, determining the necessary policies to cure them, adopting the best practices of other countries that went through the same processes and implementing them decisively. In other words, as an urgent necessity, Turkey aimed at establishing macroeconomic stability and confidence both inside the country and abroad among international authorities, institutions and investors.
2
As a result, from 2002 to 2012, national income nearly tripled, income per capita more than doubled, annual average growth rate reached such levels that envied many of the other countries considered in the same category as Turkey, inflation was reduced to one-digit levels after a 30-year period of chronically high inflation rates, public debt burden is reduced remarkably and budget deficit/GDP ratio was pulled down to nearly 0.
Parallel to these developments, diversification in industrial areas and evolvement in remained areas used as an answer. In this aspect, Istanbul Chamber of Industry announced Turkey’s top 500 industrial enterprises each year.
The main objective of this thesis is to identify and investigate Turkey’s economy’s new direction, old- new and vector mover sectors and economical variance by analyzing top 500 enterprises for 2002-2012 period
In this study, Turkey’s developing economy was analyzed with ISO Top 500 List for 2002-2012 periods in order to identify vector sectors and economical variance. According to analysis, changes in industrial effects on Turkey’s economy were investigated.
3
CHAPTER 2
LITERATURE REVIEW
Economy of Turkey
2.1 General Situation in Turkey from 1980 to Present
Turkey is located in a strategically significant area, in Anatolian Peninsula, where three continents consisting of Asia, Europe and Africa are closest to each other, It acts as a bridge connecting East and West Geopolitical position of Turkey vitally affects its economy, politics and internal and external strategies of governments and vice versa. In the aftermath of the three crucial coup d'etats (military interventions) (respectively on 27'h May 1960, 12'h March 1971, and 121 September 1980), not only the political situation but also the economy of the country needed to be recovered immediately. Each coup d'etat took the country to 10 years back from the year of occurring in the sense of political, economic and legal developments. With the help of new governments' policies (e.g industrialization and neoliberalization (transformation of liberalism into neo-liberalism) after 1980), endeavors and the legal developments, the country started to overcome the destructive effects of the coup d'etats and the commercial, economic, political, and legal recession that they caused. After all these years, the aspiration and eagerness of Turkey to become a member of the EU (European Union) have brought about some other kinds of changes. The first set of changes includes the ones that Turkey has launched voluntarily to convince the EU that the country is eligible to join the EU. The second set consists of the changes that the EU asked Turkey to launch such
4
as changes in some of the constitution (which has been in force since 1982) items and laws in favor of the social, labor, health and safety, etc. rights of the citizens. Both sets are sorts of steps taken on the way to democratization, liberalization, and development.
ln addition to all these components, outstanding increases in inflation rates in 1984-1986, 1988-1989, 1994-1996, 1998 (Keskek and Orhan, 2010), in 2000- 2001 (Political Risk Services, 2010) in 2008 (The Economist Intelligence Unit, 2010), and the noticeable decrease in Gross Domestic Product (GDP) in years 1991 , 1994, 1 997, 1999 compared to the previous decade (Baser el al, 2003), in 2001 and in 2008-2009 (Business Monitor International, 2011) could be interpreted as a sign of the negative correlation between the inflation rates and GDP in Turkey (Turban, 2007). Moreover, significantly high unemployment rates and interest rates are the other factors which affect the country's economic growth.
All of these are the indicators of the fact that not only the macroeconomic factors themselves but also their relationships with each other and with the socio economic, legal, social, and political parameters have a significant impact on the economic performance of Turkey.
2.2 The Industrialization Model Changing From Import Substitution to Export Orientation
Sacik (2009) notes that the industrialization model that was adopted in Turkey from the 1960s on wards was 'import substitution industrialization'. The logic of the import substitution industrialization model was that the country was goi.ng to produce the goods which they normally imported from other countries. That was strongly believed to help the country decrease the level of dependency on the goods and products of other countries. Therefore, Turkey would be the determining factor in its internal economy. It would also gain the country the feeling of more self-sufficiency and self-confidence which would also
5
influence the future independency steps in a positive way. Yasar (2010) notes that the goods that were produced internally were mainly 'consumer durable goods' including refrigerators, televisions, radios, vacuum cleaners, ovens, washing machines, etc. during the process of the implementation of the model.
Egeli (2001) states that the import substitution industrialization model also aimed to prevent the Turkish economy from being negatively influenced by the more powerful and more dominant external and/or international economics by means of the amendments in the external trade policies and exchange rate policies. Because of this reason, the governments enforced and followed stricter implementations. They increased the level of customs duties on imported goods, set down quotas in order to restrict the importation, and even prohibitions on some of the most imported goods. There are two phases of the import substitution industrialization model. The first one rests upon the limitations on and the domestic production of the consumer goods. The second phase is based on the internal production of the intermediate and the investment goods.
Sacik (2009) argues that in spite of the fact that the import substitution industrialization model brought about various kinds of improvements and advantages for the economic growth process of Turkey, it also caused some problems in the economy which have been criticized by a number of authorities and academicians who work in the field of economics. The model stated above provided the country with a certain level of industrialization as aimed in the beginning. It. also brought about some new areas of employment and caused an increase in foreign exchange savings. On the other hand, the model was criticized to have made way for irrational use of the resources, more dependency on the other countries (because of the raw material needs for the internal production), and 'distm1cd' industrialization.
From the 1980s onwards the government started following export-oriented growth model Egeli (2001) postulates that in this type of industrialization strategy, the countries put more emphasis on not all the industrial goods but the ones in which the country has a comparative
6
advantage. This is the reason why the governments focus on incentivizing the industries which are believed to have the potential to grow rapidly, providing these industries with subsidies, and therefore reaping the benefits of these endeavors in time. The raw materials which are required for the production of the goods that are intended and planned to be exported must be provided from both the internal and external suppliers. The same thing was essential for the previous model (the import substitution industrialization model). This is the best possible way to prevent the country from being dependent on either of them.
Because of the requirements of this model, the whole point of view of the governments has changed. The government then, launched some new economy policies and enforced some kind of different regulations. Bilgin and Sahbaz (2009) note that this time, the main aim was to focus on exportation of goods that arc produced within the borders of the country and therefore to increase the income, level of welfare, and the level of development of the economy of the country. The increase in the level of exportation makes a contribution to the total factor productivity. This is another reason why the governments adopted that model of industrialization and economic growth.
Gene et al (2009) postulate that the implementation of the export-oriented industrialization model that has been in force since 1980 caused a rapid increase in exportation and a change in the nature and the characteristics of the goods that were imported from different countries in the world. Before the implementation of the export-oriented industrialization strategy, the goods mainly exported by Turkey were the textile products and/or the products of clothing industry. After the new industrialization model was launched, the focal point of the goods and/or products that Turkey has been exported has changed. The country was then exporting motor vehicles and equipment that entail high level of technology. The increase in the level of exportation brought about the need for human capital and the effectiveness of the human capital is likely to make a contribution to the exportation in turn.
7
2.3 Neo-Liberal Transformation in the 1980s
Romer (2003) argues that almost all of the countries all over the world were badly affected in the aftermath of the Great Depression ('The Wall Street Crash' in 1929). The governments in most of these countries started to take place in the economic stage more than before. In the mid-1930s, the governments’ have been under the influence of the Keynesian economic policies. They believed that the interference of the governments in the economic issues might help them recover more rapidly and easily. The role and the importance of the 'macroeconomic policies' in the economic decisions and implementations have also changed by the impacts of the depression.
Sener (2004) postulates that with the influences of the rapid changes in the modern world after the oil crises, the trends of globalization, and the rapid movements of the money capital across the countries, the internationalization of the capital, and the rising global competitive powers became widespread during the 1970s. In this decade, the seeds of the neo-liberal transformation processes have been sowed. The effects of the Keynesian economic policies have been faded away with the pervasiveness of the neo-liberal policies all over the world starting from the most developed Western countries and moving towards the developing countries and finally, towards the underdeveloped countries.
Sener (2004) discusses that the neo-liberalism process has brought about the 'structural adjustment programs' enforced by the international institutions (under the leadership of the International Monetary Fund and the World Bank). These programs stated above entailed a mitigation of the role of social state and also the withdrawal of the governments from the economic activities, plans, strategies, and/or the programmers. The new strategies and/or policies which came into force with the neo-liberalism process also caused an increase in the importance of the private sector and investments. The mobility of the financial capital gained
8
significance. The notion of 'laissez-faire economics' became more and more popular and 'creditable' in the globalized world.
Onis (2004) postulates that Turgut Ozal, the prime minister of that time, was the leading factor of the neo-liberal transformation process of the country. He had been a very dominant character in the political and economic history of Turkey. During the process of recovering a tier the negative influences of the 1970s crises, the 'structural adjustment program’s that had been enforced by the powerful international organizations played a significant role in the economic strategies and the performance of the country. There were two main problems in his way of implementing the economic strategies. First, Turgut Ozal played down the significance of the legislative framework; second, he did not pay much attention to the necessity of laws that should have been enacted before the implementation and/or the enforcement of the economic policies, programs and/or the strategies.
According to Onis (2004) Turgut Ozal passed over a large number of rules and regulations that were officially required in the case of passing a law or making an economic decision. In spite of the fact that, this method or way of doing things enabled him to make faster decisions and to implement them more rapidly than it would he if it was done the normal way. On the other hand, having violated the required and formal procedures brought about some other kinds of problems in the future of these economic policies and/or strategies. Onis (2004) epitomizes this case by the entrepreneurs and/or the investors who abused the government incentives for exportation during the 1980s and the general deterioration in the economic system and the atmosphere of the country.
2.4 24th January 1980 Economic Decisions and the Impacts of the Decisions
Sezen (2002) postulates that the Turkish governments had been interfering in the economic processes of the country as an active player during the 1960s. They were having five-year
9
development plans prepared and having them implemented on the economic system. The economy was planned and organized by the state and was kept under the total control of the state. The state-controlled enterprises and/or institutions had set the main point of the economic life. The state controlled enterprises and/or institutions had been being operated in coordination with the implementation of the (again state-controlled) five-year development plans.
Sezen (2002) also notes that the 24th January 1980 is a significant date in both the political and economic life and the future of the country, The 24th January 1980 Decisions have also been the corner stone of the neo-liberal transformation processes in the economy of country starting from the 1980s. The 24thJanuary Decisions have changed all the economic processes, systems, and strategies that had been in force until that time. This time, the 'outward-oriented growth and development' model was adopted. The model was going to be followed in line with the 'export-oriented industrialization model', According to the new model that was adopted, taking pat1 in the international and global trading activities and an economic growth target which had been based on the exportation were going to be the two most significant notions.
According to Altunisik and Tur (2005), the Turkish Lira (TRY) was devaluated by 32.7% against the United States Dollar (USD). The reason of having done the devaluation was that the government was planning to trigger the exportation activities and increase the level of export. The governments also aimed to keep the inflation movements under control and to obtain a steady and sustainable economic growth in Turkey by means of the 24th January 1980 Decisions. In addition to all these, they have reduced the level of the state involvement in the economic life of the country,
Altunisik and Tur (2005) also discusses that the role of the state-controlled enterprises has lost its importance in the sense of new economic policies and/or strategies. They have started to sell out the state-controlled enterprises to the private sector players. The government
10
subsidies and incentives on the products under the control of the public sector have been faded away. The private sector has become the main focus of the economic performance. This time, the governments have launched new strategies in order to incentivize and attract both the internal external investors and/or the entrepreneurs. The doors of the Turkish market. have been opened to the international and/or global trading and investment powers.
2.5 The 1994 Economic Crisis
Kazgan (2002) postulates that the economic crisis that sprang up in Mexico in 1994 and its impact on Brazil and Argentina caused the crisis to spread in these countries as well. After the crises, the national currencies of these countries and Chinese Yuan have been devaluated. All these reasons caused the 'capital' to stay away from these countries. Turkey has accepted and implemented the policies that the United States of America, IMF (International Monetary Fund), and the WB (World Bank) have put forward. The main reason why Turkey accepted to implement these policies was that the government needed to get some credit from the international institutions stated above. Some of these policies and/or strategies have had a political aspect and some had economic.
According to Altay and Celebioglu (2005), the real economic system had not been steady or had not been grounded on strong and/or stable bases before 1994. The competitive capacity and/or power of the businesses had not reached to the level of the powerful and successful businesses (operating in different regions and/or parts of the world) in the production processes. The trade balance deficit had been undergoing a significant and rapid increase. All these factors arc the reasons and/or causes of the impossibility of a steady, enduring, and/or sustainable economic growth process in the country. 'The trade balance deficit reached to the highest level (since 1923 - the foundation of the Republic of Turkey) in 1993. It reached to 8.5 times of the same period of the previous year.
11
2.6 The Earthquake of the 17th August 1999
Devlet Planlama Teskilati Mustesarligi (1999) states that the earthquake of the 17thAugust 1999 badly affected the most efficient and significant industrial areas in the country - including the cities Istanbul, lzmit, Sakarya, and Yalova. At the time of the earthquake, the 23% of the entire population used to live in the cities which had been badly affected by this natural disaster. The percentage of the seven cities that have been affected by the earthquake in gross national product was 34.7%. The three cities (lzmit, Sakarya, and Yalova) that have been affected at the top level had the 6.3% of the gross national product. The area has a significant importance in the motor vehicle, petroleum chemicals, petroleum refining, textile raw material, and main metal industries.
Devlet Planlama Teskilati Mustesarligi (1999) also notes that the earthquake of the 171h August 1999 has caused a lot of other damages and losses apart from the loss of lives of people who lived in these areas. A great number of blocks of Bats, houses, commercial and/or industrial buildings, roads and highways, bridges, all other sorts of substructure in the given cities (the ones that have been stated above), public transport vehicles, machines and equipment, and the stocks of finished and semi-finished goods have been seriously damaged and/or have become non-functional The earthquake has also caused serious and long-term damages in the economy of the country.
2.7 The 2000 and 2001 Economic Crisis
Kazgan (2002) postulates that the neo-liberal strategies and/or policies which have been the requirements of the globalization and internationalization processes (and have been in force especially from the 1990s onward) brought about the economic crises in Turkey in early 2000s. The process of transition to free market economy (in the sense of both goods and
12
services) as a requirement of the neo-liberal transformation has made the similar effects as it has made in Latin American countries. In spite the fact that the transition process to free market economy helped the country increase the level of the economic growth. it also caused a number of economic crises. The increase both in the internal (domestic) and external (foreign) debts triggered an increase in the vulnerability of the financial system.
Kazgan (2002) notes that an economic crisis sprang up in Argentina in 2001. The September 11 incident that happened in the United States of America followed the crisis in Argentina. A high level of corruption in the American economy and decrease in the value of shares were the two major effects of these incidents and crises. All these crises and incidents brought about the recession in the economy of the United States of America. After all the globalization, neo-liberal transformation) transition to free market economy) and integration with the external (foreign) and/or international markets processes have been undergone, the last incidents caused Turkey to be affected by them on a large scale an in a negative way. According to Kazgan (2002), Turkey accepted and applied the common customs tariff and opened its market to the other countries that European Union has signed concessional trade agreements. On the other hand, these countries that have signed the agreements with the European Union did not respond in the same way or even in a similar way. That issue badly affected Turkey's economic performance and/or attractiveness in the global and/or international markets. All those factors have also caused a recession in the export growth of the country. The economic crises that sprang in the last (the fourth) quarter of the year 2000 has partially been caused by these incidents and it continued for a quite long period of time.
13
2.8 The 2008 Global Economic Crisis
Yildirim (2010) discusses that the last global economic crisis sprung up in the United States of America in August 2007. After that, the global economic crisis spread to the other countries in different regions and/or parts of the world.
Therefore the global economic crisis that sprung up in the United States of America has also had some negative effects on the economic system and/or structure and the economic growth process in Turkey. The 2008 global economic crisis has not only affected and caused damages in the underdeveloped and/or developing countries but also in the developed and powerful countries (in the sense of economic power).
According to Yildirim (2010), the 2008 global economic crisis has caused a significant and rapid decrease in the economic growth rates in different countries from different regions and/or parts of the world, including Turkey. The economic crisis has also caused a remarkable increase in the unemployment rates of underdeveloped, developing, and developed countries. The economic crisis has caused an outstanding damaging effect on the macroeconomic indicators and/or determinants which play a significant role on the economic performance and/or growth of countries. The macroeconomic equilibrium of the countries has faced the instability and fluctuation problem.
14
CHAPTER 3
Analysis of ISO Lists
3.1 What is ISO Top 500 List
Istanbul Chamber of Industry studies to identify top 500 enterprises of country each year since 1968. This study is just like a mirror for Turkey’s economy. Selected enterprises are from industrial sector. All firms are ordered according to their sales from production and first 500 of them are announced. Also this study includes some reports which prepared by evaluating enterprises’ total sales, gross added value, equity, net asset, period income / outcome before tax, exports, number of employee, etc.
Last report was announced at 24.06.2014 for previous year’s top 500 enterprises. According to the data made public Tüpraş has topped industry once again with a sales-from-production figured of 39 bn 729 million TRY. Turkey’s top 500 enterprises have increased their net sales to 454 bn 900 million TRY with an increase of 7,4% from 2012.
With the majority of the biggest companies in petrochemicals, automotive, and steel and iron sectors, Ford Automotive has ranked the second in the study with its sales-from-production worth of 9 bn 714 million TRY where with a sales-from-production of 9 bn 263 million TRY EÜAŞ (Electricity Generation Inc.) has ranked the third.
The study has revealed that the companies’ debt and equity ratio has seen the apex of the last ten years in 2013, increasing, accordingly, by some 20,4 pts up to 132,4. This increase in a rate that is around 70s in developed countries was induced by the deceleration in profitability and the possibility of creating equities as well as long-term borrowing resources and the devaluation of the TRY (ISO, 2014).
15
3.2 Analyze Perspective
Main purpose of this study is identify Turkey’s economy’s new direction, old and new mover sectors by analyzing top 500 enterprises for 2002-2012 period. This analyze has two parts. In first part, evolution of Turkey’s economy was evaluated on general perspective. In the second part, ISO lists were analyzed for 10 year period (2002-2012).
3.3 Turkey’s Economy
In this section growth figures, GDP changes and general indicators of Turkey’s economy will be analyzed. All data were obtained from TUİK, T.C. Ministry of Economic Affairs, OECD and IMF reports.
3.3.1 GDP
In Turkey, first national income measurement were started in 1928 and arranged again in 1968 according to System of National Accounts-1968 System of UN. Last update was in 2008 and realized according to European Calculation System-1995. New base date changed to 1998 and growth rate was taken as 4.7% for previous years.
Examining net growth rates which calculated according to production method, GDP were decreased by 3,4% in 1999. Main reasons of this decrease were two big earthquakes and negative economic atmosphere. In 2000, 6,8% of increase and next year 5,7% of decrease realized. 2001 banking crisis was the main reason of this figure. Global financial crisis also affect Turkey’s economy within these years. In 2010 and 2011, growth rates were increased. Average GDP growth is 3,88% between 1999 and 2012. There is an increasing trend at all.
16
3.3.2 GDP Per Capita
GDP per capita figures has an increasing trend in 2002-2008 period. Growth rate is 298,92% and 2008 figure is 10.438 USD. There is a small decreasing figure in 2008 because of global financial crisis but trend turn to increase in 2009 again. GDP per capita is 10.504 USD in 2012.
Figure 4-1 GDP Per Capita
3.3.3 Exports
According to TUİK figures export figure is 31.334.216 USD in 2002 and has a steady increasing trend from 2002 to 2008. Like the other indicators, exports was affected from global crisis in 2008 and rate decreased by 22.68% in 2008. After the crisis trend changed again in 2009 and 2012 figure is 152.461.736.556 USD.
17
3.4 ISO – Turkey’s Top 500 Industrial Enterprises Lists
In this section, ISO – Turkey’s Top 500 Industrial Enterprises Lists were analyzed as two parts. In first part, general indicators, exports and net sale figures were examined. In the following section some criteria such as geographic regions, cities, sectorial codes and capital distributions were determinate and analyzed. Results were supported by graphics.
3.4.1 Exportsand Net Sale Figures
3.4.1.1 Net Sale Figures
When evaluating first 500 enterprises’ net sale figures on yearly base it is seemed that they have a parallel trend with Turkey’s growth rates. There is an increasing trend in 2002-2008. Because of global financial crisis, a volatile trend was observed in 2008.
Figure 4-3 Production Based Sales
3.4.1.2 Exports
Total export figure of first 500 enterprises’ of Turkey was 17.375.819 USD in 2002. Growth rate was realized as 389.71% in 2002-2008 and export figure reached 67.715.905 USD in total. In 2008, exports were decreased by 31.73% because of the global crisis but in 2009 trend turned to increase again. In 2012, total export figure of first 500 enterprises’ of Turkey was 63.712.230 USD.
18
Figure 4-4 Export Sales
3.4.2 Analyze Based on The Criteria
3.4.2.1 Regional Analysis
Turkey has seven geographic regions which alike according to natural, humanity and economic aspects within their borders. These regions are Aegean, Black Sea, Central Anatolia, Eastern Anatolia, Marmara, Mediterranean, and South Eastern Anatolia. Each of them has different characteristics and potential such as transportation, workforce, political factors and terrorism.
3.4.2.1.1 Mediterranean Region
Mediterranean region is on the south of Turkey near the Mediterranean Sea and has marine transport opportunities. Tourism sector is developed in the region. In 2002, Mediterranean Region has 5,8% share with 29 firms in top 500 list. Region has a stable trend in 2002-2009 but firm number up to 30 in 2009 and its share was increased by 6%. Increasing trend was remained in 2012 and share increased by 7.8% with 39 firm. Total change is 0.8364 in terms of share in 2002-2012.
19
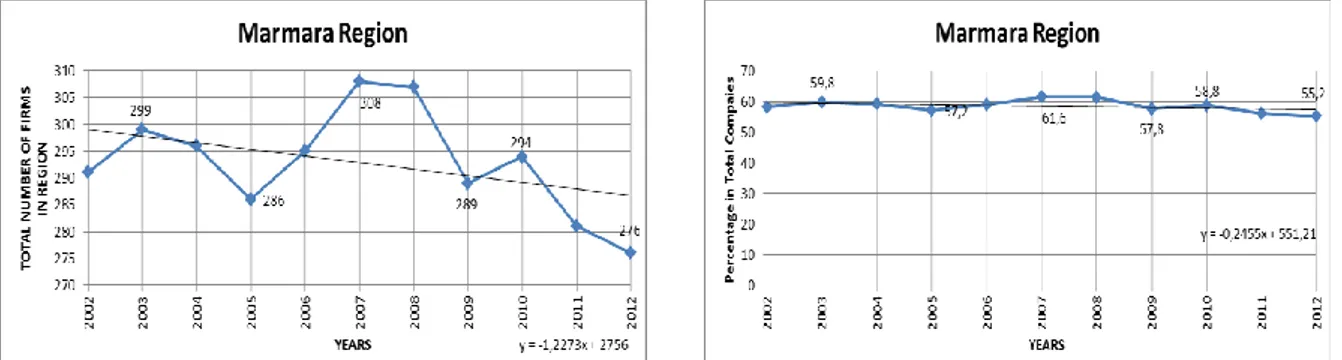
Figure 4-5 Mediterranean Region 3.4.2.1.2 Marmara Region
Marmara is a northwestern region of Turkey near the Marmara, Black and Aegean Seas. It is the most crowded region of country. Transportation opportunities are very developed. In 2002, this region has 58.2% share with 291 firms in ISO top 500 list. Region has an increasing trend in 2002-2005 but firm number up to 308 in 2007 and its share was increased by 61.6%. Increasing trend was changed in 2008 and share decreased by 57.8% with 289 firm. Total change is 0.8364 in terms of share in 2002-2012. Decreasing trend was remained in 2012 and the region has 55.2% share with 276 firms. In general, region has a decreasing trend (slope:-1.2273) in terms of firm number in 2002-2012.
20 3.4.2.1.3 Aegean Region
Aegean Region is on the west side of Turkey near Aegean Sea and has marine transport opportunities. According to analysis, in 2002, this region has 13.6% share with 68 firms in ISO top 500 list. Region has a stable trend in 2002-2007 but firm number down to 56 in 2007 and its share was increased by 11,2%. Stable trend was remained in 2012 and the region has the same share with 2002. In general, region has a decreasing trend (slope:-1.2273) in terms of firm number in 2002-2012. Even it has a decreasing trend in 2010-2012 at all.
Figure 4-7 Aegean Region
3.4.2.1.4 Black Sea Region
Black Sea Region is on the north of Turkey near Black Sea and has marine transport opportunities. According to ISO list analysis, in 2002, this region has 3.4% share with 17 firms. Region has an increasing trend in 2002-2005 but firm number down to 20 in 2008 and its share was increased by 4%. Trend changed in 2008 and the region has 5.2% share with 26 firms in 2012. In general, region has an increasing trend (slope: 0,5545) in terms of firm number in 2002-2012. Even it has a volatile trend in 2010-2012 at all.
21
Figure 4-8 Black Sea Region
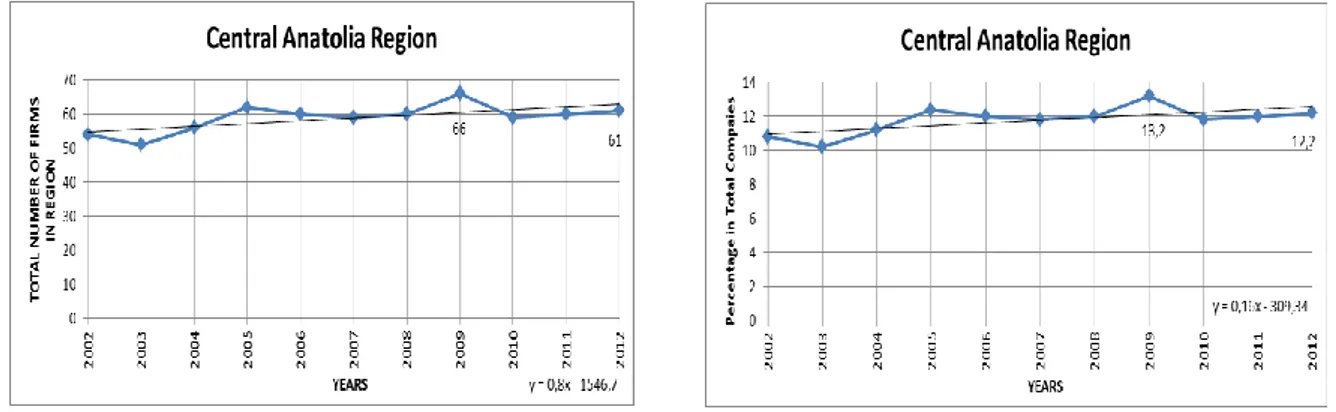
3.4.2.1.5 Central Anatolia Region
Central Anatolia Region is in the middle of Turkey has many transport opportunities except marine transport. Ankara, capital of Turkey is located in this region. According to ISO list analysis, in 2002, this region has 10.8% share with 54 firms. Region has a volatile trend in 2002-2009 but firm number up to 66 in 2009 and its share was increased by 13.2%. In 2012 the region has 12.2% share with 61 firms. In general, region has an increasing trend (slope:0,8) in terms of firm number in 2002-2012.
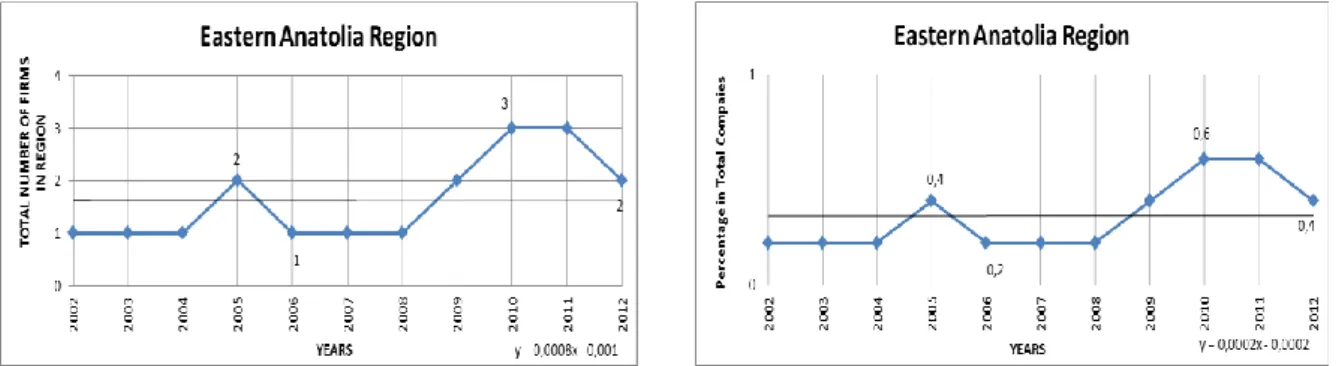
22 3.4.2.1.6 Eastern Anatolia Region
Eastern Anatolia Region is in east side of Turkey has the biggest area. Terrorism affect region’s potential negatively in many ways. According to ISO list analysis, in 2002, this region has 0.2% share with only one firm. Region has a stable trend in 2002-2010 but firm number up to 3 in 2010 and its share was increased by 0,6%. In 2012 the region has 0.42% share with 2 firms. In general, region has an increasing trend (slope:0,0008) in terms of firm number in 2002-2012. Even it has a volatile trend in 2010-2012 at all.
Figure 4-10 Eastern Anatolia Region 3.4.2.1.7 Southeastern Anatolia Region
Southeastern Anatolia Region is in southeast side of Turkey with different transportation opportunities. According to analysis, in 2002, this region has 2% share with 10 firms in ISO top 500 list. Region has a volatile trend in 2002-2008 but firm number up to 12 in 2008 and its share was increased by 2.2%. In 2012 the region has 5% share with 25 firms. In general, region has an increasing trend (slope:1,3364) in terms of firm number in 2002-2012. Even it has a volatile trend in 2010-2012 at all.
23
Figure 4-11 Southeastern Anatolia Region
3.4.2.2 Urban Analysis
In this section 8 cities are selected according to their size and potential and analyzed. Relatively bigger and important cities were preferred.
3.4.2.2.1 İstanbul
İstanbul is in Marmara region of Turkey. It is the most crowded and important city of country in terms of economic and cultural aspects. Transportation opportunities and industry are very developed due to its strategic location. In 2002, İstanbul has 45% share with 225 firms in ISO top 500 list. City has a volatile trend in 2002-2009 but firm number down to 198 in 2012 and its share was decreased by 39.6%. In general, city has a decreasing trend (slope:- 2,6273) in terms of firm number in 2002-2012.
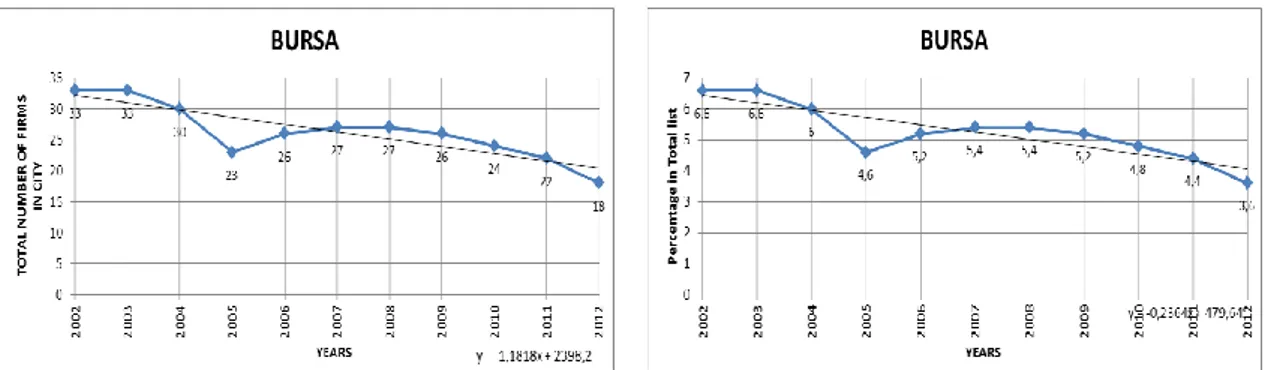
24 3.4.2.2.2 Bursa
Bursa is in Marmara region of Turkey. It is the fourth most crowded city of country. In 2002, Bursa has 6.6% share with 33 firms in ISO top 500 list. City has a decreasing trend in 2002-2005 but firm number down to 23 in 2002-2005 and its share was decreased by 4.6%. In 2012 the region has 3.6% share with 18 firms. In general, region has a decreasing trend (slope:-1,1818) in terms of firm number in 2002-2012.
Figure 4-13 Bursa 3.4.2.2.3 İzmir
İzmir is in Aegean region of Turkey. It is the third most crowded city of country with an important exhibition center. In 2002, İzmir has 9.2% share with 46 firms in ISO top 500 list. City has a stable trend in 2002-2005 but firm number down to 33 in 2012 and its share was decreased by 6.6%. In general, region has a decreasing trend (slope:-1,7545) in terms of firm number in 2002-2012.
25 3.4.2.2.4 Ankara
Ankara is the capital city and in Central Anatolia region of Turkey. Transportation opportunities are highly developed. In 2002, Ankara has 4.8% share with 24 firms in ISO top 500 list. City has a volatile trend in 2002-2005 but firm number up to 29 in 2005 and its share was increased by 5.8%. In 2012 the region has 5.4% share with 27 firms. In general, region has an increasing trend (slope:0,4545) in terms of firm number in 2002-2012.
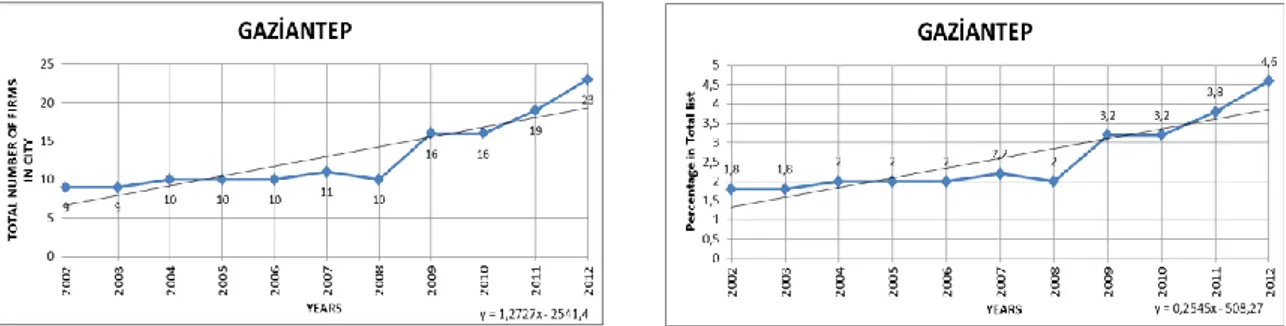
Figure 4-15 Ankara 3.4.2.2.5 Gaziantep
Gaziantep is in Southeastern region of Turkey. It is the sixth most crowded city of country. City located near the Syrian border. In 2002, Gaziantep has 1.8% share with 9 firms in ISO top 500 list. City has a volatile trend in 2002-2008 but firm number up to 10 in 2008 and its share was increased by 2%. In 2012 the region has 4.6% share with 23 firms. In general, region has an increasing trend (slope:1,2727) in terms of firm number in 2002-2012.
26 3.4.2.2.6 Denizli
Denizli is in Aegean region of Turkey. It is the third most crowded city of Aegean region. In 2002, Denizli has 2.6% share with 13 firms in ISO top 500 list. City has a stable trend in 2002-2005 but firm number down to 10 in 2012 and its share was decreased by 2%. In general, region has a decreasing trend (slope:-0,2182) in terms of firm number in 2002-2012.
Figure 4-17 Denizli 3.4.2.2.7 Kayseri
Kayseri is in Central Anatolia region of Turkey. It is the second most crowded city and industry center of Central Anatolia region. In 2002-2003 and 2004, Kayseri has 8.8% share with 14 firms in ISO top 500 list. City has a volatile trend in 2002-2009 but firm number down to 12 in 2012 and its share was decreased by 2.4%. In general, region has a decreasing trend (slope:-0,3091) in terms of firm number in 2002-2012.
27 3.4.2.2.8 Trabzon
Trabzon is in Black Sea Region of Turkey with developed marine transport opportunities. In 2002 and 2003, Trabzon has 0.2% share with only one firm in ISO top 500 list. City has a volatile trend in 2002-2012 but firm number up to 3 in 2012 and its share was increased by 0.6%. In general, region has an increasing trend (slope:0,0636) in terms of firm number in 2002-2012.
Figure 4-19 Trabzon
3.4.2.3 Analysis According to Sector Code Groups
In this section sectors which are coded according to UN ISIC Rev.2 system were analyzed. Analyze has two parts. In first part, sector code related information was summarized and detailed analysis showed in the following part.
3.4.2.3.1 Sector Codes
ISIC Rev. 2 sector codes are developed by UN statistic department. These are very important to defining and evaluating sectors on international platform. Also used for comparative analysis. On the following table, it is showed that evaluated sector list by ISO.
28
Table 4-1 Sector Codes
210 Mining and Quarrying
311 Manufacture of food products
312 Manufacture of food products not elsewhere classified (NEC)
313 Beverage industries (alcoholic and non-alcoholic)
314 Manufacture of tobacco processing
321 Manufacture of textiles
322 Manufacture of wearing apparel, except footwear
323 Tanning and dressing of leather; manufacture of leather substitutes
324 Manufacture of footwear
331 Manufacture of wood and products of wood and cork 332 Manufacture of wooden furniture
341 Manufacture of paper and paper products
342 Printing and publishing
351 Manufacture of basic chemicals
352 Manufacture of other chemical products
353 Manufacture of petroleum products
354 Oil and coal derivatives
355 Manufacture of rubber goods
356 Manufacture of plastic products NEC
361 Manufacture of pottery, china, earthenware and porcelain
362 Manufacture of glass and glass products
369 Manufacture of other nonmetallic mineral products
371 Manufacture of basic iron and steel
372 Manufacture of non-ferrous products
381 Manufacture of metal products
382 Manufacture of machinery, except electrical
383 Manufacture of electrical machinery, apparatus and appliances
384 Manufacture of motor vehicles
385 Manufacture of professional, scientific and medical instruments and equipment 390 Other manufacturing
400 Power production and distribution,
29 3.4.2.3.2 Sectorial Analysis
ISIC Rev. 2 sector codes are developed by UN statistic department. These are very important to defining and evaluating sectors on international platform. Also used for comparative analysis. On the following table, it is showed that evaluated sector list by ISO.
3.4.2.3.2.1 Mining and Quarrying-210
When Mining and Quarrying-210 sector investigated, in 2002, sector has 1.8% share with 9 firms in ISO top 500 list. Sector has a volatile trend in 2002-2012 but firm number up to 14 in 2012 and its share was increased by 2.8%. In general, sector has an increasing trend (slope:0,8364) in terms of firm number in 2002-2012.
Figure 4-20 Mining and Quarrying-210
3.4.2.3.2.2 Manufacture of Food Products-311
When Manufacture of Food products-311 sector investigated, in 2002, sector has 15% share with 75 firms in ISO top 500 list. Sector has a stable decreasing trend in 2002-2007 but firm number down to 54 in 2007 and its share was decreased by 10.8%. In 2012 the sector has 19.6% share with 98 firms. In general, sector has an increasing trend (slope:2,0091) in terms of firm number in 2002-2012.
30
Figure 4-21 Manufacture of Food Products-311
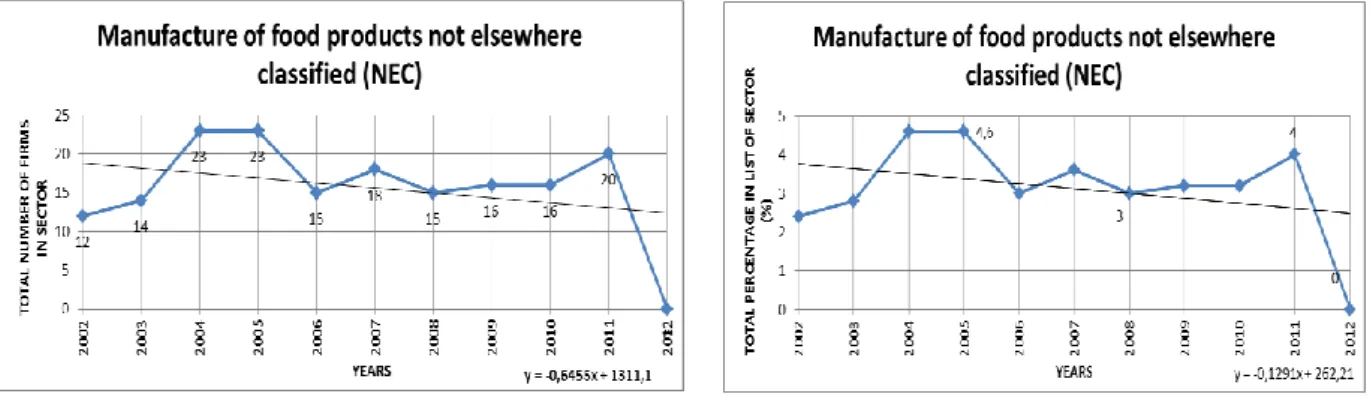
3.4.2.3.2.3 Manufacture of Food Products Not Elsewhere Classified (NEC)-312
When Manufacture of food products not elsewhere classified (NEC)-312 sector investigated, in 2002, sector has 2.4% share with 12 firms in ISO top 500 list. Sector has a stable increasing trend in 2002-2005 but firm number up to 23 in 2005 and its share was increased by 4.6%. In 2012 the sector lives an unexpected decrease and no firm represented in the list from it. In general, sector has an decreasing trend (slope:-0,6455) in terms of firm number in 2002-2012. But if we calculate except 2012 data because of statistical reliability , sector has an increasing trend (slope: 0,1818) in terms of firm number in 2002-2011
31
3.4.2.3.2.4 Beverage Industries (Alcoholic and Non-alcoholic)-313
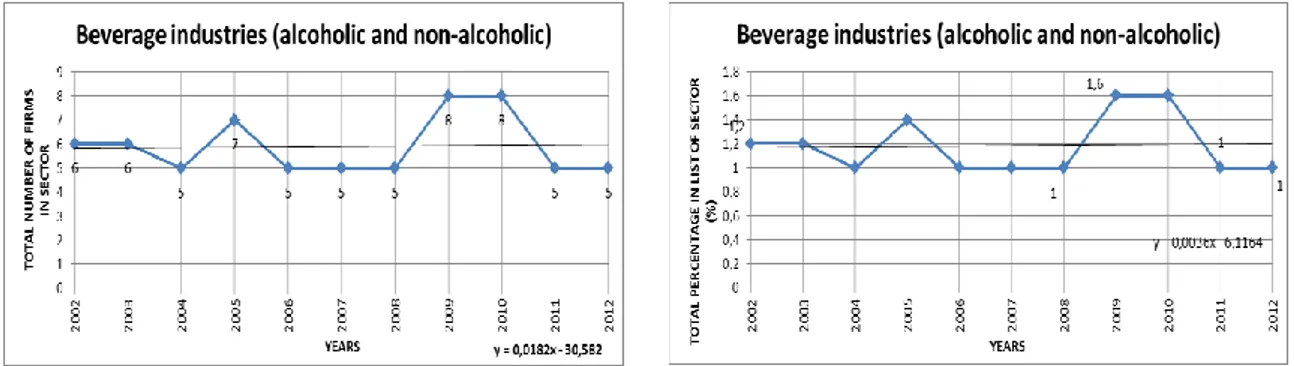
When Beverage industries (Alcoholic and Non-alcoholic)-313 sector investigated, in 2002, sector has 1.2% share with 6 firms in ISO top 500 list. Sector has a stable decreasing trend in 2002-2008 and firm number down to 4 in 2008 and its share was decreased by 1%. In 2012 the sector has 1% share with 5 firms. In general, sector has an increasing trend (slope:0,0182) in terms of firm number in 2002-2012.
Figure 4-23 Beverage Industries (Alcoholic and Non-alcoholic)-313 3.4.2.3.2.5 Manufacture of Tobacco Processing-314
When Manufacture of tobacco processing-314 sector investigated, in 2002 – 2003 – 2004, sector has 1% share with 5 firms in ISO top 500 list. Sector has a stable decreasing trend in 2004-2012 and firm number down to 4 in 2012 and its share was decreased by 0.8%. In general, sector has a decreasing trend (slope:-0,1182) in terms of firm number in 2002-2012.
32 3.4.2.3.2.6 Manufacture of Textiles -321
When Manufacture of Textiles -321 sector investigated, in 2002, sector has 17% share with 85 firms in ISO top 500 list. Sector has a stable decreasing trend in 2002-2008 and firm number down to 39 in 2008 and its share was decreased by 7.8%. In 2012 the sector has 7.4% share with 37 firms. In general, sector has a sharp decreasing trend (slope:-4,3455) in terms of firm number in 2002-2012
Figure 4-25Manufacture of Textiles -321
3.4.2.3.2.7 Manufacture of Wearing Apparel, Except Footwear -322
When Manufacture of wearing apparel, except footwear-322 sector investigated, in 2002, sector has 5% share with 25 firms in ISO top 500 list. Sector has a stable decreasing trend in 2002-2008 and firm number down to 8 in 2008 and its share was decreased by 71.6%. In 2012 the sector has 2.8% share with 14 firms. In general, sector has a sharp decreasing trend (slope:-1,5545) in terms of firm number in 2002-2012
33
3.4.2.3.2.8 Tanning and Dressing of Leather; Manufacture of Leather Substitutes-323
When Tanning and dressing of leather; manufacture of leather substitutes-323 sector investigated, in 2002-2003, sector has 0.2% share with only one firm in ISO top 500 list. After 2003 no firm from this sector appeared in the list. In general, sector has a decreasing trend (slope:-0,0818) in terms of firm number in 2002-2012.
Figure 4-27Tanning and Dressing of Leather; Manufacture of Leather Substitutes-323 3.4.2.3.2.9 Manufacture of Footwear-324
When Manufacture of footwear-324 sector investigated, in 2002 and 2003, no firm from this sector appeared in the list. In 2004, , sector has 0.2% share with only one firm in ISO top 500 list. Sector has a volatile trend in 2004-2012 and firm number stay remained in 2008. In general, sector has an increasing trend (slope:0,0455) in terms of firm number in 2002-2012.
34
3.4.2.3.2.10 Manufacture of Wood and Products of Wood and Cork-331
When Manufacture of wood and products of wood and cork-331 sector investigated, in 2002 sector has 1% share with 5 firms in ISO top 500 list. Sector has an increasing trend in 2002-2011 and firm number up to 7 in 2002-2011 and its share was increased by 1.4%. An unexpected decrease realized for the sector in 2012 and firm number in list down to 4 and its share was decreased by 0.8%. In general, sector has a relatively stable trend (slope:0,0091) in terms of firm number in 2002-2012.
Figure 4-29 Manufacture of Wood and Products of Wood and Cork-331 3.4.2.3.2.11 Manufacture of Wooden Furniture-322
When Manufacture of wooden furniture-322 sector investigated, in 2002 – 2008, sector has 0.6% share with 5 firms in ISO top 500 list. Sector has a decreasing trend in 2008-2012 and firm number down to 4 in 2012 and its share was decreased by 0.8%. In general, sector has a decreasing trend (slope:-0,1909) in terms of firm number in 2002-2012.
35
3.4.2.3.2.12 Manufacture of Paper and Paper Products-341
When Manufacture of paper and paper products-341 sector investigated, in 2002, sector has 2.8% share with 14 firms in ISO top 500 list. Sector has a volatile trend in 2008-2012 and firm number down to 11 in 2012 and its share was decreased by 2.2%. In general, sector has a decreasing trend (slope:-0,2364) in terms of firm number in 2002-2012.
Figure 4-31Manufacture of Paper and Paper Products-341 3.4.2.3.2.13 Printing and Publishing -342
When Printing and publishing -342 sector investigated, in 2002, sector has 0.8% share with 4 firms in ISO top 500 list. Sector has an increasing trend in 2002-2008 and firm number up to 8 in 2012 and its share was increased by 1.6%. In 2012 the sector has 1% share with 5 firms. In general, sector has a decreasing trend (slope:-0,1273) in terms of firm number in 2002-2012.
36 3.4.2.3.2.14 Manufacture of Basic Chemicals-351
When Manufacture of basic chemicals-351 sector investigated, it has an volatile trend in 2002-2011 and firm number is 15 and its share was 3%. In 2012 the sector has 2.6% share with 13 firms. In general, sector has a decreasing trend (slope:-0,1545) in terms of firm number in 2002-2012.
Figure 4-33Manufacture of Basic Chemicals-351
3.4.2.3.2.15 Manufacture of Other Chemical Products-352
When Manufacture of other chemical products-352 sector investigated, in 2002, sector has 7% share with 30 firms in ISO top 500 list. Sector has an increasing trend in 2002-2012 and firm number down to 12 in 2012 and its share was decreased by 4.6%. In general, sector has a decreasing trend (slope:-0,8455) in terms of firm number in 2002-2012.
37 3.4.2.3.2.16 Manufacture of Petroleum Products-353
When Manufacture of petroleum products-353 sector investigated, in 2002-2007, sector has 0.6% share with 3 firms in ISO top 500 list. Sector has a decreasing trend in 2007-2011 and firm number down to 2 in 2011. In 2012 the sector has 2.2% share with 11 firms. In general, sector has an increasing trend (slope:0,2727) in terms of firm number in 2002-2012.
Figure 4-35Manufacture of Petroleum Products-353
3.4.2.3.2.17 Oil and Coal Derivatives-354
When Oil and coal derivatives -354 sector investigated, in 2002-2003, sector has 2.6% share with 13 firms in ISO top 500 list. Sector has a decreasing trend in 2003-2011 and firm number down to 12 in 2011 and its share was decreased by 2.4%. In 2012 no firm was appeared in ISO top 500 list. In general, sector has a decreasing trend (slope:-0,6) in terms of firm number in 2002-2012. And also if we calculate except 2012 data because of statistical reliability , sector has an decreasing trend (slope: -0,1152) in terms of firm number in 2002-2011
38 3.4.2.3.2.18 Manufacture of Rubber Goods-355
When Manufacture of rubber goods -355 sector investigated, in 2002-2010, sector has 1% share with 5 firms in ISO top 500 list. Sector has an increasing trend in 2010-2012 and firm number up to 8 in 2012 its share was increased by 1.6%.. In general, sector has an increasing trend (slope:0,2) in terms of firm number in 2002-2012.
Figure 4-37 Manufacture of Rubber Goods-355 3.4.2.3.2.19 Manufacture of Plastic Products NEC -356
When Manufacture of plastic products NEC-356 sector investigated, in 2002, sector has 2.4% share with 12 firms in ISO top 500 list. Sector has an increasing trend in 2002-2009 and firm number up to 23 in 2012 its share was increased by 4.6%. In 2012 the sector has 3.4% share with 17 firms. In general, sector has an increasing trend (slope:0,6545) in terms of firm number in 2002-2012.
39
3.4.2.3.2.20 Manufacture of Pottery, China, Earthenware and Porcelain-361
When Manufacture of pottery, china, earthenware and porcelain – 361 sector investigated, in 2002, sector has 1% share with 5 firms in ISO top 500 list. Sector has an increasing trend in 2002-2012 and firm number up to 6 in 2012 its share was increased by 1.2%. In general, sector has a decreasing trend (slope:-0.0073) in terms of firm number in 2002-2012.
Figure 4-39 Manufacture of Pottery, China, Earthenware and Porcelain-361 3.4.2.3.2.21 Manufacture of Glass and Glass Products-362
When Manufacture of glass and glass products-362 sector investigated, in 2002-2007, sector has 1.4% share with 7 firms in ISO top 500 list. Sector has a volatile decreasing trend in 2009-2012 and firm number down to 6 in 2012 its share was increased by 1.2%. In general, sector has a decreasing trend (slope:-0.0545) in terms of firm number in 2002-2012.
40
3.4.2.3.2.22 Manufacture of Other Nonmetallic Mineral Products-369
When Manufacture of other nonmetallic mineral products-369 sector investigated, in 2002-2006, sector has 7% share with 35 firms in ISO top 500 list. Sector has a decreasing trend in 2006-2012 and firm number down to 26 in 2012 its share was increased by 5.2%. In general, sector has an increasing trend (slope:0,2273) in terms of firm number in 2002-2012.
Figure 4-41 Manufacture of Other Nonmetallic Mineral Products-369 3.4.2.3.2.23 Manufacture of Basic Iron and Steel-371
When Manufacture of basic iron and steel-371 sector investigated, in 2002, sector has 9% share with 45 firms in ISO top 500 list. Sector has a volatile increasing trend in 2002-2012 and firm number up to 26 in 2012 its share was increased by 11.2%. In general, sector has an increasing trend (slope:0,9364) in terms of firm number in 2002-2012.
41
3.4.2.3.2.24 Manufacture of Non-Ferrous Products-372
When Manufacture of non-ferrous products-372 sector investigated, in 2002-2007, sector has 1.8% share with 9 firms in ISO top 500 list. Sector has a volatile increasing trend in 2007-2012 and firm number up to 19 in 2007-2012 its share was increased by 3.8%. In general, sector has an increasing trend (slope:1,2727) in terms of firm number in 2002-2012.
Figure 4-43Manufacture of Non-Ferrous Products-372 3.4.2.3.2.25 Manufacture of Metal Products-381
When Manufacture of metal products-381 sector investigated, in 2003-2004, sector has 0.8% share with 4 firms in ISO top 500 list. Sector has a sharp increasing trend in 2003-2012 and firm number up to 19 in 2012 its share was increased by 3.8%. In general, sector has an increasing trend (slope:0,9909) in terms of firm number in 2002-2012.
42
3.4.2.3.2.26 Manufacture of Machinery, Except Electrical -382
When Manufacture of machinery, except electrical-382 sector investigated, in 2002-2011 sector has a stable increasing trend and firm was 22 in 2011 its share 4.4%. In 2012 the sector has 2% share with 10 firms. In general, sector has an increasing trend (slope:0,1364) in terms of firm number in 2002-2012.
Figure 4-45Manufacture of Machinery, Except Electrical -382
3.4.2.3.2.27 Manufacture of Electrical Machinery, Apparatus and Appliances-383
When Manufacture of electrical machinery, apparatus and appliances-383 sector investigated, in 2002, sector has 6.8% share with 34 firms in ISO top 500 list. Sector has a “s” trend in 2002-2012 and firm number up to 35 in 2012 its share was increased by 7%. In general, sector has an increasing trend (slope:1,1818) in terms of firm number in 2002-2012.
43 3.4.2.3.2.28 Manufacture of Motor Vehicles-384
When Manufacture of motor vehicles-384 sector investigated, in 2002, sector has 8% share with 38 firms in ISO top 500 list. Sector has a volatile trend in 2002-2012 and firm number down to 36 in 2012 its share was decreased by 7.2%. In general, sector has a decreasing trend (slope:-0,2909) in terms of firm number in 2002-2012.
Figure 4-47Manufacture of Motor Vehicles-384
3.4.2.3.2.29 Manufacture of Professional, Scientific and Medical Instruments and Equipment-385
When Manufacture of professional, scientific and medical instruments and equipment-385 sector investigated, in 2002-2012, no firm from sector appeared in ISO top 500 list. In 2002, sector gained 0.2% share with only one firm in ISO top 500 list. In general, sector has an increasing trend (slope:0,0455) in terms of firm number in 2002-2012.