International Periodical for the Languages, Literature and History of Turkish or Turkic Volume 12/12, p. 231-250
DOI Number: http://dx.doi.org/10.7827/TurkishStudies.11777 ISSN: 1308-2140, ANKARA-TURKEY
Article Info/Makale Bilgisi
Referees/Hakemler: Doç. Dr. Murat ÇETİNKAYA – Doç. Dr. Volkan ALPTEKİN – Yrd. Doç. Dr. Murat YILDIZ
This article was checked by iThenticate.
THE IMPACTS OF INTEREST EXPENDITURE ON INCOME DISTRIBUTION AND AN APPLICATION ON THE FACTORS
DISTORTING INCOME DISTRIBUTION: AN EMPIRICAL ANALYSIS FOR TURKEY
İbrahim Halil SUGÖZÜ* - Savaş ERDOĞAN** - Esra ULAŞAN***
ABSTRACT
Income inequality and poverty have emerged as the most important socio-economic problems for these times. Turkey, since the 1980s, meets public sector deficits by internal borrowing. To meet interest costs incurred for borrowing with tax revenues, which is an important source of the government, and gradually increase the share of the indirect taxes in tax revenues is an accurate indicator of an income transfer from public to the owners of capital. This study will focus on internal borrowing interest payments. The distribution of the recipients of internal borrowing, the share of interest payments in domestic debt stock of the state are evaluated, and by examining the course of interest payments over the years, will be focused on the effect on income distribution. In addition, the effect of the distribution of tax burden on income distribution will also be analyzed. And finally, in this study, the factors distorting the income distribution will be analyzed and the Topsis Model which is conducted over the period 2002-2015. Findings are in accordance with the Gini Coefficient results. Accordingly, income distribution indicated a more equitable distribution during the period when the domestic debt interest payments, unemployment rates, the share of indirect taxes, inflation and interest rates were decreasing.
STRUCTURED ABSTRACT
The debt crisis experienced in some developed and developing countries, following the global financial crisis, has made it a must to question, in particular, the recent borrowings quickly resorted to for the financing of public deficits as a regular source of financing.
It is known that the macro-economic effects of borrowing generally have an adverse impact. However, internal borrowing and foreign indictment and interest payments, which are the cost of these borrowings, do not have the same effects on the economy. Internal debt interest payments are largely being paid to the banks. A natural reason for this is that the majority of buyers of internal debt are banks. High interest rates make the borrowing attractive in Turkey. Therefore, high levels of borrowing, and banks are being the main buyers of borrowing, entire debts belonging to the public sector, taxes being the financing source of the public sector and a high level share of indirect taxes in tax revenues reveal the results of transferring income from the public to the owners of capital. External debt interest payments due to the external debt recipients are foreign leads to a loss of prosperity rather than deterioration of income distribution. But because of the most important source of foreign indebtment for financing the borrowing, the impact of external borrowing to income distribution is indirect.
This study will focus on internal borrowing. The distribution of the recipients of internal borrowing, the share of interest payments in domestic debt stock of the state are evaluated, and by examining the course of interest payments over the years, will be focused on the effect on income distribution. In this study, the effect of the distribution of tax burden on income distribution will also be analyzed. In the last section, the Topsis Model will be applied to factors distorting income distribution, and the model results will be compared with the Gini Coefficient.
The study included data on the Consumer Price Index (TUFE), the share of indirect taxes within total tax revenues (D), unemployment rates (ISS), the share of domestic borrowing interest payments within budget expenditures (IBF) and interest rates (F) taken from the internet data base of the Republic of Turkey Ministry of Finance and TUIK.
To measure the economic performance criteria of the countries, the Topsis Method has been used, which is one of the multicriteria decision making methods. With this method, the aim is to calculate a single performance score based on four variants and to list the performance sizes accordingly.
When the performance table are examined, the first three years with the fairest income distribution considering five data are 2013, 2012 and 2014. On the other hand, 2002, 2003 and 2004 are the years with the worst performance of income distribution. 2002, the worst year in terms of performance, is underlined with the inflation ratio, share of indirect taxes within the total tax revenues, and a high share of the outstanding domestic debt and domestic borrowing interest payments within the budget expenditure and interest rates.
When the graph and the correlation coefficient of 68% are both examined, it is seen that the results of the performance and the Gini coefficient demonstrate a parallel development at a high rate. Despite the improvement in the performance values, the Gini coefficient is likely to be the result of a sudden increase in 2006 due to a change in research methodology. While in 2005 and earlier years calculations were made according to Household Budget Survey, Income and Living Conditions Survey has started to be done since 2006. When the correlation coefficient is recalculated accordingly, the relationship between the
performance results and the Gini coefficient results becomes even clearer. The correlation coefficient is calculated as 98.7% prior to 2006 while it has been calculated as 71.6% since 2006. Consequently, the new results indicate that the relationship between the performance results and the Gini Coefficient is much stronger in Turkey in the period of 2002-2015.
The reduction in the investments and in national income caused by the high interest rates is the most important negative result in terms of economic growth and income per person. Allocating an important part of the budget expenditure to interest spending will give the same results.
High interest payment causes an imbalance creating an income transfer from people to capital owners. The high ratio of the indirect taxes to total taxes deepens this imbalance. Other important reasons of unfair income distribution are high interest, inflation and unemployment ratios. The period of 2002-2015 has been a year of fluctuation of income distribution in Turkey. When we look at the performance values in this period, it is possible to conclude as follows. Income distribution has been fairer in periods when the share of domestic borrowing interest payments in the budget expenditures started to decrease, when the unemployment rate was less, the share of the indirect taxes within total taxes started to decrease, and when the consumer price index (inflation rate) and interest rates started to decrease.
Keywords: Income Distribution, Interest, Inflation, Unemployment, Topsis Model
FAİZ HARCAMALARININ GELİR DAĞILIMINA ETKİSİ VE GELİR DAĞILIMINI BOZAN FAKTÖRLER ÜZERİNE BİR
UYGULAMA: TÜRKİYE ÖRNEĞİ ÖZET
Gelir dağılımında yaşanan adaletsizlik ve ülke nüfusunun önemli bir kesimini kapsayan yoksulluk, özellikle son dönemde en önemli sosyo-ekonomik sorunlar olarak kendini göstermektedir. Türkiye, 1980’li yıllardan itibaren kamu kesimi açıklarını olağanüstü finansman yollarından olan iç borçlanma yoluyla finanse etme yoluna gitmiştir. Borçlanma için katlanılan faiz maliyetinin devletin önemli gelir kaynağı olan vergi gelirleri ile karşılanması ve vergi gelirlerinde de dolaylı vergilerin payının gittikçe yükselmesi, halktan sermaye sahiplerine doğru bir gelir transferi yaşandığının en önemli ekonomik göstergelerinden bazılarıdır. Bu çalışmada öncelikle gelir dağılımı üzerinde en önemli etkiye sahip olan makroekonomik faktörlerden iç borç faiz ödemeleri ve faiz oranlarına odaklanılmaktadır. Çalışmada iç borçlanmanın alıcılara göre dağılımı ve devletin iç borç stoku içinde faiz ödemelerinin payı incelenmekte, faiz ödemelerinin yıllar itibariyle seyri incelenerek gelir dağılımına etkisi üzerinde durulmaktadır. Bununla birlikte vergi yükündeki dolaylı ve dolaysız vergi dağılımının gelir dağılımına etkisi de incelenmektedir. Çalışmada son bölümde gelir dağılımını bozan faktörler ile 2002 – 2015 dönemi için Topsis Model uygulaması yapılmıştır. Elde
edilen sonuçların Gini Katsayısı sonuçlarına uygun çıkıp çıkmadığı araştırılmıştır. Yapılan ampirik uygulama ile elde edilen sonuçların Gini Katsayısına uygun çıktığı görülmüştür. Buna göre iç borç faiz ödemelerinin, işsizlik oranlarının, dolaylı vergilerin payının, enflasyonun ve faiz oranlarının azalmaya başladığı dönemlerde gelir dağılımı daha adil bir dağılım sergilemiştir.
Anahtar Kelimeler: Gelir Dağılımı, Faiz, Enflasyon, İşsizlik, Topsis
Modeli 1. Introduction
The debt crisis experienced in some developed and developing countries, following the global financial crisis, has made it a must to question, in particular, the recent borrowings quickly resorted to for the financing of public deficits as a regular source of financing.
It is known that the macro-economic effects of borrowing generally have an adverse impact. However, internal borrowing and foreign indictment and interest payments, which are the cost of these borrowings, do not have the same effects on the economy. Internal debt interest payments are largely being paid to the banks. A natural reason for this is that the majority of buyers of internal debt are banks. High interest rates make the borrowing attractive in Turkey. Therefore, high levels of borrowing, and banks arebeing the main buyers of borrowing, entire debts belonging to the public sector, taxes being the financing source of the public sector and a high level share of indirect taxes in tax revenues reveal the results of transferring income from the public to the owners of capital. External debt interest payments due to the external debt recipients are foreign leads to a loss of prosperity rather than deterioration of income distribution. But because of the most important source of foreign indebtment for financing the borrowing, the impact of external borrowing to income distribution is indirect.
This study will focus on internal borrowing. The distribution of the recipients of internal borrowing, the share of interest payments in domestic debt stock of the state are evaluated, and by examining the course of interest payments over the years, will be focused on the effect on income distribution. In this study, the effect of the distribution of tax burden on income distribution will also be analyzed. In the last section, the Topsis Model will be applied to factors distorting income distribution, and the model results will be compared with the Gini Coefficient.
2. A brief literature review
There are a number of studies available examining the effects of the size of domestic borrowing on macroeconomic indicators (growth, inflation, interest rates, exchange rates) in the economic literature. In general, researchers focused on the most significant issues: why the need for internal debts, how debts are paid, impacts on the economy and whether debts are sustainable. However, there are scarcely any studies examining the effect of internal borrowing on income distribution compared to other factors.
According to Keynes, lowering interest rates will reduce the income of the rentier, diminish the imbalance in income distribution, and prepare the environment to relieve the problem of underemployment by increasing investments. Keynes sees the imbalance in income distribution as a fundamental flaw in the world of economics, also, with the other flaw being unemployment, the main reason for both flaws is the high interest rates according to Keynes (Denis, as cited in Ersoy, 2008: 572).
Analysis conducted by Coban, Doganalp and Uysal (2008) has drawn attention to internal borrowing, often referred to as a financing implement, in recent years as creating a source of problems in economies. Reusing the resources acquired by internal borrowing for principal and interest payments indicates that it is in a vicious circle of internal debt-interest spiral.
Ulusoy and Cural's study in 2006 on the sustainability of internal debts after the period of 1980 in Turkey reached a conclusion of unsustainable internal debt. Unsustainable debt distorts price stability, inhibits economic growth, and makes it difficult to achieve long-term macro-economic plans. It is concluded that the size of domestic public debt stock constitutes the reason for many macro-economic problems, including high inflation and income inequality.
Ozgen (1999) refers to the importance of domestic debt problems and specifies that domestic debt interest payments are the most significant expense item, emphasizing limiting domestic borrowing by drawing attention to the negative effects on income distribution.
Bedir and Karabulut (2011) examined the effects of domestic debt on income distribution and found that the changes between debt indicators and income distribution indicators appeared in the same direction.
Guvemli (2004) regards using a large proportion of collected taxes in order to pay the interests of domestic public debts as distorting the equity of income distribution and increasing poverty.
In a study researching the economic and social effects of domestic borrowing after 1980, Bayraktar (2009) states that public sector borrowing from the market with high interest rates narrows the possibility of funding for the private sector, and so the real economy is negatively caused to shrink, which in turn causes increases in unemployment that have a distorting effect on income distribution. Especially in inflationary periods, borrowing policies pursued lead to a serious deterioration in income distribution against sectors which are not creditors of the government.
Ceyhan (2009) emphasized in his study on public debts in 2005 that the increase in public budget in terms of GDP, the decrease in personal income with domestic debt interest payments bringing a burden on the budget, and disruption in income distribution has led to problems, even to the point of threatening national security.
Demir and Server (2008) asserted in their study in 2008 that public domestic debt deepens the current inequalities of income distribution. These adverse effects occur during interest and principal payments.
Bulut and Canpolat's (2003) econometric analysis of public deficits, inflation, interest rates and exchange rates relations exerts that public debt has an impact in direct proportion to the other variables. They also deduced that high levels of interest rates raise borrowing and cause an inequitable income distribution.
In Cataloluk's (2009) study on public borrowing, the government eventually paying these debts that have been taken from the other sectors with the interest payments by tax revenues would mean an income transfer from the lower classes to the wealthy classes who are the owners of bonds and equity. Public borrowing creates an income distribution inequality against the weaker classes and derogates social balance.
A different approach to the issue brought by Akdis (1995) reveals the vicious cycle of lack of income-borrowing-lack of income. A government that applies for borrowing due to the scarcity of income also incurs the lack of revenue again as a result of the provisions of advantages and exemptions (tax) which satisfies the need of the government by individuals and corporations. In
addition, Akdis emphasized in his study that the effect of the need of government reduces government revenues in addition to the existence of disruptive effects on income distribution.
Gokcen (2002) has deduced in his study, which assess the debts in the Turkish economy, that the significance of internal debts disturbs the income distribution. One of the most important effects of the domestic debt stock is debt burden. If the real interest rate is above the growth rate in an economy, debt burden increases. Accordingly, debt burden will become a larger proportion of GNP and increase the burden of interest payments. This situation leads to the deterioration of income distribution and the use of resources for more speculative purposes.
Bulbul, Ejder and Sahan (2006) highlighted in their study based on the years 1990-2004 that the burden of interest has become a large proportion of tax revenues in the consolidated budget and tax increases (especially indirect taxes) leads to worse results in terms of social aspects.
3. The economic impact of interest payments
There are five financing methods of public sector deficits, such as monetizing money, excising new taxes, and using foreign exchange reserves, including internal and external borrowing. It can be seen that foreign exchange reserves are not sufficient to finance the budget deficits by using foreign exchange reserves, due to the inflationary effects of resourcing the financial method of monetizing, and also financing internal and external debts, instead of excising the new taxes (Isik, Karayilmazlar, Organ, Isik, 2005: 63; Uluatam, 1999: 533).
Financing of public deficits maintains the significance of internal borrowing, brings much negativity on the economy. These effects have a crowding out effect and lead to inequality of income distribution (Gok, 2003: 134-135; Sugozu, 2010a: 43-58). Public debts can also have distorting effects on macro-economic variables such as interest, interest and growth and can lead to a spiral of debt (Demir and Sever, 2008: 177). Before examining the effects of interest payments on income distribution, other economic effects will be briefly examined in this section.
Increasing internal borrowing exacerbates the interest burden on the budget. The interest burden on the budget appears to be a product of inflation. Savers and investors claim a risk premium to maintain the return on investment from inflation risk when inflation occurs in high and fluctuating economies. That is, they claim a higher return obtained by investments than it should be. This also causes an increase in real interest rates. Therefore, the amounts paid to the risk premium leads to a further increase in public deficit; moreover, as a result of the rising costs of investments, the real economy will be adversely affected by this situation (Onder, 2005: 7).
Thus, increasing public deficit consistently causes a vicious cycle. Hence, public deficits-inflation-interest rates- exchange rate again consists of the spiral public deficits (Bulut and Canbolat, 2003: 17).
In Peker and Acar's study (2010) examining the relationship between budget deficits and internal borrowing interest rates it has been concluded that the factor affecting the budget deficits in Turkey and borrowing with high interest rates increases the budget deficits more.
On account of budget interest payments being the result of borrowing, studies are made in the context of the effects of internal and external borrowing. There are researchers arguing the inflationary effects of internal and external borrowing, as well as researchers propounding the deflationary effect. A common idea is that borrowing creates inflationary pressure (Sugozu and Yiyit, 2010: 367).
Indeed, Saracoglu's (1998) study on the years between 1980-1995 shows that the main reason for inflation is the extent of the public sector borrowing requirement (Bayraktar, 2009: 292). The
idea of a deflationary effect on the economy does not survive because an increase in government debts depreciates the value of current debt stock (Cataloluk, 2009: 251).
While the resources obtained from the taxes decrease, the government would want to increase revenues by raising the ratio of the indirect taxes. This increases costliness and reduces purchasing power (Guvemli, 2004: 24).
Financing high public sector deficits by internal borrowing will further increase public debt. Interest that is being used for government debt securities will direct savings, which is already inadequate for speculative profits. Capital that is in pursuit of high profits aspires to provide risk-free return. This case crowds out the investments and has a negative impact on the real sector and growth. Reduction of investments or current debts that are not being used in areas which have not high yields will result in reduced tax revenues. Declining of public revenues that are not sufficient for interest and principal repayments has increased the new borrowings. In consequence, borrowing resolves that debt financing by debts (refinancing), appears to be a permanent source of financing (Meric, 2003). High interest rates paid for public debt instruments will push the private sector to provide risk-free and high returns by leaving the main areas of activity rather than investing. In other words, the seizure of the private sector on savings through internal borrowing subjects the private sector to a crowding out effect (Tunca, 1993). In other words, the government budget has now turned into an instrument of realignment that transfers the resources to financial markets rather than social infrastructure and economic growth (Yeldan, 2004: 6).
4. The effect of interest payments on income distribution
A concentration of sources which can be used in real investments in financial investment causes a rent economy and reduction of tax incomes due to the decrease in production. This has an effect on the wealth concentration in certain segments and has therefore a distorting effect on income distribution (Guven, 1983: 107).
Failure to expand the tax base and underground economy are the causes of the increase in budget deficits. In Turkey, interest increases as debts increase, inflation increases as interest increases, and income distribution becomes distorted as inflation increases (Altuğ, 1999: 14). The state carries out source transfer from the poor to the rich among the segments of the society through domestic borrowing. The funds required for the back payment of the debts received by the state and the interest payments are provided from taxes, which are the main source of revenue of the state. That is, through legal obligations, it collects under the name of tax shares from the spending made, revenues obtained and wealth possessed. It distributes this source as interest to people or organizations who voluntarily lent money to it (Erdem, 2006: 155). Therefore, the state collects tax from the poor and distributes it to the high income group which means the transfer of sources. This indicates that the income distribution develops in favor of the few high income and wealth groups holding high deposits at banks (Bilen ve Es, 1998). The financing burden of the public sector spending is faced by the low and medium income groups who have no actual possibility of savings and who cannot buy government debt securities (Sahin, 2009: 584).
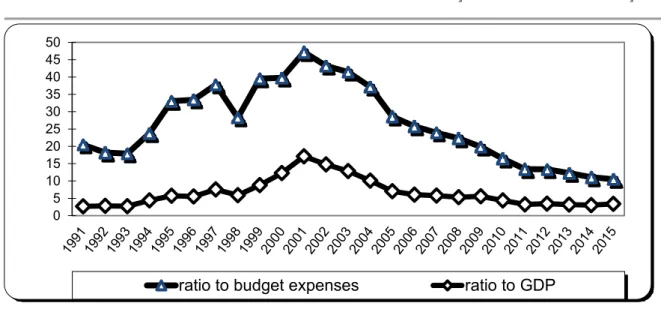
Fig. 1. Ratio of domestic borrowing interest payments to budget expenses and GDP (1991-2015, %).
Source: Undersecretariat of Treasury, Ministry of Finance of Turkey Republic
The increase in the ratio of Outstanding Domestic Borrowing/Gross National Product means an increase in the weight of domestic borrowings in the economy. Briefly, the ratio of Outstanding Domestic Borrowing to Gross National Product was realized as 11% in 1990. However, there has been a gradual increase since 1996. In 1996, this ratio reached its highest of 51% by an extraordinary bounce due to the crises in that period (Koçak, 2009: 74). 2001 is the year with the highest outstanding domestic borrowing among the years covered in this paper. In the subsequent years, the outstanding domestic borrowing decreased due to growth in economy, primary surplus of the budget, and loans provided by the IMF (Bulbul, Ejder ve Sahan, 2006: 116). After 2001, this ratio gradually decreased and the concerned ratio was 29% in 2008. Within the framework of the EU Maastricht criteria, outstanding domestic borrowing cannot exceed 20% of the Gross National Product. When examined over the years, the ratio of outstanding domestic borrowing to Gross National Product has been over this limit since 1999. After the global financial crisis, this ratio increased again to 35% causing an increase in the burden of debt.
Another issue that must be dealt with is how to cover the principal and interest amounts of borrowing from the budget. The share of interest payments within the consolidated budget corresponds to an important share of indirect taxes, which indicates that domestic borrowing payments are a burdened on low income and paid groups (Bulbul, Ejder ve Sahan, 2006: 116). Thus, income is redistributed from riches towards poor’s (Pehlivan, 2009: 36), as reported in Table 1.
0 5 10 15 20 25 30 35 40 45 50
ratio to budget expenses ratio to GDP
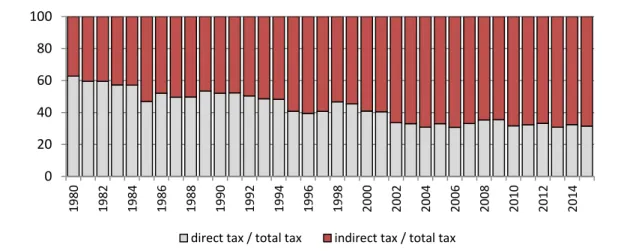
--Fig. 2. Ratio of direct and indirect taxes to total tax in the period between 1980 – 2015. Source: State Planning Organization of Republic of Turkey (DPT)
When compared over the years, there has been a shift from direct taxes indirect taxes in the Turkish Tax System, especially in the last 30 years. While the ratio of the direct taxes was 65 percent and the ratio of indirect taxes was 35 percent 30 years ago, this ratio is reversed today with 31% direct taxes and 69% indirect taxes in 2015.
Table 1. Budget Revenues, Domestic Borrowing Interest Payments, Unemployment and Interest Rates Yea rs Ind irec t T a x es* T o ta l Ta x Rev enues B ud g et Rev enues Do mes tic B o rr o wing Inte re st P a y ments B ud g et E x pend it ures Unempl o y me nt Inte re st Ra tes* * 2002 39.571 59.632 79.420 43.469 119.604 10,3 54,2 2003 56.536 84.316 101.040 52.719 141.248 10,5 42,5 2004 69.892 101.039 122.964 50.053 152.093 10,3 24,4 2005 88.867 120.935 152.784 39.270 159.687 9,5 18,5 2006 103.937 142.353 173.483 38.659 178.126 9,0 16,4 2007 113.625 156.815 190.360 41.540 204.068 9,2 18,0 2008 122.741 172.645 209.598 44.516 227.031 10,0 17,8 2009 124.811 176.589 215.060 46.762 267.275 13,1 14,4 2010 143.967 210.532 254.028 41.900 294.359 11,1 9,3 2011 171.709 253.765 295.862 35.064 314.607 9,1 9,2 2012 186.231 278.751 331.700 40.800 361.887 8,4 10,0 2013 225.728 326.169 389.682 39.072 408.225 9,0 8,1 2014 238.093 352.514 425.383 39.258 448.752 9,9 9,9 2015 278.950 407.475 483.386 39.775 505.992 10,3 9,9 *Amounts including local administration, fund shares and returns.
** Weighted average interest rates for deposits in Turkish Lira by banks, up to 1 year.
Source: Republic of Turkey Central Bank (TCMB), Ministry of Finance, Undersecretariat of Treasury 0 20 40 60 80 100 198 0 198 2 198 4 198 6 198 8 199 0 19 92 199 4 199 6 199 8 200 0 200 2 200 4 200 6 200 8 201 0 201 2 201 4
Effective taxation of the groups with high income cannot be achieved. The state has difficulties in collecting direct taxes. It is inevitable that the revenue distribution will be unbalanced if there is no effective taxation as the burden is always on the indirect tax payers.
In the Turkish tax system, the great increase in the share of indirect taxes within tax revenues, especially in recent years, disturbs the tax burden distribution against the people with low and fixed incomes (Sugozu, 2010: 168). Hence, the relative decrease in education and health spending, which directly effects the income distribution and negative change in the quality of tax, damages the income distribution against the poorer classes (Palamut ve Yuce, 2001).
To be more precise, financing the interests of state debts with taxes negatively affects the poorer classes who have to participate in the financing of interest, especially through consumption taxes (Aktan ve Vural, 2002). Thus, the forced savings created by deducting from income and consumption of the masses do not return to the economy through investment, and the decrease in the labor share does not serve the growth (DPT, 2001: 75).
Another way to see the effect of interest payments on income distribution is to check the real interest payments paid for government debt securities. Banks, who buy the majority of government debt securities, play an important role in determining interest payments. Banks have a kind of monopsonist structure (Gök, 2003: 131). This also leads to a substantial amount of the bank resources being used in public debt financing. However, the real interest ratio should not exceed the growth rate to ensure income distribution is not damaged (Karluk, 2005: 145). The negative impact of the short and long term interest ratios on economic growth has been proven with studies (Yamak ve Tanrıöver, 2008: 11), while the debt burden of the tax payers will increase if the growth rate is below the real interest ratio (Gökçen, 2002). Debt burden causes an increase in shares within the Gross National Product and in interest payments. Payments made to borrowing interests turn to a revenue transfer from the tax payers to the holders of government debt securities (Isik, Karayilmazlar, Organ ve Isik, 2005: 82). This further damages the income distribution and is described as social injustice (Cataloluk, 2009: 253).
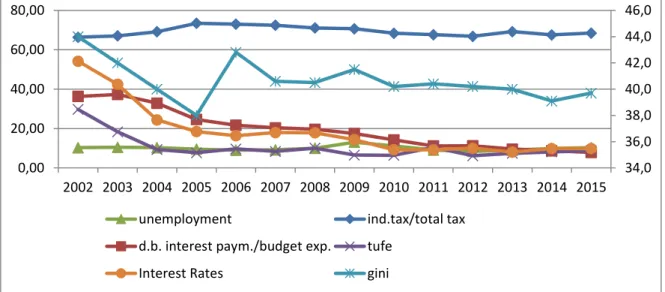
Fig. 3. Unemployment rates, the share of indirect taxes within total tax revenues and the share of domestic borrowing interest payments within budget expenditures, Consumer Price Index (TUFE), interest rates and the Gini Coefficient (2002-2015,%). Gini Coefficient values are on the right-hand side of the figure axis.
Source: TUIK, Undersecretaries of Treasury, DPT, TCMB
34,0 36,0 38,0 40,0 42,0 44,0 46,0 0,00 20,00 40,00 60,00 80,00 2002 2003 2004 2005 2006 2007 2008 2009 2010 2011 2012 2013 2014 2015
unemployment ind.tax/total tax
d.b. interest paym./budget exp. tufe
Unemployment rate is 10.30 percent in both 2002 and 2015. The ratio of indirect taxes to total tax increased from 66,36 percent to 68,46 percent in the period 2002-2015, while the ratio of domestic borrowing interest payment to budget expenditures decreased from 36,34 percent to 7.86 percent. The ratio of the total borrowing interest payments to budget expenditures was 10.5 percent in 2015. The Gini Coefficient has been similar to these positive developments in the interest service ratios from 2002 to 2015. Despite this fact, the Gini Coefficient was 0.397 in 2015, which is higher than 2005 when it was 0.380 and 2014 when it was 0.391.
The share of the interest payments within the national income experienced a gradual decrease between 2002-2015. The fact that the interest payments within budget expenditures in 2009 covered 6% of the Gross National Product caused a deduction in other social spending (Ulusoy ve Cural, 2006: 6). It is also possible that the interest payments put pressure on other expenditure items (Önder, 2001: 30-33). A narrowing in the social service investments can only provide primary surplus measuring the debt payment capacity of the state. It is clear that this causes a welfare loss.
There is another aspect of the interest payments with respect to tax. When the interest of Treasury bond is obtained with high amounts, there is no tax obligation related to these amounts but there is a 30-50% tax burden when an investment is made, a production is involved, business is conducted by establishing a company, and employment is provided. This does not ensure justice, it causes injustice (Sugozu, 2010: 168).
Therefore, interest payments, especially domestic borrowing interest payments, are important factors damaging the justice aspect of income distribution (Ersezer, 2006: 265). In the event that the injustice of income distribution cannot be eliminated, it is clear that this problem will gradually increase and negatively affect peace in society and the development of the country.
5. Gini Coefficient
There have been fluctuations in the Gini Coefficient, which indicates the income distribution injustice in the period 2002-2015.
Table 2. The first group of 20% and the fifth group of 20%
Years 2002 2003 2004 2005 2006 2007 2008 2009 2010 2011 2012 2013 2014 2015 First 20% 5,3 6,0 6,0 6,1 5,1 5,8 5,8 5,6 5,8 5,8 5,9 6,1 6,2 6,1
Fifth 20% 50,1 48,3 46,2 44,4 48,4 46,9 46,7 47,6 46,4 46,7 46,6 46,6 45,9 46,5 Source: Statistics Institution of Turkey (TUIK)
Note: “The first group of 20%” represents the lowest income group and “the fifth group of 20%” represents the highest income group.
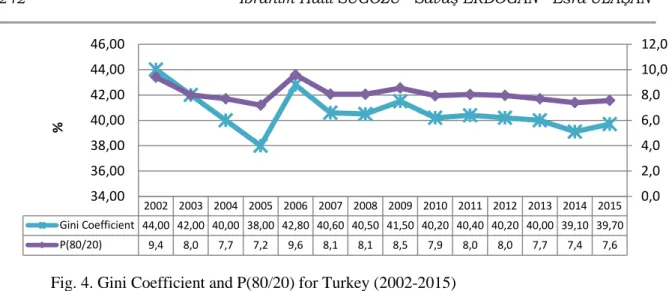
Fig. 4. Gini Coefficient and P(80/20) for Turkey (2002-2015) Source: Statistics Institution of Turkey (TUIK)
One of the most frequent methods used in the analysis of inequality in income distribution divides the population into five equal groups from the lowest income group to the highest income group and calculates the national income of each group. The great difference between the poorest 20% and the richest 20% in their shares from the national income indicates the injustice in the income distribution.
When the data of income distribution is studied, the share of the first 20% group in the total income increased in the period of 2002-2005, while the share of the fifth 20% group had a decreasing tendency. In parallel to this, the Gini coefficient indicating the injustice in the income distribution was 0.44 in 2002 and decreased to 0.38 in 2005, ensuring fairer income sharing.
2005 is the year with the fairest income distribution according to the Gini Coefficient. However, this tendency was reversed in 2006, and the share of the first 20% group from total income decreased, while the share of the fifth 20% group from total income increased. Accordingly, the share of the poorest 20% group decreased to 5.1% and the share of the richest 20% group reached 48.4%. This caused an increase of 32% in the difference between the richest and the poorest reaching 9.5%, which means a further increase in the income distribution injustice.
Table 3. Results of the study on income distribution in Turkey (1963-2002)
1963 1968 1973 1986 1987 1994 2002 DPT DPT DPT TUSIAD TUIK TUIK TUIK Total 100.0 100.0 100.0 100.0 100.0 100.0 100.0 First 20% 4.5 3.0 3.5 3.9 5.2 4.9 5.3 Fifth 20% 57.0 60.0 56.5 55.9 49.9 54.9 50.1 Gini Coefficient 0.55 0.56 0.51 0.46 0.43 0.49 0.44 Q 5 /Q 1 12.7 20.0 16.1 14.3 9.6 11.2 9.5 Q 1 + Q 2 13.0 10.0 11.5 12.3 14.8 13.5 15.1 Source: DPT, TUSIAD, TUIK
In 2008, the poorest 20% in Turkey had a share of 5.8% of the total income, while the richest 20% had a share of 56.7. The Gini coefficient of Turkey with respect to the same year was 0.41.
2002 2003 2004 2005 2006 2007 2008 2009 2010 2011 2012 2013 2014 2015 Gini Coefficient 44,00 42,00 40,00 38,00 42,80 40,60 40,50 41,50 40,20 40,40 40,20 40,00 39,10 39,70 P(80/20) 9,4 8,0 7,7 7,2 9,6 8,1 8,1 8,5 7,9 8,0 8,0 7,7 7,4 7,6 0,0 2,0 4,0 6,0 8,0 10,0 12,0 34,00 36,00 38,00 40,00 42,00 44,00 46,00 %
There is an eight-fold difference between the poorest and the richest. In other words, the income distribution justice in Turkey according to the recently calculated data has worsened compared to past years.
6. Breakdown of interest payments per recipient
The state can sell government debt securities to various resources within the political borders. These resources can be listed as individuals, some private organizations, banks, Central Bank resources, and some social security organizations (Ince, 2001: 81).
The banking sector is the resource from which the state benefits the most. Banks have the functions of fund raising and lending and the funds they raise as deposits are used by the state to close the public deficits.
Banks reserve the required reserve ratios determined by the Central Bank and release the remaining funds as funds. However, the banks deposit certain sections of their resources to domestic borrowing securities because of policies applied by the government, legal requirements, high interest ratios of government debt securities, and lack or insufficiency of taxation of interest revenues. This causes a decrease in the credit amounts released to invigorate the real economy, in other words, a narrowing of the loan supply and an increase in credit costs. (Isik, Karayilmazlar, Organ ve Isik, 2005: 78). This reduces the tendency of the banks, which are the biggest recipients of domestic borrowing, to turn the deposits they collected into loans (Karluk, 2005: 145).
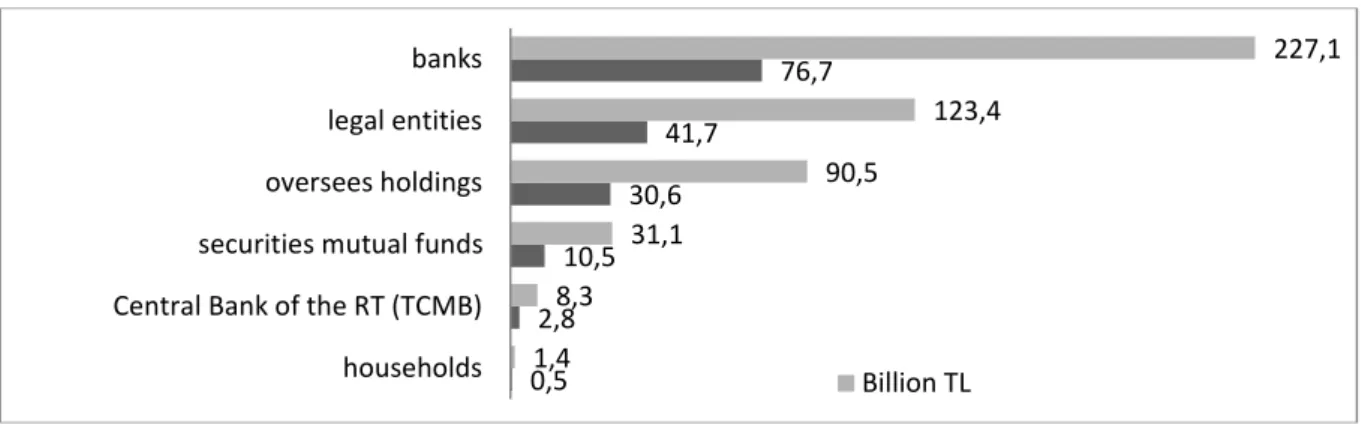
Fig. 5. Breakdown of domestic borrowing per recipients in the 2016. Source: Republic of Turkey Undersecretariat of Treasury
In Fig. 5, banks have a major part in the breakdown of domestic borrowing per recipient, while the share of the legal entities fluctuates, with a small increase in recent periods. Savers, that are the households, remain ineffective among the recipients of domestic borrowing (Sugozu, 2010: 204).
In addition, the underground economy has increased and banks become the official executive means of the state to finance borrowing when resources are insufficient (Guvemli, 2004: 24).
7. Data – methodological analysis and findings
The study included data on the Consumer Price Index (TUFE), the share of indirect taxes within total tax revenues (D), unemployment rates (ISS), the share of domestic borrowing interest payments within budget expenditures (IBF) and interest rates (F) taken from the internet data base of the Republic of Turkey Ministry of Finance and TUIK.
0,5 2,8 10,5 30,6 41,7 76,7 1,4 8,3 31,1 90,5 123,4 227,1 households Central Bank of the RT (TCMB) securities mutual funds oversees holdings legal entities banks
The study used a performance equation (P) to measure the economic performance of the countries, which is a function obtained by a certain weight criteria (w) used for data. This function is described as follows where (i) refers to a certain year:
P(i) = w1TUFE + w2D + w3ISS + w4IBF + w5F (i= 1,2,3,4 ………. 7,8)
(1)
To measure the economic performance criteria of the countries, the Topsis Method has been used, which is one of the multicriteria decision making methods. With this method, the aim is to calculate a single performance score based on four variants and to list the performance sizes accordingly.
7.1. Topsis Method
The Topsis Method was developed as a multicriteria decision making technique by Hwang and Yoon (Shyjith etal. 2008: 376). The method is based on choosing the alternative which is the closest to the positive ideal solution and farthest to the negative ideal solution. The steps of the Topsis method are as follows (Yaralioglu, 2017).
I- Creating a decision matrix (B).
In the decision matrix given as, m refers to the number of decision points, n refers to the number of evaluation factors.
The matrix A refers to the real value of the alternative i according to the criterion j. II- Creating a standard decision matrix (R).
A standard decision matrix is calculated based on matrix B and using the following formula.
(2)
III – Creating a weighted standard decision matrix (V).
Weight grades of the evaluation factor are determined (w). Matrix V is created with these values.
IV = wi.Rij matrix is created.
V- Based on the weighted decision making matrix, ideal B+ and negative ideal B- solutions are created. A positive ideal solution consists of the best performance value of the weighted standard decision matrix while the negative ideal solution consists of the worst values. J+ maximization and J- minimization values are obtained by using these best and worst values.
v
j
J
B
(max
ij
(3)
v
j
J
B
(min
ij
(4)
b
ij mxnB
m k kj ij ijb
b
R
1 2V – The distance from the alternative ideal solution J is calculated by using the following formula with the order of ideal separation S+, distance from negative ideal solution negative ideal separation S-.
n
j j ijv
v
S
1 2)
(
(5)
and
n
j j ijv
v
S
1 2)
(
(6)
VI- Based on the positive and negative ideal separation, relative distance to the ideal solution
is calculated by using the
S
S
S
C
formula. The value C is in these gaps including 0 and 1. Near 1 C value indicates positive ideal solution and near 0 C value indicates negative ideal solution. So the value near to 1 refers to a better performance.
7.2. Findings
The economic performance of Turkey for the years 2002-2015 is shown with the following equation.
P(i) = w1TUFE + w2D + w3ISS + w4IBF + w5F (i= 1,2,3,4 ………. 7,8)
(7)
Accordingly, the performance variables of the equation are defined with the Consumer Price Index (TUFE), the share of indirect taxes within total tax revenues (D), unemployment rates (ISS), the share of the domestic borrowing interest payments within budget expenditures (IBF) and interest rates (F). The decision matrix and standard decision matrix of this data are created with the values of the data. Accordingly, the decision matrix is described with the following table.
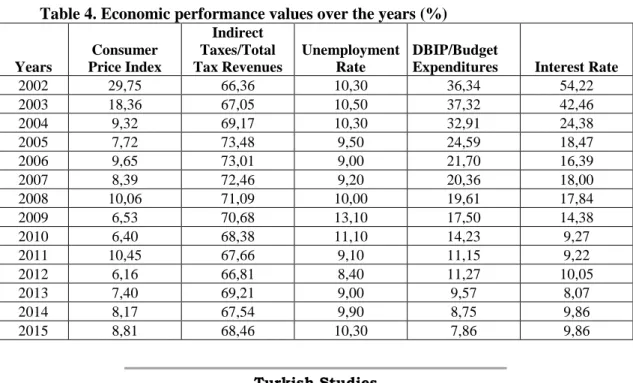
Table 4. Economic performance values over the years (%)
Years Consumer Price Index Indirect Taxes/Total Tax Revenues Unemployment Rate DBIP/Budget
Expenditures Interest Rate
2002 29,75 66,36 10,30 36,34 54,22 2003 18,36 67,05 10,50 37,32 42,46 2004 9,32 69,17 10,30 32,91 24,38 2005 7,72 73,48 9,50 24,59 18,47 2006 9,65 73,01 9,00 21,70 16,39 2007 8,39 72,46 9,20 20,36 18,00 2008 10,06 71,09 10,00 19,61 17,84 2009 6,53 70,68 13,10 17,50 14,38 2010 6,40 68,38 11,10 14,23 9,27 2011 10,45 67,66 9,10 11,15 9,22 2012 6,16 66,81 8,40 11,27 10,05 2013 7,40 69,21 9,00 9,57 8,07 2014 8,17 67,54 9,90 8,75 9,86 2015 8,81 68,46 10,30 7,86 9,86
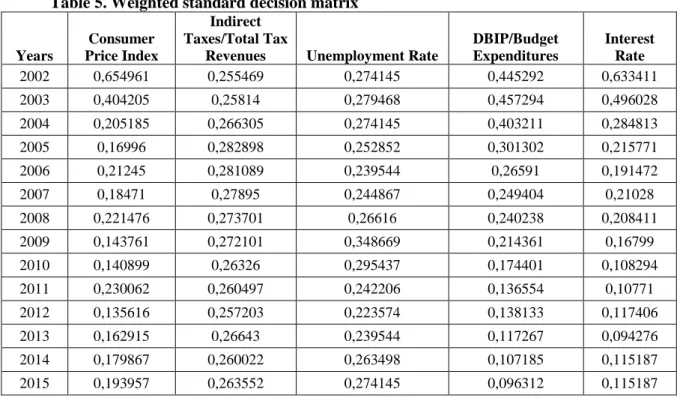
Based on this decision matrix, a standard decision matrix is created. In this matrix, the w value is taken as 1 referring to the weight level. Taking the weight level as 1 assumes that the values other than the four dates used in these years are fixed. Based on this assumption, a weighted standard decision matrix is created by using the w=1 weighted value (Table 5).
Table 5. Weighted standard decision matrix
Years
Consumer Price Index
Indirect Taxes/Total Tax
Revenues Unemployment Rate
DBIP/Budget Expenditures Interest Rate 2002 0,654961 0,255469 0,274145 0,445292 0,633411 2003 0,404205 0,25814 0,279468 0,457294 0,496028 2004 0,205185 0,266305 0,274145 0,403211 0,284813 2005 0,16996 0,282898 0,252852 0,301302 0,215771 2006 0,21245 0,281089 0,239544 0,26591 0,191472 2007 0,18471 0,27895 0,244867 0,249404 0,21028 2008 0,221476 0,273701 0,26616 0,240238 0,208411 2009 0,143761 0,272101 0,348669 0,214361 0,16799 2010 0,140899 0,26326 0,295437 0,174401 0,108294 2011 0,230062 0,260497 0,242206 0,136554 0,10771 2012 0,135616 0,257203 0,223574 0,138133 0,117406 2013 0,162915 0,26643 0,239544 0,117267 0,094276 2014 0,179867 0,260022 0,263498 0,107185 0,115187 2015 0,193957 0,263552 0,274145 0,096312 0,115187
Based on the factor values (columns), the highest value that has the best performance and the lowest value that has the worst performance are chosen. While making this selection, it is checked whether the high and low values in the economic performances are good or bad. With the maximum and minimum values, the matrix S is created indicating the distance from the positive and negative ideal solution.
Table 6. Matrix indicating the distance from the ideal solution
Years S+ S- Conclusion(C) No 2002 0,827484 0,225333 21,40 14 2003 0,605792 0,486894 44,56 13 2004 0,371491 0,75252 66,95 12 2005 0,244072 0,83169 77,31 11 2006 0,212192 0,81873 79,42 10 2007 0,200771 0,834577 80,61 8 2008 0,207989 0,805849 79,48 9 2009 0,188046 0,892553 82,60 7 2010 0,107459 0,940232 89,74 5 2011 0,10532 0,891543 89,43 6 2012 0,047823 0,957684 95,24 2 2013 0,039491 0,955031 96,03 1 2014 0,064252 0,9322 93,55 3 2015 0,080397 0,925072 92,00 4
Fig. 6. Economic performance of the period 2002 - 2015 (%).
When the performance table and fig. 6. above are examined, the first three years with the fairest income distribution considering five data are 2013, 2012 and 2014. On the other hand, 2002, 2003 and 2004 are the years with the worst performance of income distribution. 2002, the worst year in terms of performance, is underlined with the inflation ratio, share of indirect taxes within the total tax revenues, and a high share of the outstanding domestic debt and domestic borrowing interest payments within the budget expenditure and interest rates.
Fig. 7. Comparison of the economic performance and the Gini Coefficient results in the period 2002-2015
When the graph and the correlation coefficient of 68% are both examined, it is seen that the results of the performance and the Gini coefficient demonstrate a parallel development at a high rate. Despite the improvement in the performance values, the Gini coefficient is likely to be the result of a sudden increase in 2006 due to a change in research methodology. While in 2005 and earlier years
0,00 10,00 20,00 30,00 40,00 50,00 60,00 70,00 80,00 90,00 100,00 2002 2003 2004 2005 2006 2007 2008 2009 2010 2011 2012 2013 2014 2015 35,0 36,0 37,0 38,0 39,0 40,0 41,0 42,0 43,0 44,0 45,0 20 30 40 50 60 70 80 90 100 2002 2003 2004 2005 2006 2007 2008 2009 2010 2011 2012 2013 2014 2015 Performans Gini Katsayısı
calculations were made according to Household Budget Survey, Income and Living Conditions Survey has started to be done since 2006. When the correlation coefficient is recalculated accordingly, the relationship between the performance results and the Gini coefficient results becomes even clearer. The correlation coefficient is calculated as 98.7% prior to 2006 while it has been calculated as 71.6% since 2006. Consequently, the new results indicate that the relationship between the performance results and the Gini Coefficient is much stronger in Turkey in the period of 2002-2015.
8. Conclusion
The reduction in the investments and in national income caused by the high interest rates is the most important negative result in terms of economic growth and income per person. Allocating an important part of the budget expenditure to interest spending will give the same results.
High interest payment causes an imbalance creating an income transfer from people to capital owners. The high ratio of the indirect taxes to total taxes deepens this imbalance. Other important reasons of unfair income distribution are high interest, inflation and unemployment ratios.
The period of 2002-2015 has been a year of fluctuation of income distribution in Turkey. When we look at the performance values in this period, it is possible to conclude as follows. Income distribution has been fairer in periods when the share of domestic borrowing interest payments in the budget expenditures started to decrease, when the unemployment rate was less, the share of the indirect taxes within total taxes started to decrease, and when the consumer price index (inflation rate) and interest rates started to decrease.
REFERENCES
Akdis M. (1995). Faiz Politikalarinin Enflasyon Uzerindeki Etkileri ve Turkiye. Ankara: Yimder Publications.
Aktan C. C., Vural I. Y. (2002). Makroekonomik Politikalar, Gelir Dagilimi ve Yoksulluk. Coskun Can Aktan (Ed.), Yoksullukla Mucadele Stratejileri, Ankara: Hak-Is Konfederasyonu. Altug O. (1999). Karsilikli Etkilesim (Ekosistem) Yaklasimi İcinde Finansal Sorunlarimiz ve Cozum
Yollari. Muhasebe Finansman Dergisi
Bayraktar Y. (2009). Ic Borclanmanin Ekonomik ve Sosyal Etkileri:1980 Sonrasi Turkiye Deneyimi. Erciyes Universitesi IIBF Dergisi, 285-313.
Bilen M., Es M. (1998). Gelir Dagilimi Sorunu ve Cozumunde Yeni Arayislar. Yonetim ve Siyasette Etik Sempozyumu, 376-399.
Bulbul D., Ejder H. L., Sahan O. (2006). Turkiye’de Kamu Borclarinin Kaynaklari, Yapisi Ve Niteliklerinin Degerlendirilmesi (1990-2004 Donemi Analizi). I.U. Siyasal Bilgiler Fakultesi Dergisi, 101-123.
Bulut C., Canbolat Y. B. (2003). Turkiye Ekonomisi’nde Artan Kamu Aciklarinin Enflasyon, Faiz Orani ve Doviz Kuru Uzerindeki Etkileri. Journal of Qafqaz University, 13-28.
Bulut C., Canbolat Y. B. (2003). Turkiye Ekonomisi’nde Artan Kamu Aciklarinin Enflasyon, Faiz Orani ve Doviz Kuru Uzerindeki Etkileri. Journal of Qafqaz University, 13-28.
Cataloluk C. (2009). Kamu Borclanmasi, Gerceklesme Bicimi ve Makroekonomik Etkileri Teorik Bir Yaklasim, Turkiye Ornegi. Balikesir Universitesi Sosyal Bilimler Enstitusu Dergisi, 240-58.
Ceyhan S. (2005). Turkiye’de Kamu Borclarinin Boyutlari ve Karsilastirilmasi ile Kamu Borclanma Gereginin Temel Nedenleri. Ataturk Universitesi Erzincan Hukuk Fakultesi Dergisi, 635-664.
Coban O., Doganalp N., Uysal D. (2008). Turkiye’de Kamu Ic Borclanmasinin Makroekonomik Etkileri. SU Sosyal Bilimler Enstitusu Dergisi, 245-255.
Demir M., Sever E. (2008). Kamu ic Borclanmasinin Buyume, Faiz ve Enflasyon Orani Uzerindeki Etkileri. Elektronik Sosyal Bilimler Dergisi, 170-196.
DPT (2001). Gelir Dagiliminin İyilestirilmesi ve Yoksullukla Mucadele. Ankara:DPT Publications, 1-186.
Erdem M. (2006). Devlet Borclari. 2nd edition, Bursa: Ekin
Ersezer D. (2006). Gelir Dagilimi Politikasi ve Araclari. Firat Universitesi Sosyal Bilimler Dergisi, 255-268.
Ersoy A. (2008). İktisadi Teoriler ve Düşünceler Tarihi, 3. Baski, Ankara: Nobel
Gok A. (2003). Turkiye’de İc Borclanmanin Ekonomik Etkileri. M.U. IIBF Dergisi, 119-138. Gokcen A. (2002). Turk Ekonomisi’nde Borclarin Gelisimi. Erişim Tarihi: 25.01.2017,
http://readgur.com/doc/80758/i%CC%87ndir-202-kb.---prof.-dr.-ahmet-mucip-g%C3%B6k%C3%A7en
Guvemli O. (2004). Ic ve Dis Borclarin Ekonomik ve Sosyal Bunyedeki Tahribati Artarak Devam Ediyor. Muhasebe ve Finansman Dergisi, 22-33.
Guven S. (1983). Temmuz Bankaciliginin Toplumdaki Gelir ve Servet Dagilimi Uzerine Etkileri. Amme Idareler Dergisi, 87-107.
Ince M. Devlet borclari ve Turkiye. Ankara:Gazi Kitabevi, 2001 .
Isik K., Karayilmazlar E., Organ I., Isik H. (2005). Devlet Borclari. Bursa: Ekin. Isik K., Karayilmazlar E., Organ I., Isik H. (2005). Devlet Borclari. Bursa:Ekin.
Karabulut K., Demir S. (2011). Ic Borclarin Gelir Dagilimi Uzerine Etkileri”, Ankara Universitesi Iktisadi ve Idari Bilimler Dergisi, 25/1, 13-30.
Karluk R. (2005). Turkiye Ekonomisi’nde Yapisal Donusum. 10th Edition, Istanbul:Beta.
Kocak A. (2009). Kuresel Donemde Turkiye’nin Borc Yapisindaki Donusum. Maliye Dergisi, 65-84.
Meric M. (2003). Borclanmanin Konsolide Butce Kaynak Yapisi Uzerindeki Etkisi. XVIII.Turkiye Maliye Sempozyumu, 12-16 Mayis, Girne-Kibris, Marmara Universitesi Maliye Arastirma Merkezi (Yayin No:16), Istanbul, s. 489-523 .
Onder T. (2005). Para Politikasi:Araclari, Amaclari ve Turkiye Uygulamasi. TCMB Piyasalar Genel Mudurlugu, Master’s thesis, Ankara
Ozgen F. B. (1999). Turkiye’de Ic Borc Sorunu ve Ic Borclarin Sinirlandirilmasi. Yeni Turkiye Dergisi, 353-373.
Palamut M. E., Yuce M. (2001). Turkiye’de 1980 – 2000 Doneminde Gerceklesen Gelir Dagiliminin İstenen Vergi ile Egitim ve Saglik Harcamalari İliskisi, Turkiye’de 1980 Sonrasi Mali Politikalar. XVI.Turkiye Maliye Sempozyumu. 28 – 31 Mayis, Antalya.
Pehlivan M. S. (2009). Gelir Dagilimi Eşitsizliğine Devletin Müdahale Araclari. (Yayınlanmamis T.C. Basbakanlik Sosyal Yardimlasma ve Dayanisma Genel Mudurlugu Uzmanlik Tezi), Ankara
Peker O., Acar Y. (2010). Turkiye’de Konsolide Butce Aciklariyla-İc Borclanma Faiz Oranlari Arasindaki İliski:Ekonometrik Bir Analiz. C.U. Iktisadi ve Idari Bilimler Dergisi, 11/1, 193-206
Sahin H. (2009). Turkiye Ekonomisi. Bursa: Ezgi
Saracoglu B. (1998). Mali Aciklarin Turkiye Ekonomisi Uzerindeki Rolu ve Enflasyonla Mucadelede Etkili Politikalarin Secimi. ODTU Gelisme Dergisi, 2, 329–359.
Sugozu I. H. (2010). Devlet Borclari IMF- Dunya Bankasi ve Turkiye. Ankara: Nobel.
Sugozu I. H., Yiyit M. (2010) Borclanmanin Enflasyona Etkisi Uzerine Teorik Yaklasimlarin Temel Ozellikleri. Maliye Dergisi, 365-373.
Tunca A. (1993). Kamu Kesiminin Ozel Kesimin Fon Kullanim Olanaklarinin Daraltma Etkisi (Crowding Out). Banka ve Ekonomik Yorumlar Dergisi, 47-51.
Uluatam O. (1999) Kamu Maliyesi. Ankara: Imaj.
Ulusoy A., Cural M. (2006). Turkiye’de 1980 Sonrasi Donemde Ic Borclarin Surdurulebilirligi. ZKU Sosyal Bilimler Dergisi, 1-21.
Yamak R., Tanriover B. (2008). Faiz Orani, Getiri Farki ve Ekonomik Buyume. 2. Ulusal Iktisat Kongresi, DEU Iktisat Bolumu, 20-22 Subat, Izmir.
Yaralioglu K. Topsis Yontemi. http://debis.deu.edu.tr/userweb//k.yaralioglu/dosyalar/ TOPSIS_Yontemi.doc, 04.01.2017.
Yeldan E. (2004). Turkiye Ekonomisi’nde Dis Borc Sorunu ve Kalkinma Stratejileri Acisindan Analizi. Calisma ve Toplum, 1-29.